Download presentation
Presentation is loading. Please wait.

1
What We Know and How We Know It Mary Sullivan, MSW Food Bank of Alaska Food Insecurity in Alaska:

2
What We Will Cover Today Food Insecurity definitions and data, causes and correlations Changing Face of Hunger – client demographics Programs available to address hunger in Alaska

3
Food Insecurity Defined Food insecurity, defined as the inability to access sufficient, safe, and nutritious foods in socially acceptable ways Higher in low-income population, but not restricted to low-income

4
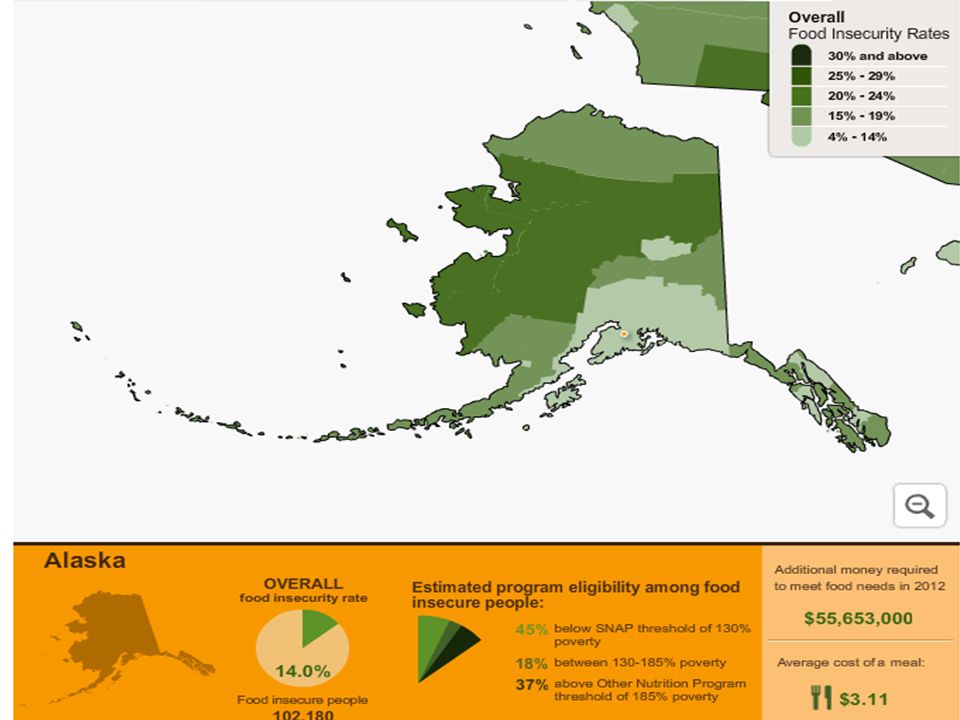
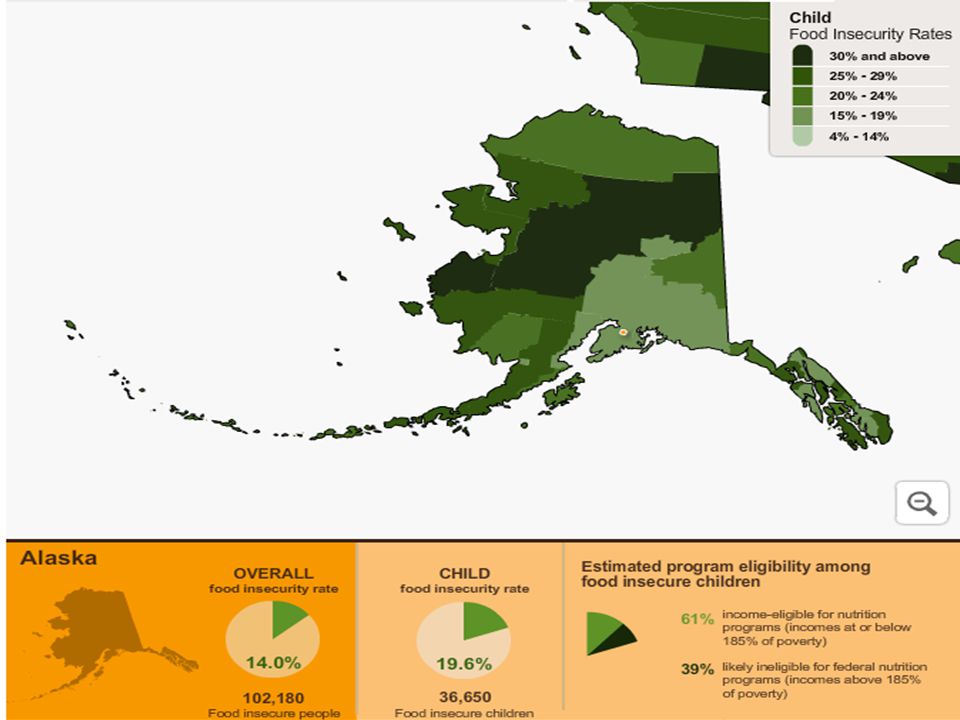
Map the Meal Gap 102,180 Alaskans, or 14%, are food insecure 36,650 or 19.6% of Alaskan children are food insecure

7
Household Food Security Study http://www.ers.usda.gov/media/1565415/err173.pdf

8
Food Hardship Asks one question “Have there been times in the last twelve months when you did not have enough money to buy food that you or your family needed?” 19.2% of Alaskans answered yes, up 1% since the 2011 study We rank 23 rd for food hardship rates in the nation

9
BRFSS Behavioral Risk Factor Surveillance System Phone survey conducted biennially by State of Alaska (and most states) Intended to learn about behavior that leads to health risks, like smoking
 Intended to learn about behavior that leads to health risks, like smoking")
10
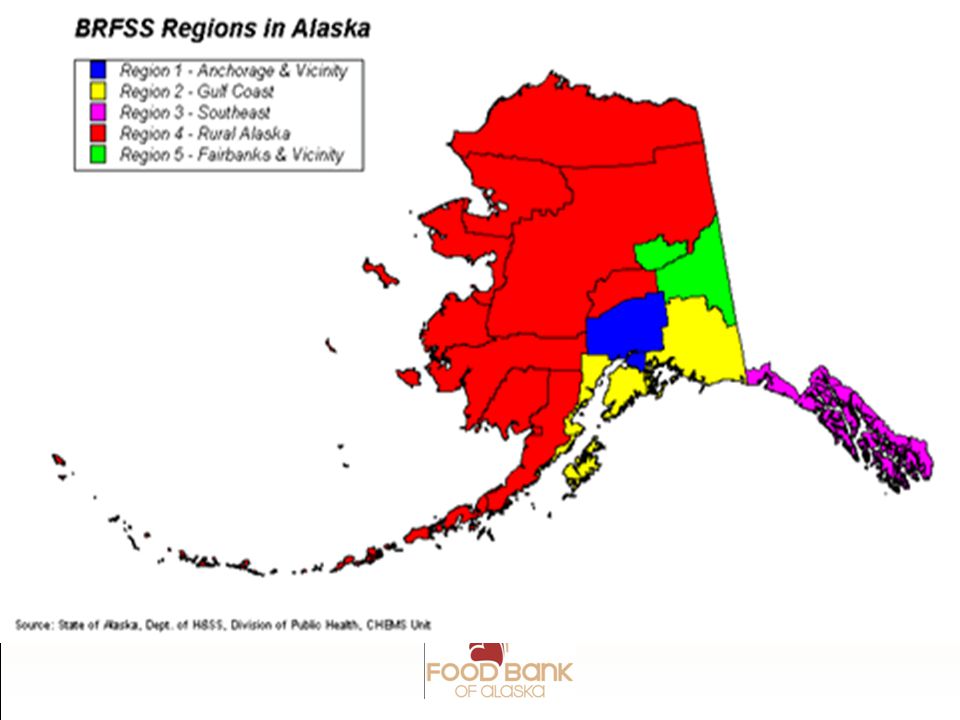
BRFSS Alaska WIC paid to add a selection of the Household Food Security Study questions to BRFSS in 2006 The idea was to get a more granular sense of the ‘universe of need’ – broken down by region in the state

12
BRFSS % of Food Insecure Adults % of Food Insecure Children Alaska11 %15 % Anchorage10 %15 % Gulf Coast11 %14 % Southeast7 %9 % Rural20 %24 % Fairbanks9 %14 %

13
2014 Hunger Study Coordinated by Feeding America Alaska Food Coalition and FBA staff and volunteers conducted in-person interviews of 619 Alaskans in spring 2012-2013 Interviews conducted in a random sample of communities statewide Conducted 77 program visits in network Surveyed 194 partner agencies

14
2014 Hunger Study Aims to learn who is seeking food assistance – demographic information on current clients and certain information about programs offered in our network Best source of data on the details of who is hungry in Alaska

15
2014 Hunger Study – Changing Face of Hunger Who Are We Serving? 1 in 7 Alaskans turn to our network for help each year. Including: –184,000 Alaskans served annually (or 63,200 households); 21,200 unique clients in a typical week (or 7,700 households). –32% children under 18 –13% seniors aged 60 and older
; 21,200 unique clients in a typical week (or 7,700 households). –32% children under 18 –13% seniors aged 60 and older.")
16
Changing Face of Hunger 23.3% at least one member has served in military, 2.6% are currently serving 60.3% worked for pay in last 12 months –43% worked for pay in last four weeks. More likely to work part time 21% of households are retired and 69% of households cannot work due to disability. – 11% of households include grandparents who have responsibility for grandchildren who live with them

18
Hungry People Are Faced With Difficult Choices 64% making choices between food/transportation 56% making choices between meds/meals 53% making choices between housing/food 59% making choices between utilities/food

19
Health of Clients 26% of households reports at least one member with diabetes 47% have high blood pressure 34% have no health insurance 56% have unpaid medical bills

20
Income of Clients 53% of clients served have incomes that are at or below the federal poverty level ($15,510 or less for household of two) 27% have incomes between $1-$10,000 annually; 29% have incomes of $10,001-$20,000 annually
 27% have incomes between $1-$10,000 annually; 29% have incomes of $10,001-$20,000 annually")
21
100% of Poverty Line Family or HouseholdAlaska 1$14,580 2$19,660 3$24,740 4$29,820

22
Education of Clients 7% have an adult student in the home 87% of all clients have attained a high school degree or GED or more, 35% of all clients have post-high school education (including license or certification, some college or a four-year degree

23
Housing and Clients 12% of households own their home with a mortgage 60% rent or lease 88% of clients live in non-temporary housing/”stable” housing 17% starting living with another family in the past 12 months to make ends meet 15% have faced eviction

24
Housing Continued 7% of households do not have access to cooking facilities such as stove or hot plate 15% of households don’t have access to place to preserve fresh food, such as a refrigerator

26
Hunger & SNAP 45% of households participate in SNAP but 26% report that their benefits last only one week or less; 30% report lasting two weeks; 25% report that benefits last for three weeks; and 19% report that benefits usually last four weeks or more. 20% of clients not participating in SNAP cite believing they are not eligible as reason for not participating

27
Hunger & Top Desired Food Top three desired food items of clients reported was: Dairy products such as milk, cheese, or yogurt (29%); fresh fruits and vegetables (53%); protein food items like meats (54%)
; fresh fruits and vegetables (53%); protein food items like meats (54%)")
28
Client Coping Strategies –Eaten food past expiration date – 71% –Grew food in garden – 18% –Purchased food in dented or damaged packages 57% –Purchased inexpensive, unhealthy food – 81% –Received help from family or friends – 54% –Sold or pawned personal property – 29% –Watered down food or drinks – 37%

29
Low Income Neighborhoods & Obesity Research is limited on the relationship between food insecurity, poverty, and weight Complex relationship of issues: lack access to healthy, affordable foods, yet have an unequal proportion of fast-food restaurants and convenience stores that provide large portions of cheap, high calorie foods.

30
FBA Partner Agency Network

31
Charitable Anti-Hunger System Food Pantries, Soup Kitchens Food Bank of Alaska USDA Food Industry Community Community Food Banks State of Alaska

32
How Families Get Help Charitable efforts – soup kitchens, food pantries, summer camps, feeding neighborhood kids FBA distributed nearly 7 million pounds of food in FY13 through the charitable food network around Alaska.

33
Agencies in our Network Meal Programs make up 19.5% of network and Grocery programs make up 80.5% 50% are faith based 64% of agencies report employing paid staff. The median number of paid FTEs was 5; however, Average agency relies on multiple part-time individuals to make up one full time position.

34
Agencies in our Network Volunteer work force is used the median number of volunteers assisting at programs in a typical week is 5, giving a median of 19 volunteer hours each week. 8% of volunteers are age 18 or younger 64% of volunteers are between 19-59 years old, and 28% are age 60 or older.

35
Food Need and Sources of our Network Partners 37% of agencies report having somewhat less or a lot less food than needed to meet clients’ needs. Average percentage of total food distributed by food programs in the past 12 months by source: –51.8% came from FBA –13.5% donations –31.0% purchased –3.6% other

36
Some Charitable Child Nutrition Programs KNN – Knowledge Needs Nutrition Back Pack Buddies – Faith Christian The Children’s Lunchbox, weekend food program Dare to Care Schools Foundation

37
Food Assistance Programs: How Families Get Help School Meals About 44% of all school children in Alaska qualify for free or reduced price meals After School Meals (CACFP) –15 rural communities Summer Food Service Program (SFSP) –55 rural communities serving over 65,000 meals
 –15 rural communities Summer Food Service Program (SFSP) –55 rural communities serving over 65,000 meals")
38
When School is Out Two USDA programs – Child and Adult Care Food Program Ann-Marie Martin Alaska CACFP Specialist annmarie.martin@alaska.gov Summer Food Service Program Veronica Lietz Alaska SFSP Specialist veronica.lietz@alaska.gov http://education.alaska.gov/tls/cnp

39
Child and Adult Care Food Program The most complex federal program ever invented (well, one of them at least) Many options: Child Care Centers & Family Day Care Homes, Head Starts & Pre-Schools, Emergency Shelters and… At-Risk Afterschool Meals – thanks to the 2010 Healthy, Hunger Free Kids Act
 Many options: Child Care Centers & Family Day Care Homes, Head Starts & Pre-Schools, Emergency Shelters and… At-Risk Afterschool Meals – thanks to the 2010 Healthy, Hunger Free Kids Act")
40
Child and Adult Care Food Program At-risk meals is a reimbursement program for suppers/snacks served to children after school Meals must meet USDA meal pattern requirements (and they are different from SFSP!) Sites must offer an activity in order to qualify for the at-risk meals program, kids are not required to participate in the activity in order to get the meal
 Sites must offer an activity in order to qualify for the at-risk meals program, kids are not required to participate in the activity in order to get the meal")
41
Child and Adult Care Food Program Site MUST be located in an impoverished area Site is located in the attendance area of a public school where at least 50% of students are eligible for F/RP meals under NSLP

42
Number of At-Risk Sites in AK At-Risk Afterschool Meal Sites (serving suppers during school year): 37 At-Risk Afterschool Meal Sites (serving afterschool snacks during school year): 59
: 37 At-Risk Afterschool Meal Sites (serving afterschool snacks during school year): 59")
43
Child and Adult Care Food Program Because at-risk meals program is new, this program is still very small in Alaska FBA is sponsoring 8 at-risk meal sites; 7 in rural Alaska this year and 1 in Anchorage Some school districts are also operating the at-risk meal program at their schools: Anchorage, Dillingham, Haines, and Petersburg

44
Benefits of CACFP Participation Studies show that –children in CACFP receive meals that are nutritionally superior to those served to children in child care settings without CACFP. –Children in participating institutions have higher intakes of key nutrients, fewer servings of fats and sweets, than children in non- participating care. http://frac.org/federal-foodnutrition-programs/child-and-adult-care-program/

45
Benefits of CACFP Cont’d. Research cites participation in CACFP as one of the major factors influencing quality care – 87 percent of the family child care homes considered to be providing quality child care participated in CACFP. http://frac.org/federal-foodnutrition-programs/child-and-adult-care-program/

46
Benefits of CACFP Cont’d. CACFP also makes child care and afterschool programs more affordable for low-income parents, who rely on these programs to provide a safe and healthy place for their children. 87 percent of the family child care homes considered to provide good quality care participate in CACFP. http://frac.org/federal-foodnutrition-programs/child-and-adult-care-program/

48
Summer Food Service Program A reimbursement program for meals served to children under age 19 during the summer Meals must meet USDA meal pattern requirements

49
Key Players USDA – sets the rules State of Alaska – administers the rules Sponsor – takes legal responsibility and maintains paperwork Site – provides meals to kids

50
Food Flexibility Self-prep – make food on-site Vended – purchase food from someone else, hot or cold Pre-packed – shelf-stable ‘lunch-able’ type meals

51
Some of the Headaches Not all sites qualify – they have to be located in a low-income area or take income applications Sites must be monitored at least three times during the summer Paperwork

52
Getting Creative Unusual sites – DPA offices, Food Pantry of Wasilla, libraries Using local monitors for rural sites

53
FBA SFSP Site, Holy Cross

55
Bigger SFSP Sponsors Food Bank of Alaska The Children’s Lunchbox Campfire USA Alaska Council Grandview Baptist Church Boys and Girls Club

56
SFSP Results In 2012, there were about 160 SFSP sites in Alaska that served about 259,804 meals Kids served per day on average was about 4,661

57
Other Federal Programs Food Stamps/SNAP – 91,000 in FY13 (1 in 8 people) WIC – 23, 055 in FY13 TANF – 3,352 (not including tribal providers)
 WIC – 23, 055 in FY13 TANF – 3,352 (not including tribal providers)")
58
Food Stamps/SNAP Largest federal nutrition program 91,000 Alaskans participated in FFY2013 Average benefit per person is $170.07 per month Average benefit per family is $414 per month

59
Food Stamps/SNAP Cont’d. Benefits are placed on a debit card and can only be used to purchase food Food Stamp benefits last, on average, 2.5 weeks 76% of SNAP households contain a child, senior, or disabled member, and 84% of all benefits go to these households

60
Other Food Programs at Food Bank of Alaska CSFP – Commodity Supplemental Food Program Administered by the State of Alaska, Department of Health & Social Services Distributes nutritious foods to low-income seniors, pregnant or postpartum women and children up to their 6 th birthday that are not on WIC

61
Other Programs - CSFP CSFP food boxes are available once a month to eligible clients. Different eligibility requirements for each group There are currently 19 FBA affiliated CSFP distribution agencies throughout Anchorage, the Mat-Su Valley and Southeast (does not include KPFB’s agencies +5)
.")
62
Other Programs - TEFAP TEFAP – The Emergency Food Assistance Program Administered by the State of Alaska, Department of Education & Early Development Provides a once a month food allotment of USDA foods to eligible low-income households

63
Other Programs – TEFAP Cont’d Income based eligibility Households must go through a TEFAP distribution agency to participate in the program There are currently 44 FBA affiliated TEFAP distribution agencies throughout Alaska (does not include KPFB (+2) and FCFB agencies)
 and FCFB agencies)")
64
Other Programs - FDPIR FDPIR Provides a once a month allotment of USDA foods to eligible low-income households living in Alaska villages with fewer than 10,000 people. Administered by ANTHC

65
Other Programs – FDPIR Cont’d Households must go through an FDPIR distribution agency in their village to participate in the program. Households cannot participate in FDPIR and Food Stamps at the same time There are currently 19 FDPIR distribution agencies in rural Alaska

66
Concluding Thoughts Federal nutrition assistance programs are critical in helping to feed hungry Alaskans and have been shown to improve food security for low income people. Kids who have access to enough healthy, balanced meals perform better in school

67
Concluding Thoughts Nutrition programs help free up resources for families so they don’t have to choose between food and rent or heating fuel. Programs that help reduce poverty and improve low income neighborhoods to increase access to healthy, affordable foods and more opportunities to be physically active have an important part of a healthy Alaska!

68
What Can You Do? Charities, individuals, and government all have a role to play. Please consider giving: –Funds & Food – for every dollar we can buy 4 meals –Voice – Advocacy during CNR in 2015 –Time - Volunteer

69
Thank you! Mary Sullivan, MSW msullivan@foodbankofalaska.org 907-222-3113

Similar presentations

>")


