Download presentation
Presentation is loading. Please wait.

1
Performance Measurement in the Pensions Fund Industry By Ian Tonks Xfi Centre for Finance and Investment [joint work with David Blake (CASS), Alan Gregory (Exeter) & Allan Timmermann (San Diego)]
![Performance Measurement in the Pensions Fund Industry By Ian Tonks Xfi Centre for Finance and Investment [joint work with David Blake (CASS), Alan Gregory (Exeter) & Allan Timmermann (San Diego)]](http://images.slideplayer.com/20/5940158/slides/slide_1.jpg "Performance Measurement in the Pensions Fund Industry By Ian Tonks Xfi Centre for Finance and Investment [joint work with David Blake (CASS), Alan Gregory (Exeter) & Allan Timmermann (San Diego)]")
2
Can Pension Fund Managers Consistently Beat the Market? Myners’ Report (2001): “selecting managers according to past performance figures first and brand second is widely acknowledged to be a poor way to select a manager” (paragraph 5.44).
: selecting managers according to past performance figures first and brand second is widely acknowledged to be a poor way to select a manager (paragraph 5.44)..")
3
Segregated Funds – CAPS Sample Quarterly returns on UK equity portfolio of 2,364 occupational segregated pension funds 1984-2004 Identifies the fund management house managing the fund in each quarter: 275 fund management houses In-house and external Performance of fund manager measured by average abnormal returns of funds under management Alternative benchmarks taking account of style considerations: three factor model taking account of size and value/growth

4
Asset-class Allocation by UK Pension Funds 1984-2004

5
Structure of Pension FM Industry

6
Performance of Fund Managers (annualised) Mean AR=-0.0007
 Mean AR=")
7
Performance Persistence Methodology Performance ranked portfolio strategies Sort fund managers each year into quintile portfolios over ranking period Measures average quintile-portfolio abnormal return over evaluation period Contingency tables Percentage of repeat winners Cross-product ratio CP Independence of cells

8
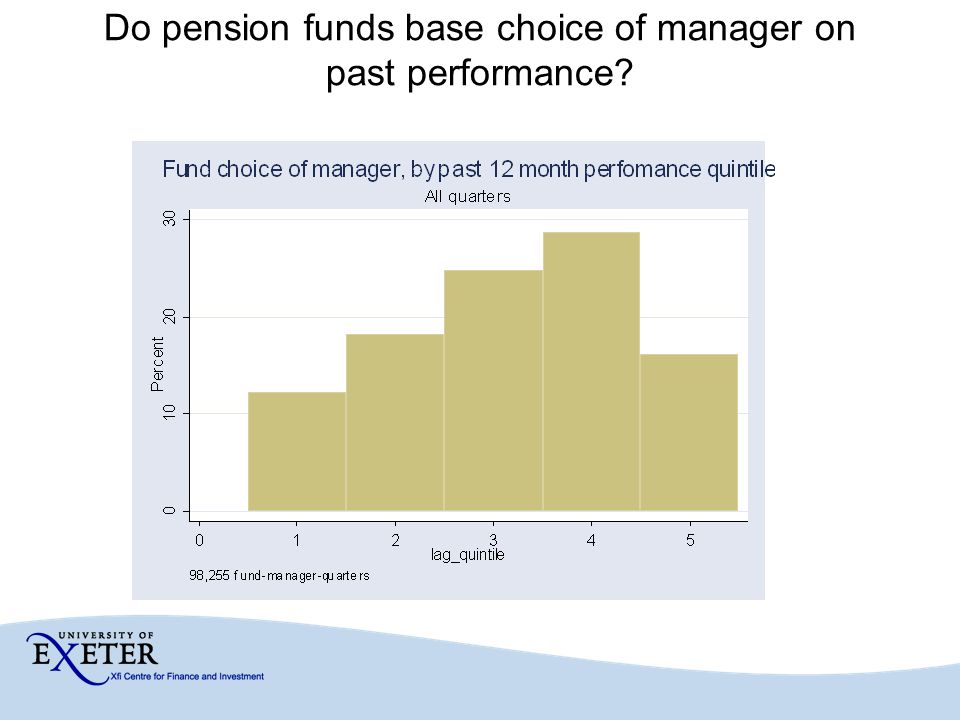
Findings Some evidence of performance persistence at one-year, out to three-year horizons Evidence of persistence in abnormal returns weakens at longer time horizons Returns on “Arbitrage portfolio” of long in winners and short in losers over past 12 months generates annualised return of 1.57% Evidence that funds choose managers on basis of past performance, particularly when changing managers

9
Persistence Tests based on 3-factor Abnormal Returns of Fund Manager Performance AV5AV1DIFTDIF 1QR-1QE0.0011-0.00100.00211.90 4QR-4QE0.0017-0.00220.00395.75* 12QR-12QE0.0012-0.00180.00303.31* 20QR-20QE0.0007-0.00020.00091.14 NPRWCPZ-statCHI 1QR-1QE8,0890.5161.0901.9434.149 4QR-4QE1,7750.5691.627*5.08926.408* 12QR-12QE3490.6021.896*2.9459.728* Performance ranked portfolio strategies: Contingency tables:

10
Do pension funds base choice of manager on past performance?

12
What if we only consider quarters when funds are changing manager?

13
Personal Pensions - Micropal 506 exempt unit trusts in UK equity portfolios June 1980 - December 2000, (247 months) Strong evidence of persistence at medium-term time intervals of between 6 to 12 months Negative persistence at short horizons, weak positive persistence, at longer time intervals.
 Strong evidence of persistence at medium-term time intervals of between 6 to 12 months Negative persistence at short horizons, weak positive persistence, at longer time intervals.")
14
Persistence Tests based on 3-factor Abnormal Returns of Personal Pension Performance # periodsAV5AV1DIFTDIF 1MR1ME246-0.00140.0016-0.0030*-2.35 3MR3ME2420.00010.0005-0.0003-0.47 6MR6ME2360.0008-0.00050.0013*2.39 12MR12ME2240.0011-0.00050.0015*2.42 36MR36ME176-0.0001-0.00070.00061.52 N PRWCPZ-statCHITCS 1MR1ME54,4770.4690.768*-15.38237.53*-33.32* 3MR3ME17,1890.5071.0411.3191.94-2.97* 6MR6ME8,5170.5281.215*4.49420.46*4.63* 12MR12ME3,7370.5281.243*3.31911.06*9.26* 36MR36ME7190.4510.736*-2.0494.61-1.14

15
Comparison of Personal & Segregated Fund Manager Performance

16
Persistence Tests based on 4-factor Abnormal Returns: Exact comparison of SF & PP Performance 1984-97

17
Average abnormal performance of pension fund equity-managers close to zero Significant performance persistence at 1 year horizon, and up to 3 years, but persistence weakens at longer horizons Evidence that fund choose managers on basis of past performance Caveats: Substantial transactions costs in shifting a pension funds’ assets from one fund manager to another, on yearly basis No allowance for the costs of fund management. Myners (2001) suggests annual costs of 40 basis points of the funds under management for a £100 million mandate. Similar evidence on persistence for unitised personal pensions Conclusions
 suggests annual costs of 40 basis points of the funds under management for a £100 million mandate. Similar evidence on persistence for unitised personal pensions Conclusions.")
Similar presentations


 Single-Factor APT Model Multi-Factor APT Models Arbitrage Opportunities Disequilibrium in APT Is APT.>")


