Download presentation
Presentation is loading. Please wait.

1
Spectroscopy of Organic Compounds
Islamic University in Madinah Department of Chemistry Spectroscopy of Organic Compounds Prepared By Dr. Khalid Ahmad Shadid

2
The Identification of Organic Compounds
Physical Properties Melting Point Boiling Point Density Solubility Refractive Index Chemical Tests Hydrocarbons Alkanes Alkenes Alkynes Halides Alcohols Aldehydes Ketones Spectroscopy Mass (Molecular Weight) Ultraviolet (Conjugation, Carbonyl) Infrared Functional Groups NMR (Number, Type, Location of protons) Gas Chromatography (Identity, Mole %)
 Ultraviolet. (Conjugation, Carbonyl) Infrared. Functional Groups. NMR. (Number, Type, Location of protons) Gas Chromatography. (Identity, Mole %)")
3
Methods in General Use

4
Spectroscopy The study of interaction of spectrum of light with a substance to be analysed, for its identification (i.e qualitative analysis) as well as determination of its amount (i.e quantitative analysis). The Absorption of Electromagnetic Radiation and the use of the Resulting Absorption Spectra to Study the Structure of Organic Molecules.
 as well as determination of its amount (i.e quantitative analysis). The Absorption of Electromagnetic Radiation and the use of the Resulting Absorption Spectra to Study the Structure of Organic Molecules.")
5
Structural Features we can address Spectroscopically
Molecular weight Chemical Formula Functional groups Skeletal Connectivity, structural isomers Spatial-geometric arrangements, stereoisomerism, symmetry Presence and location of chromophores Chirality issues Some of these are more central than others. Sometimes we can stop when the answer is fit to purpose.

6
Techniques we will study in this Course
NMR--looks at atoms by means of their nuclei. Connectivity pathways, spatial arrangements of atoms and 1:1 correspondence between signals and atoms Mass Spec--measures molecular weight, most fundamentally useful for unknowns. Controlable fragmentation can distinguish among rival possibilities IR -Vibrations characteristic of bonds, particulary for functional group identification. Excellent “fingerprint” UV--reports on conjugation and multiple bonds.

7
Limitations Can we ever achieve a fully secure structure? Harrisonin
Heterocycles 1976, 5, 485. J. Nat. Prod. 1997, 60, 822

8
Limitations Can we ever achieve a fully secure structure?
(+)-Neopeltolide J. Nat. Prod. 2007, 70, 412. J. Am. Chem. Soc. 2008, 130, 804
-Neopeltolide. J. Nat. Prod. 2007, 70, 412. J. Am. Chem. Soc. 2008, 130, 804.")
9
The following topic will help you to understand bonding
Molecular Orbitals Molecular orbitals (MOs) are mathematical equations that describe the regions in a molecule where there is a high probability of finding electrons Molecular orbitals (MOs) are essentially combinations of atomic orbitals – two types exist, bonding and antibonding orbitals Molecular orbitals (MOs) are built up (Aufbau principle) in the same way as atomic orbitals
 are mathematical equations that describe the regions in a molecule where there is a high probability of finding electrons. Molecular orbitals (MOs) are essentially combinations of atomic orbitals – two types exist, bonding and antibonding orbitals. Molecular orbitals (MOs) are built up (Aufbau principle) in the same way as atomic orbitals.")
10
Sigma and pi bonds: Types of Molecular Orbitals
Spectroscopy of Organic Compounds. Prepared by Dr. Khalid A. Shadid Sigma and pi bonds: Types of Molecular Orbitals There are three important types of molecular orbitals sigma (s) pi (p) n Each of these types of orbitals will be discussed further...
 pi (p) n. Each of these types of orbitals will be discussed further...")
11
Sigma and Pi Bonds Sigma Bonds symmetric to rotation about
internuclear axis s 1s-2p END-TO-END OVERLAP s 2p-2p Pi Bonds not symmetric SIDE-TO-SIDE OVERLAP p 2p-2p

12
Pi (p) Bonds Non-Bonded Pairs : n
In a multiple bond, the first bond is a sigma (s) bond and the second and third bonds are pi (p) bonds. p p p s s Pi bonds are formed differently than sigma bonds. .. n : Non-Bonded Pairs : n s p
 bond. and the second and third bonds are pi (p) bonds. p. p. p. s. s. Pi bonds are formed differently than sigma bonds. .. n. : Non-Bonded Pairs : n. s. p.")
13
Visualizing MOs The hydrogen molecule
Antibonding MO = region of diminished electron density Bonding MO = enhanced region of electron density

14
The two px orbitals combine to form sigma bonding and antibonding MOs.
MOs for the 2p Electrons The two px orbitals combine to form sigma bonding and antibonding MOs. The two py orbitals and the two pz orbitals give pi bonding and antibonding MOs.

15
Molecular Orbital Diagram
Antibonding MOs = higher energy s* and p* MOs Bonding MOs s AOs = s MOs p AOs = p MOs

16
MO diagram for He2+ and He2
Energy s*1s s1s s*1s AO of He 1s AO of He+ 1s AO of He 1s AO of He 1s Energy s1s MO of He+ MO of He2 He2 bond order = 0 He2+ bond order = 1/2 He2 does not exist!

17
The Electromagnetic Spectrum
According to quantum mechanics, electromagnetic radiation has a dual and seemingly contradictory nature. Electromagnetic radiation can be described as a wave occurring simultaneously in electrical and magnetic fields. It can also be described as if it consisted of particles called quanta or photons.

18
The Electromagnetic Spectrum
A wave is usually described in terms of its wavelength (λ) or its frequency (ν). A simple wave is shown in Figure The distance between consecutive crests (or troughs) is the wavelength. The number of full cycles of the wave that pass a given point each second, as the wave moves through space, is called the frequency and is measured in cycles per second (cps), or hertz (Hz).
 or its frequency (ν). A simple wave is shown in Figure The distance between consecutive crests (or troughs) is the wavelength. The number of full cycles of the wave that pass a given point each second, as the wave moves through space, is called the frequency and is measured in cycles per second (cps), or hertz (Hz).")
19
Spectroscopy of Organic Compounds. Prepared by Dr. Khalid A. Shadid
Photon a particle of light. Electromagnetic radiation ALL light. Visible AND invisible visible light , x-rays, gamma rays, radio waves, microwaves, ultraviolet rays, infrared.

20
The Electromagnetic Spectrum
All electromagnetic radiation travels through a vacuum at the same velocity. This velocity (ϲ), called the velocity of light, is x 108 s-1 and relates to wavelength and frequency as c = λν The energy of a quantum of electromagnetic energy is directly related to its frequency: E= hν Where h = Planck’s constant, 6.63 x J s, ν = frequency (Hz) The higher the frequency (ν) of radiation, the greater is its energy. Since ν =c/λ , the energy of electromagnetic radiation is inversely proportional to its wavelength: E= hc/ λ where c = velocity of light The shorter the wavelength (λ) of radiation, the greater is its energy.
, called the velocity of light, is x 108 s-1. and relates to wavelength and frequency as. c = λν. The energy of a quantum of electromagnetic energy is directly related to its frequency: E= hν. Where h = Planck’s constant, 6.63 x J s, ν = frequency (Hz) The higher the frequency (ν) of radiation, the greater is its energy. Since ν =c/λ , the energy of electromagnetic radiation is inversely proportional to its wavelength: E= hc/ λ. where c = velocity of light. The shorter the wavelength (λ) of radiation, the greater is its energy.")
21
The Electromagnetic Spectrum

22
The Electromagnetic Spectrum

23
Types of Spectroscopy Different regions of the electromagnetic spectrum are used to probe different aspects of molecular structure

24
Electromagnetic Spectrum
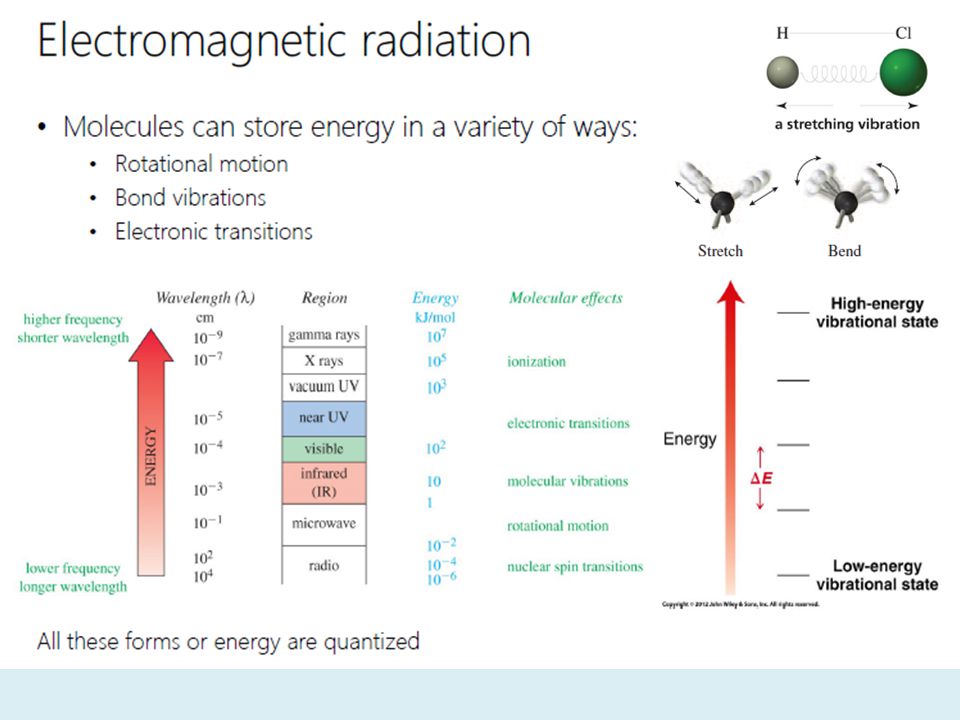
When UV-visible spectra interacts with substance, absorption of light by substance causes the energy content of the molecules (or atoms) to increase. The total potential energy of a molecule generally is represented as the sum of its electronic, vibrational, and rotational energies: Etotal = Eelectronic + Evibrational + Erotational The amount of energy a molecule possesses in each form is not a continuum but a series of discrete levels or states. The differences in energy among the different states are in the order: Eelectronic > Evibrational > Erotational
 to increase. The total potential energy of a molecule generally is represented as the sum of its electronic, vibrational, and rotational energies: Etotal = Eelectronic + Evibrational + Erotational. The amount of energy a molecule possesses in each form is not a continuum but a series of discrete levels or states. The differences in energy among the different states are in the order: Eelectronic > Evibrational > Erotational.")
26
Electromagnetic spectrum

27
UV-VIS spectrophotometer

28
Spectroscopy of Organic Compounds. Prepared by Dr. Khalid A. Shadid
UV–Vis Spectrophotometers Spectroscopy of Organic Compounds. Prepared by Dr. Khalid A. Shadid log(I0/I) = A I0 I0 I0 200 l, nm 700 I0 I A UV–Vis spectrophotometer measures the amount of light absorbed by a sample at each wavelength of the UV and visible regions of the electromagnetic spectrum.
 = A. I0. I0. I l, nm I0. I. A UV–Vis spectrophotometer measures the amount of light absorbed by a sample at each wavelength of the UV and visible regions of the electromagnetic spectrum.")
29
UV-Vis Spectroscopy Instrumentation and Spectra
Two sources are required to scan the entire UV-VIS band: Deuterium lamp – covers the UV – Tungsten lamp – covers As with the dispersive IR, the lamps illuminate the entire band of UV or visible light; the monochromator (grating or prism) gradually changes the small bands of radiation sent to the beam splitter The beam splitter sends a separate band to a cell containing the sample solution and a reference solution The detector measures the difference between the transmitted light through the sample (I) vs. the incident light (I0) and sends this information to the recorder UV-Vis Spectroscopy Instrumentation and Spectra
 gradually changes the small bands of radiation sent to the beam splitter. The beam splitter sends a separate band to a cell containing the sample solution and a reference solution. The detector measures the difference between the transmitted light through the sample (I) vs. the incident light (I0) and sends this information to the recorder. UV-Vis Spectroscopy Instrumentation and Spectra.")
30
UV-Vis Spectroscopy Instrumentation and Spectra
Instrumentation – Sample Handling Solvents must be transparent in the region to be observed; the wavelength where a solvent is no longer transparent is referred to as the cutoff Since spectra are only obtained up to 200 nm, solvents typically only need to lack conjugated p systems or carbonyls Common solvents and cutoffs: acetonitrile 190 chloroform 240 cyclohexane 195 1,4-dioxane 215 95% ethanol 205 n-hexane 201 methanol 205 isooctane 195 water 190

31
UV-Vis Spectroscopy Instrumentation and Spectra
Additionally solvents must preserve the fine structure (where it is actually observed in UV!) where possible H-bonding further complicates the effect of vibrational and rotational energy levels on electronic transitions, dipole-dipole interacts less so The more non-polar the solvent, the better (this is not always possible)
 where possible. H-bonding further complicates the effect of vibrational and rotational energy levels on electronic transitions, dipole-dipole interacts less so. The more non-polar the solvent, the better (this is not always possible)")
32
UV-Vis Spectroscopy Instrumentation and Spectra
The Spectrum The x-axis of the spectrum is in wavelength; nm for UV, for UV-VIS determinations Due to the lack of any fine structure, spectra are rarely shown in their raw form, rather, the peak maxima are simply reported as a numerical list of “lamda max” values or lmax lmax = 206 nm 252 317 376

33
UV-Vis Spectroscopy Instrumentation and Spectra
The Spectrum The y-axis of the spectrum is in absorbance, A From the spectrometers point of view, absorbance is the inverse of transmittance: A = log10 (I0/I) From an experimental point of view, three other considerations must be made: a longer path length, l through the sample will cause more UV light to be absorbed – linear effect the greater the concentration, c of the sample, the more UV light will be absorbed – linear effect some electronic transitions are more effective at the absorption of photon than others – molar absorptivity, e this may vary by orders of magnitude
 From an experimental point of view, three other considerations must be made: a longer path length, l through the sample will cause more UV light to be absorbed – linear effect. the greater the concentration, c of the sample, the more UV light will be absorbed – linear effect. some electronic transitions are more effective at the absorption of photon than others – molar absorptivity, e. this may vary by orders of magnitude.")
34
- crystalline sodium chloride crystalline sodium chloride
UV-Vis Spectroscopy – Sample Holder Sample containers, usually called cells or cuvettes must have windows that are transparent in the spectral region of interest. There are few types of cuvettes: - quartz or fused silica - silicate glass - crystalline sodium chloride quartz or fused silica - required for UV and may be used in visible region silicate glass - cheaper compared to quartz. Used in UV crystalline sodium chloride - used in IR cuvette cuvette 34

35
Types of source, sample holder and detector for various EM region
Ultraviolet Deuterium lamp Quartz/fused silica Phototube, PM tube, diode array Visible Tungsten lamp Glass/quartz Infrared Nernst glower (rare earth oxides or silicon carbide glowers) Salt crystals e.g. crystalline sodium chloride Thermocouples, bolometers
 Salt crystals e.g. crystalline sodium chloride. Thermocouples, bolometers.")
36
© 2014 by John Wiley & Sons, Inc. All rights reserved.
Beer’s law A = absorbance e = molar absorptivity c = concentration ℓ = path length A = e x c x ℓ A c x ℓ or e = Example: UV absorption spectrum of 2,5-dimethyl-2,4-hexadiene in methanol at a concentration of 5.95 x 10⁻⁵ M in a 1.0 cm e.g. 2,5-Dimethyl-2,4-hexadiene lmax(methanol) nm (e = 13,100) © 2014 by John Wiley & Sons, Inc. All rights reserved.
 nm. (e = 13,100) © 2014 by John Wiley & Sons, Inc. All rights reserved.")
37
Transmittance I0 I b

38
Path length / cm 0.2 0.4 0.6 0.8 1.0 %T 100 50 25 12.5 6.25 3.125 Absorbance 0.3 0.9 1.2 1.5

39
External Standard and the Calibration Curve

40
QUANTIZED MO ENERGEY LEVELS FOUND IN ORGANIC MOLECULES

41
Vacuum UV or Far UV (λ<190 nm ) UV/VIS
 UV/VIS")
43
s* p* Energy n p s UV Spectroscopy Introduction
Observed electronic transitions From the molecular orbital diagram, there are several possible electronic transitions that can occur, each of a different relative energy: s* s p n s* p* alkanes carbonyls unsaturated cmpds. O, N, S, halogens p* Energy n p s

44
Observed electronic transitions
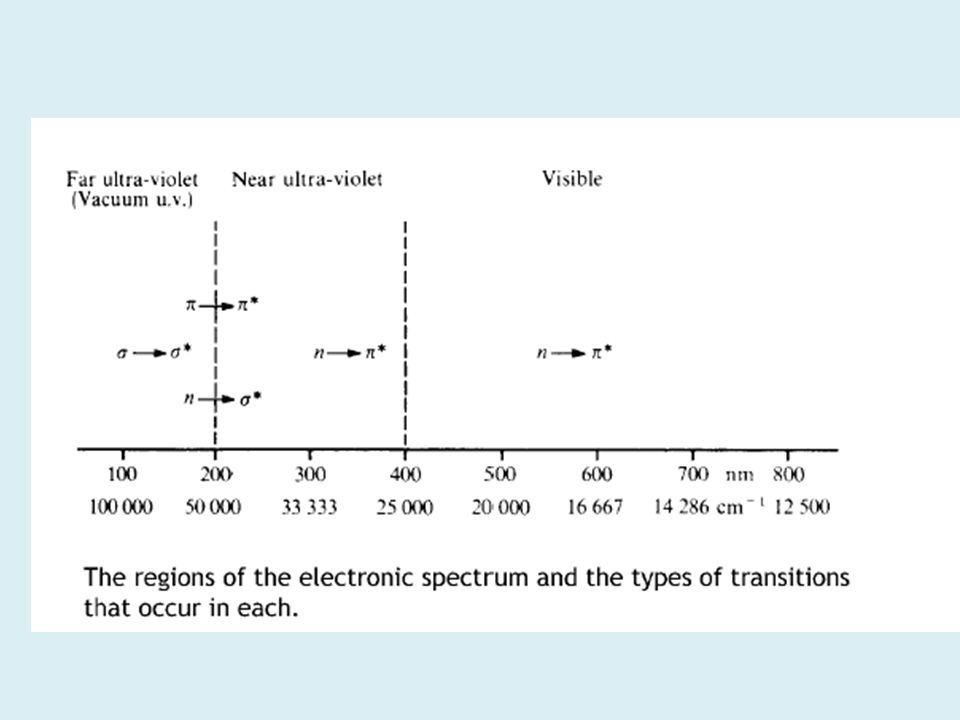
Although the UV spectrum extends below 100 nm (high energy), oxygen in the atmosphere is not transparent below 200 nm Special equipment to study vacuum or far UV is required Routine organic UV spectra are typically collected from nm This limits the transitions that can be observed: Observed electronic transitions s p n s* p* alkanes carbonyls unsaturated cmpds. O, N, S, halogens 150 nm 170 nm 180 nm √ - if conjugated! 190 nm 300 nm √
, oxygen in the atmosphere is not transparent below 200 nm. Special equipment to study vacuum or far UV is required. Routine organic UV spectra are typically collected from nm. This limits the transitions that can be observed: Observed electronic transitions. s. p. n. s* p* alkanes. carbonyls. unsaturated cmpds. O, N, S, halogens. 150 nm. 170 nm. 180 nm √ - if conjugated! 190 nm. 300 nm √")
45
s ® s* Transitions An electron in a bonding s orbital is excited to the corresponding antibonding orbital. The energy required is large. For example, methane (which has only C-H bonds, and can only undergo s ® s* transitions) shows an absorbance maximum at 125 nm. Absorption maxima due to s ® s* transitions are not seen in typical UV-VIS spectra ( nm)
 shows an absorbance maximum at 125 nm. Absorption maxima due to s ® s* transitions are not seen in typical UV-VIS spectra ( nm)")
46
n ® s* Transitions Saturated compounds containing atoms with lone pairs (non-bonding electrons) are capable of n ® s* transitions. These transitions usually need less energy than s ® s * transitions. They can be initiated by light whose wavelength is in the range nm. The number of organic functional groups with n ® s* peaks in the UV region is small.
 are capable of n ® s* transitions. These transitions usually need less energy than s ® s * transitions. They can be initiated by light whose wavelength is in the range nm. The number of organic functional groups with n ® s* peaks in the UV region is small.")
47
n ® p* and p ® p* Transitions
Most absorption spectroscopy of organic compounds is based on transitions of n or p electrons to the p* excited state. These transitions fall in an experimentally convenient region of the spectrum ( nm). These transitions need an unsaturated group in the molecule to provide the p electrons.
. These transitions need an unsaturated group in the molecule to provide the p electrons.")
48
p→p* n→p* p→p* n→s* n→s* Chromophore Excitation lmax, nm Solvent C=C
171 hexane C=O n→p* p→p* hexane hexane N=O ethanol ethanol C-X X=Br, I n→s* n→s*

50
Ultraviolet Spectrum of 1,3-Butadiene
Example: 1,4-butadiene has four molecular orbitals with the lowest two occupied Electronic transition is from HOMO to LUMO at 217 nm (peak is broad because of combination with stretching, bending)
")
51
Electron transition in organic compounds

52
Electronic transition in Formaldehyde

53
As the chromophore becomes more conjugated, the absorption max
moves to longer wavelengths. Delocalized pi MO’s must be used to describe conjugated systems. The energy of the HOMO (pi) increases and the energy of the LUMO (pi*) decreases as the number of conjugated pi bonds increases. This results in an absorption at lower energy (longer wavelength). These are all π → π* transitions. Note they have large extinction coefficients.
 increases and the energy of the LUMO (pi*) decreases as the number of conjugated pi bonds increases. This results in an absorption at lower energy (longer wavelength). These are all π → π* transitions. Note they have large extinction coefficients.")
54
Terms describing UV absorptions
1. Chromophores: functional groups that give electronic transitions. 2. Auxochromes: substituents with unshared pair e's like OH, NH, SH ..., when attached to π chromophore they generally move the absorption max. to longer λ. 3. Bathochromic shift: shift to longer λ, also called red shift. 4. Hysochromic shift: shift to shorter λ, also called blue shift. 5. Hyperchromism: increase in ε of a band. 6. Hypochromism: decrease in ε of a band.

55
Chromophores s* s Organic Chromophores
Alkanes – only posses s-bonds and no lone pairs of electrons, so only the high energy s s* transition is observed in the far UV This transition is destructive to the molecule, causing cleavage of the s-bond Chromophores s* s

56
Chromophores s*CN nN sp3 sCN Organic Chromophores
Alcohols, ethers, amines and sulfur compounds – in the cases of simple, aliphatic examples of these compounds the n s* is the most often observed transition; like the alkane s s* it is most often at shorter l than 200 nm Note how this transition occurs from the HOMO to the LUMO Chromophores s*CN nN sp3 sCN

57
Chromophores p* p Organic Chromophores
Alkenes and Alkynes – in the case of isolated examples of these compounds the p p* is observed at 175 and 170 nm, respectively Even though this transition is of lower energy than s s*, it is still in the far UV – however, the transition energy is sensitive to substitution p* p

58
Chromophores Organic Chromophores
Carbonyls – unsaturated systems incorporating N or O can undergo n p* transitions (~285 nm) in addition to p p* Despite the fact this transition is forbidden by the selection rules (e = 15), it is the most often observed and studied transition for carbonyls This transition is also sensitive to substituents on the carbonyl Similar to alkenes and alkynes, non-substituted carbonyls undergo the p p* transition in the vacuum UV (188 nm, e = 900); sensitive to substitution effects
 in addition to p p* Despite the fact this transition is forbidden by the selection rules (e = 15), it is the most often observed and studied transition for carbonyls. This transition is also sensitive to substituents on the carbonyl. Similar to alkenes and alkynes, non-substituted carbonyls undergo the p p* transition in the vacuum UV (188 nm, e = 900); sensitive to substitution effects.")
59
Chromophores p* n p Organic Chromophores
Carbonyls – n p* transitions (~285 nm); p p* (188 nm) Chromophores p* It has been determined from spectral studies, that carbonyl oxygen more approximates sp rather than sp2 ! n p sCO transitions omitted for clarity
; p p* (188 nm) Chromophores. p* It has been determined from spectral studies, that carbonyl oxygen more approximates sp rather than sp2 ! n. p. sCO transitions omitted for clarity.")
60
Chromophores Substituent Effects
General – from our brief study of these general chromophores, only the weak n p* transition occurs in the routinely observed UV The attachment of substituent groups (other than H) can shift the energy of the transition Substituents that increase the intensity and often wavelength of an absorption are called auxochromes Common auxochromes include alkyl, hydroxyl, alkoxy and amino groups and the halogens
 can shift the energy of the transition. Substituents that increase the intensity and often wavelength of an absorption are called auxochromes. Common auxochromes include alkyl, hydroxyl, alkoxy and amino groups and the halogens.")
61
Chromophores Substituent Effects
General – Substituents may have any of four effects on a chromophore Bathochromic shift (red shift) – a shift to longer l; lower energy Hypsochromic shift (blue shift) – shift to shorter l; higher energy Hyperchromic effect – an increase in intensity Hypochromic effect – a decrease in intensity Chromophores Hyperchromic e Hypsochromic Bathochromic Hypochromic 200 nm 700 nm
 – a shift to longer l; lower energy. Hypsochromic shift (blue shift) – shift to shorter l; higher energy. Hyperchromic effect – an increase in intensity. Hypochromic effect – a decrease in intensity. Chromophores. Hyperchromic. e. Hypsochromic. Bathochromic. Hypochromic. 200 nm. 700 nm.")
62
Chromophores Substituent Effects
Conjugation – most efficient means of bringing about a bathochromic and hyperchromic shift of an unsaturated chromophore: Chromophores lmax nm e 175 15,000 217 21,000 258 35,000 ,000 n p* p p* n p* p p* ,100

63
Chromophores Y2* f1 f2 Y1 p Substituent Effects Conjugation – Alkenes
The observed shifts from conjugation imply that an increase in conjugation decreases the energy required for electronic excitation From molecular orbital (MO) theory two atomic p orbitals, f1 and f2 from two sp2 hybrid carbons combine to form two MOs Y1 and Y2* in ethylene Chromophores Y2* f1 f2 Y1 p
 theory two atomic p orbitals, f1 and f2 from two sp2 hybrid carbons combine to form two MOs Y1 and Y2* in ethylene. Chromophores. Y2* f1. f2. Y1. p.")
64
Chromophores Y4* Y2* Y3* Y2 Y1 p Y1 Substituent Effects
Conjugation – Alkenes When we consider butadiene, we are now mixing 4 p orbitals giving 4 MOs of an energetically symmetrical distribution compared to ethylene Y4* Y2* Y3* Y2 Y1 p Y1 DE for the HOMO LUMO transition is reduced

65
Chromophores Substituent Effects Conjugation – Alkenes
Extending this effect out to longer conjugated systems the energy gap becomes progressively smaller: Energy Lower energy = Longer wavelenghts ethylene butadiene hexatriene octatetraene

66
Chromophores Y3* p* Y2 p nA Y1 Substituent Effects
Conjugation – Alkenes Similarly, the lone pairs of electrons on N, O, S, X can extend conjugated systems – auxochromes Here we create 3 MOs – this interaction is not as strong as that of a conjugated p-system Chromophores Y3* p* Y2 Energy p nA Y1

67
Chromophores Substituent Effects Conjugation – Alkenes
Methyl groups also cause a bathochromic shift, even though they are devoid of p- or n-electrons This effect is thought to be through what is termed “hyperconjugation” or sigma bond resonance

68
p p*

69
© 2014 by John Wiley & Sons, Inc. All rights reserved.

70
UV-Visible Spectroscopy
Table 20.3 Wavelengths and energies required for p to p* transitions of ethylene and three conjugated polyenes

71
UV-Visible Spectroscopy
The visible spectrum of b-carotene (the orange pigment in carrots) dissolved in hexane shows intense absorption maxima at 463 nm and 494 nm, both in the blue-green region.
 dissolved in hexane shows intense absorption maxima at 463 nm and 494 nm, both in the blue-green region.")
Similar presentations


>")