Download presentation
Presentation is loading. Please wait.

1
Signal Generator Lab Enrico Santi

2
© 2000 Prentice Hall Inc. Figure 1.6 Typical flowchart for design of electronic systems. Electronics Design

3
© 2000 Prentice Hall Inc. Figure 1.7 Flowchart of the circuit-design process. Block Design – Divide & Conquer

4
© 2000 Prentice Hall Inc. Figure 1.1 Block diagram of a simple electronic system: an AM radio. Block Diagram of an AM Radio

5
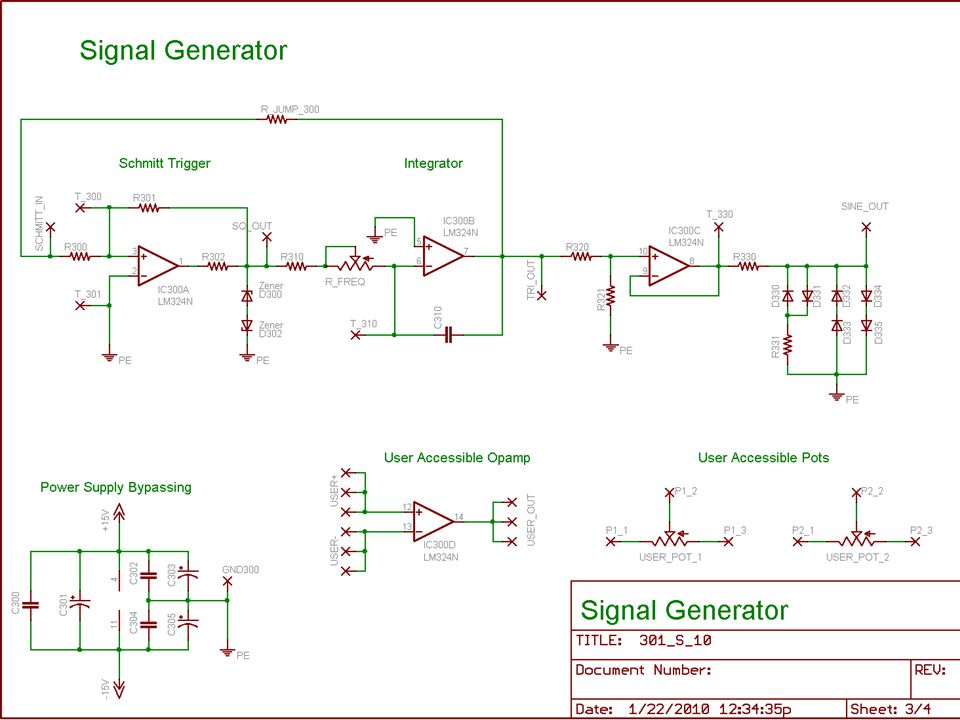
The Design Process Design is a creative process – many ways possible A design starts from an idea For a signal generator: – Generate square wave – Generate triangular wave by integrating square wave – Transform triangular wave into sine wave using a nonlinear wave-shaping circuit

Similar presentations