Download presentation
Presentation is loading. Please wait.

1
Optimize Quality for Business Outcomes Charlie Li, Andreas Golze, Shel Prince

2
First Published Book from Mercury!

3
Understanding Defects
The majority of defects are introduced during the requirements and design phase However, the majority of defects are actually detected during user acceptance testing and in production Introduction of Defects Detection of Defects Unmanaged risks results in defects. A majority of defects are introduced during the requirements and design phase. This is due to unclear or ambiguous requirements and design specifications that often result in problematic implementations. Most of the defects are actually detected during the user acceptance testing phase. By addressing defects earlier during the requirement and design stages, many of the defects can be addressed earlier rather than later. Source: NIST 2002 RTI Project

4
Defect Correction Costs 1000x in Production!
Addressing defects earlier during the requirements and design phase ensures lower total cost of correcting defects. As defects are detected in later phases such as testing and maintenance the cost for remediation is exponentially higher. This industry average is used as a baseline for arriving at cost savings Industry References: 3 B. Boehm and V. Basili, "Software Defect Reduction Top 10 List," IEEE Computer, IEEE Computer Society, Vol. 34, No. 1, January 2001, pp

5
A Risk-Mitigated Quality Approach
Align testing with business requirements Mitigate implementation risk with effective quality process Project Prep Blueprint Design Build Test Go-Live Support Assess Risk Test Test Manage Quality Process Risk Mitigated Approach Traditional Cost Quality Effort and Cost Time Solve the problems of time and risk by shifting quality management earlier in the lifecycle by prioritizing quality tasks based on risk assessment. Establish an effective and efficient quality process and Test according to business requirements. Optimize test automation in order to reduce the QA lifecycle.

6
The Missing link Who’s testing for the business outcomes?
How do you structure requirements? Requirements -> behavioral model -> Test Cases What to test? How to Test? How much to test? What test strategies to use and how can automation be leveraged? What do you measure, assess, and continuously improve?

7
Behavioral Modeling

8
What is it? A graphical representation… ...of the functional behavior…
…of the software article.

9
What does it buy us? Allows the behavior to be specified at any level of detail. Allows different people to work on different sections at the same time. Limited “vocabulary” enforces a high level of consistency in the models. Allows understanding (and review) by people with a wide variety of experience.
 by people with a wide variety of experience.")
10
Vocabulary Beginning or End Process Decision Case Result
Displayed Result Manual Action Representative Sample Straight Line Connector Note Curved Line Connector

11
How do we do it? There are only two questions -- What does it do?
“Do” in the active sense What influences it?

12
Sample Problem 1 Externals only Example – Bigger: Two numbers in
One number out +1 if 1st number bigger than 2nd -1 if 1st number smaller than 2nd 0 if the numbers are equal

15
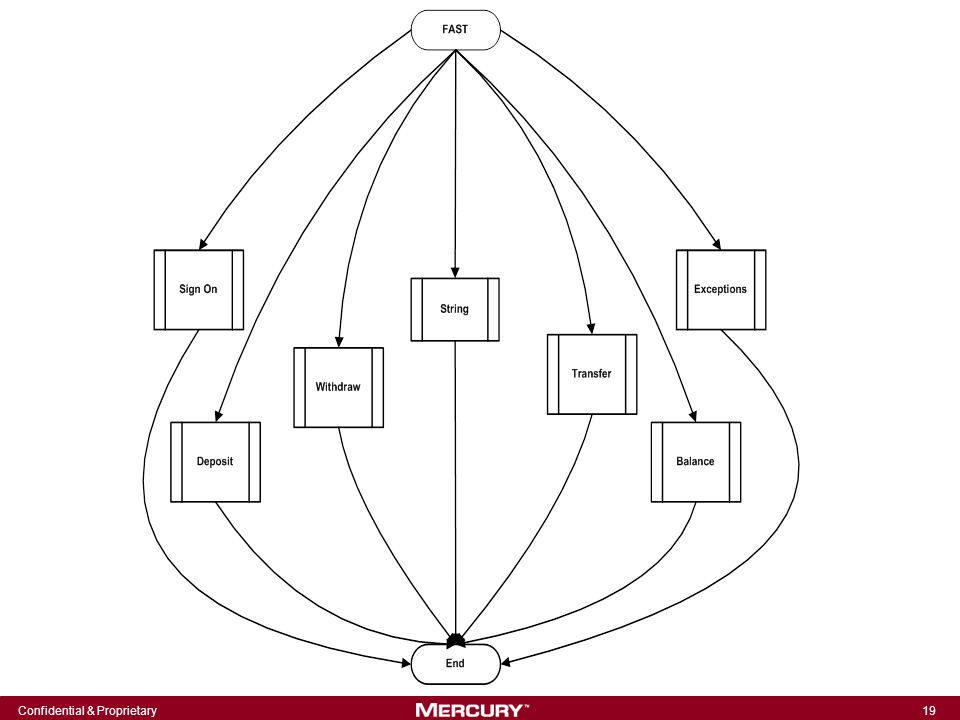
Sample Problem 2 FAST The Functionally Advanced Sidewalk Teller
Deposit Withdraw Transfer Check Balance

24
Attributes of Good Test Suites
Effective Efficient

28
Test Case Design Sample

29
Business Impact Testing

30
The Specification

31
The User Acceptance Test

32
Improvements

33
The Retest

34
Tracking Risk Ratio Baseline the risk ratio and set the risk value to 1; current risk/initial risk Adding new requirements post-analysis increases the risk ratio; enables risk-based discussions Risk analysis acts as a verification of the requirements Risk hopefully reduces over the lifecycle Analyze Build Design Test Deploy Test Activities R I S K A T O 1 Risk Ratio Analysis An effective way to normalizing and tracking risk, at both a requirement and application level, is to get the ratio of current risk to baseline risk. The ratio may be calculated as follows: For a single requirements: ratio = (current / baseline). For entire application: ratio = average of (current / baseline) across all in-scope requirements. The ratio always starts at 1 (where current = baseline risk), and hopefully diminishes as the requirements are designed, built, and tested. The goal is to reduce the risk ratio to zero or acceptable levels. Adding new requirements post-analyze will always increases the risk ratio. This enables the business, development, and QA teams to engage in risk-based discussions and decision making. It formalizes ad-hoc processes to determine options to adjust test plans if schedule or resource constraints occur.
![]()
35
Test Requirements Structure
Organization of Test Requirements Applications support business activities/processes and functions Structure is uniform and enforced, and naming convention is informative Example 1 Example 2 35

36
Business Impact Driven Test Strategy
Analysing Probability Assess the business impact of each activity Assess the Probability for failure Determine the Risk based on Impact and probability Determining the Risk 36

37
The Risk determines the Test Strategy
Procedure for High Risk A Procedure Systematic testing using business component testing strategy, and root-cause analysis Approach Automated: 30% Manual: 70% Systematic testing with or without business component testing strategy, and root-cause analysis Procedure for Medium Risk B Procedure Approach Automated: 20% Manual: 80% Procedure for Low Risk C Procedure Systematic or Ad-hoc testing Approach Automated: 5% Manual: 95% 37

38
Functional Complexity determines Test effort
Structuring Test Requirements 38

39
Prioritizing Automation Effort
Prioritization Strategy Automation ROI Matrix Assuming test cases for all risks and complexities are in-scope for each test cycle. Testing Scope Defined by risk-levels to be tested (ie. Higher risk items tested first) Prioritization Order for Automation: Test cases with lowest # of test cycles for ROI Test cases with highest risk levels first Test cases with lowest complexity first # of Test Cycles for Beginning of Return on Automation Complexity Risk High Medium Low 5.0 5.9 5.5 6.6 7.3 8.1 1 4 3 5 6 8 2 7 9 In order to maximize ROI from automation, it is best to invest in test cases that will yield ROI quicker. The following guidelines for prioritization should be used, based on the scope of testing (ie. risk levels to be tested) 1st) test cases with the lowest # of test cycles for ROI should be automated first 2nd) test cases with highest risk levels – as higher risk items are more important to be covered first in any testing cycle 3rd) test cases with lowest complexity – as lower complexity items require much less maintenance than higher complexity items. In the ROI Matrix example, the ordering in which automation is performed assuming every test case is in scope is shown. # - Priority # / Order
 Prioritization Order for Automation: Test cases with lowest # of test cycles for ROI. Test cases with highest risk levels first. Test cases with lowest complexity first. # of Test Cycles for Beginning of Return on Automation. Complexity. Risk. High. Medium. Low In order to maximize ROI from automation, it is best to invest in test cases that will yield ROI quicker. The following guidelines for prioritization should be used, based on the scope of testing (ie. risk levels to be tested) 1st) test cases with the lowest # of test cycles for ROI should be automated first. 2nd) test cases with highest risk levels – as higher risk items are more important to be covered first in any testing cycle. 3rd) test cases with lowest complexity – as lower complexity items require much less maintenance than higher complexity items. In the ROI Matrix example, the ordering in which automation is performed assuming every test case is in scope is shown. # - Priority # / Order.")
40
Utilize the best testing strategies
Start Project Application Available Map Requirements Test Plans Define Use Cases Manual Testing Create Test Lab Run Tests Modify Tests Analyze Tests Run Tests Modify Tests Map Requirements Test Plans Define Use Cases Test Automation Automate Tests Run Tests Analyze Tests Modify Tests Run Tests Customize Pre-Defined Content Map Requirements Test Plans Define Use Cases Test Acceleration Run Tests Analyze Tests Modify Tests Run Tests Customize Pre-Defined Content Map Requirements Test Plans Define Use Cases Change Impact Testing Run Tests Analyze Tests Modify Tests Run Tests Test What Matters!!! Time Line

41
Wrapping up

42
10 SUCCESSFUL Steps to Measure

43
More Book information Books will be available for purchase by 12/15 from Mercury’s Education site Send Questions to

44
Questions?

Similar presentations


: What Users Need to Know. OGF 19: January 31, 2007 Charlotte, NC John Salasin, Ph.D, Visiting Researcher National.>")


 Application Lifecycle Management.>")
