Download presentation
Presentation is loading. Please wait.

1
How Much Do We Have Left? Coming to Terms With the Colorado River Water Availability Study Annual Colorado Water Workshop July 21, 2010 Ben Harding – AMEC Earth and Environmental Erin Wilson – Leonard Rice Engineers

2
Colorado Decision Support System - Overview Water Management System Developed by CWCB and Division of Water Resources Goal is to provide data/tools to assist in making informed decisions regarding historic and future use of water 19921993 1998 2001 future Legislative Authorization Initial CRDSS Development (Gunnison, Yampa, Colorado, San Juan, Dolores) RGDSS Development (Rio Grande) CRDSS (Enhancements and Extension) Maintenance & Updates, Arkansas? SPDSS Development (South Platte, North Platte)
.")
3
Colorado Decision Support System HydroBase Data Management Interfaces Consumptive Use Model “StateCU” Surface Water Model “StateMod” User/Operator/ Administrator Input Results for Decision Makers GIS Coverages

4
Consumptive Use Model StateCU Surface Water Model StateMod Results for Decision Makers Alternate Temperature Physical and Legal Water Availability Alternate CIR Alternate Hydrology Alternate Precipitation Estimating Water Availability

5
Findings - Temperature Map shows Average of the Five 2040 Projections All Five Projections show Temperature Increases Increases basin-wide by 3.3 to 3.7 deg F Lower elevations show largest increase Increase occurs each month of the year

6
Findings - Temperature

8
Findings - Winter Precipitation (Nov-Mar) Map shows Average of Five Projections Increases basin-wide by 6 to 13 percent Increases more in the northern part of the basin Increases more at higher elevations Shifts from snow to rain in the shoulder months
 Map shows Average of Five Projections Increases basin-wide by 6 to 13 percent Increases more in the northern part of the basin Increases more at higher elevations Shifts from snow to rain in the shoulder months")
9
Findings - Summer Precipitation (Apr-Oct) Decreases basin-wide by 4 to 10 percent Wet projections show more precipitation in some summer months than dry projections Decreases more in the southern part of the basin Decreases less at higher elevations
 Decreases basin-wide by 4 to 10 percent Wet projections show more precipitation in some summer months than dry projections Decreases more in the southern part of the basin Decreases less at higher elevations")
10
Findings - Precipitation

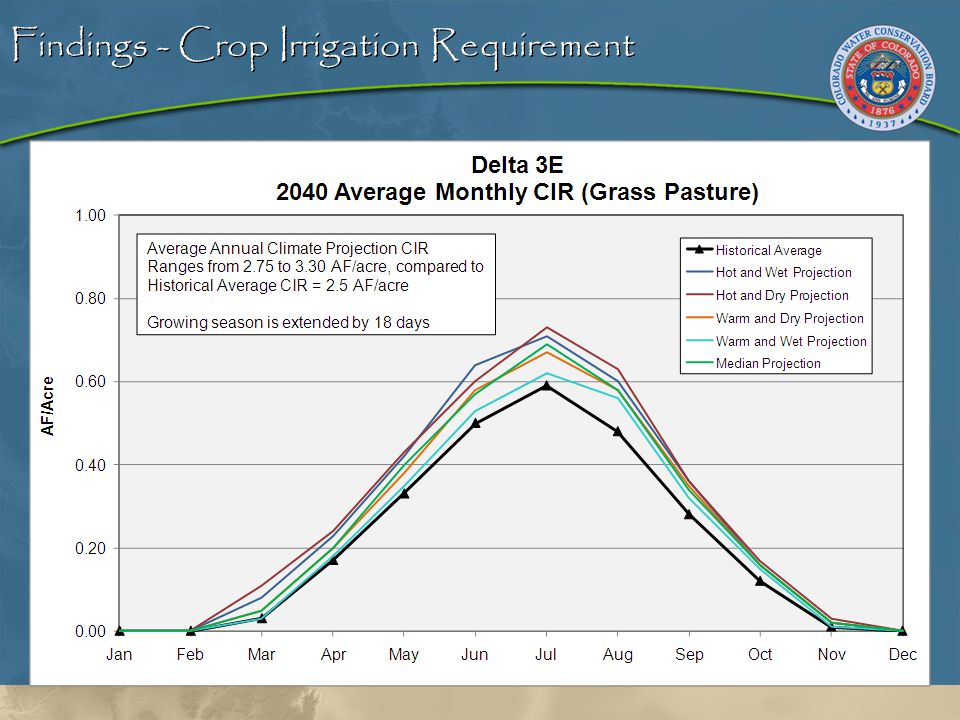
12
Findings - Crop Irrigation Requirement Map shows Average of Five Projections Increases basin-wide 2.6 to 6.7 in/yr for pasture grass Basin-wide CIR is 20% greater than historical Growing season increases basin-wide by 15 to 22 days Increases more at lower elevations

13
Findings - Crop Irrigation Requirement

15
StateMod Model Components

16
16 Inflow Hydrology – Natural Flows Historical Natural Flows Estimated by Removing the Effects of Man from Gaged Flows Diversions Reservoir Contents Return Flows Climate Projected Natural Flows

17
17 Physical Systems Diversion Structures –Location on the River –Headgate and Canal Capacities –Return Flow Locations Reservoirs –Location on River or Off-Channel –Location of Carrier Ditches –Storage Volume, Outlet Capacities, Account Size, Area/Capacity Tables Instream Flow Reaches –Beginning/Ending of Reach

18
18 Water Demands Irrigation Demands – Full Irrigation Water Requirements from StateCU (Historical, Based on Climate Projections) Municipal and Industrial Demands – Current Use Levels Trans-basin Demands – Current Diversions Reservoir “Demands” – Reservoir Capacities or Operational Targets
 Municipal and Industrial Demands – Current Use Levels Trans-basin Demands – Current Diversions Reservoir Demands – Reservoir Capacities or Operational Targets")
19
19 Water Demands CWCB Instream Flow Demands based on Water Rights Reservoir and Trans-basin Bypass Requirements based on Operational Agreements Endangered Species Flow Demands based on Flow Targets

20
20 Administrative Conditions Water Rights (Direct, Storage, Instream Flow) Reservoir and Carrier Operations Policies and Agreements (Such as Minimum Bypasses, Fish Flows, etc) Potential Colorado River Compact Obligations NOT Included in Phase I Conditional Rights without Current Demands NOT included in Phase I
 Reservoir and Carrier Operations Policies and Agreements (Such as Minimum Bypasses, Fish Flows, etc) Potential Colorado River Compact Obligations NOT Included in Phase I Conditional Rights without Current Demands NOT included in Phase I")
21
21 Model Operations 1.Based on Natural Inflow and Return Flows from Previous Time Steps 2.Identifies Most Senior Water Right 3.Estimates Diversion =min (Demand, Water Right, Headgate Capacity, Available Flow) 4.Adjusts Downstream Flows to Reflect Senior Diversions and Immediate Return Flows 5.Future Returns are Calculated 6.Repeated for Next Junior Water Right
 4.Adjusts Downstream Flows to Reflect Senior Diversions and Immediate Return Flows 5.Future Returns are Calculated 6.Repeated for Next Junior Water Right")
22
Sequence of Results: Uncompahgre River at Delta and Gunnison River Basin

23
Natural Flow

24
Modeled Streamflow

25
Water Availability

27
Modeled Consumptive Use

28
Modeled Reservoir Storage

30
Result Summary: West-Slope Basins

31
Water Availability

32
Modeled Consumptive Use

33
Modeled Reservoir Storage

35
Water Availability

37
Modeled Consumptive Use

38
Modeled Reservoir Storage

40
Water Availability

41
41PRELIMINARY RESULTS – UNDER REVIEWColorado River Water Availability Study – Phase I Water Availability

42
42PRELIMINARY RESULTS – UNDER REVIEWColorado River Water Availability Study – Phase I Modeled Consumptive Use

43
43PRELIMINARY RESULTS – UNDER REVIEWColorado River Water Availability Study – Phase I Modeled Reservoir Storage

44
44PRELIMINARY RESULTS – UNDER REVIEWColorado River Water Availability Study – Phase I Modeled Reservoir Storage

45
Result Summary – Natural Flow 45PRELIMINARY RESULTS – UNDER REVIEWColorado River Water Availability Study – Phase I Annual flow increases in some possible futures and decreases in others Annual flow generally increases in parts of the Yampa River basin and at higher elevation watersheds Annual flow generally decreases in southwestern watersheds and at lower elevations Shifts toward earlier peak runoff Flow decreases in late summer and early fall

46
Result Summary – Modeled Streamflow 46PRELIMINARY RESULTS – UNDER REVIEWColorado River Water Availability Study – Phase I Annual modeled streamflow decreases basin-wide, except in the Yampa River basin, and higher elevation locations in the Upper Colorado River basin Modeled Flow increases in April and May and decreases in later summer and fall months

47
Result Summary – Water Available to Meet Future Demands Result Summary – Water Available to Meet Future Demands 47PRELIMINARY RESULTS – UNDER REVIEWColorado River Water Availability Study – Phase I Higher elevations generally have less annual flow available to meet future demands, as a percent of modeled streamflow Available flow generally increases in April and May, corresponding to the shift in natural flow hydrographs

48
Result Summary – Modeled Consumptive Use 48PRELIMINARY RESULTS – UNDER REVIEWColorado River Water Availability Study – Phase I Increases in Yampa, White, Upper Colorado, and Gunnison basins by 4 to 18 % Decreases in the San Juan and Dolores basins by 8 %

49
Result Summary – Use of Reservoirs 49PRELIMINARY RESULTS – UNDER REVIEWColorado River Water Availability Study – Phase I Reservoirs show increased use Pool levels fluctuate more than historical Shifts in Runoff Increases the Value and Need for Storage

Similar presentations


 Moore PhD PGeo 1 Georg Jost PhD 1 Russell Smith PhD 2 1 Departments of Geography.>")


 River Basin Tapash Das, Dan Cayan, David Pierce, Mike Dettinger.>")


