Download presentation
Presentation is loading. Please wait.

1
Management of Inpatient Hyperglycemia: Review of Recent Trials and Guidelines
Bruce W. Bode, MD FACE Atlanta Diabetes Associates Associate Professor of Medicine Emory University School of Medicine

2
Financial Relationships
Grant/Research Support: Sanofi-Aventis, Lilly USA, Novo Nordisk Consultant: Sanofi-Aventis, Lilly USA, Novo Nordisk Speaker’s Bureau: Sanofi-Aventis, Lilly USA, Novo Nordisk Major Stock Shareholder : Glytec

3
Diabetes Today: An Epidemic
In 2008, ~26 million Americans (12% of the population) were diagnosed with diabetes1 In 2008, 40% of Americans >age 20 have either pre-DM or DM Complications of diabetes are a major cause of mortality and morbidity1 >224,000 deaths 82,000 lower-limb amputations 44,000 began treatment for end-stage kidney disease 12,000-24,000 new cases of blindness each year Total cost in the United States in 2002: $132 billion1 Diabetes Today: An Epidemic Review as stated. References ADA National Diabetes Fact Sheet. Available at: Accessed October 11, 2006. ADA. The dangerous toll of diabetes. Available at: Accessed October 11, 2006.
 were diagnosed with diabetes1. In 2008, 40% of Americans >age 20 have either pre-DM or DM. Complications of diabetes are a major cause of mortality and morbidity1. >224,000 deaths. 82,000 lower-limb amputations. 44,000 began treatment for end-stage kidney disease. 12,000-24,000 new cases of blindness each year. Total cost in the United States in 2002: $132 billion1. Diabetes Today: An Epidemic. Review as stated. References. ADA National Diabetes Fact Sheet. Available at: Accessed October 11, ADA. The dangerous toll of diabetes. Available at: Accessed October 11,")
4
Hyperglycemia Is Prevalent at Hospital Admission
38% of all patients at admission have hyperglycemia – Of those patients, nearly one-third have no history of diabetes Hyperglycemia Is Prevalent at Hospital Admission The medical records of 2030 consecutive adult patients admitted to a community hospital in Georgia over a 15-week period (July 1, 1998–October 20, 1998) were reviewed to determine the prevalence of in-hospital hyperglycemia and its impact on survival and functional outcome in patients with and without a history of diabetes. Because 144 patients did not have a blood glucose value, only 1886 patients were eligible for the study. Hyperglycemia was defined as an admission or in-hospital fasting blood glucose level of 126 mg/dL or more, or random blood glucose levels of 200 mg/dL or more on 2 or more occasions. Results on admission indicate that 1168 patients were normoglycemic (62%) and 718 were hyperglycemic (38%). Of those who were hyperglycemic, 223 (31%) did not have a previous history of diabetes. Single-center, retrospective chart review of 1886 patients hospitalized over 15 weeks in a community teaching hospital. Hyperglycemia defined as BG ≥126 mg/dL on admission or while fasting, or random BG ≥200 mg/dL on ≥2 occasions. Umpierrez GE et al. J Clin Endocrinol Metab. 2002;87: Reference Umpierrez GE, Isaacs SD, Bazargan N, You X, Thaler LM, Kitabchi AE. Hyperglycemia: an independent marker of in-hospital mortality in patients with undiagnosed diabetes. J Clin Endocrinol Metab. 2002;87:
 were reviewed to determine the prevalence of in-hospital hyperglycemia and its impact on survival and functional outcome in patients with and without a history of diabetes. Because 144 patients did not have a blood glucose value, only 1886 patients were eligible for the study. Hyperglycemia was defined as an admission or in-hospital fasting blood glucose level of 126 mg/dL or more, or random blood glucose levels of 200 mg/dL or more on 2 or more occasions. Results on admission indicate that 1168 patients were normoglycemic (62%) and 718 were hyperglycemic (38%). Of those who were hyperglycemic, 223 (31%) did not have a previous history of diabetes. Single-center, retrospective chart review of 1886 patients hospitalized over 15 weeks in a community teaching hospital. Hyperglycemia defined as BG ≥126 mg/dL on admission or while fasting, or random BG ≥200 mg/dL on ≥2 occasions. Umpierrez GE et al. J Clin Endocrinol Metab. 2002;87: Reference. Umpierrez GE, Isaacs SD, Bazargan N, You X, Thaler LM, Kitabchi AE. Hyperglycemia: an independent marker of in-hospital mortality in patients with undiagnosed diabetes. J Clin Endocrinol Metab. 2002;87:")
5
2007 Total Direct Cost = $116 billion
Hospitalizations Account for the Largest Portion of the Direct Costs of Diabetes Care 2007 Total Direct Cost = $116 billion 50% American Diabetes Association. Diabetes Care. 2008;31:

6
Hyperglycemia: Scope of the Problem
Diabetes No Diabetes 50 40 30 20 10 50 40 30 20 10 Patients, % 26% 78% Using a national database derived from electronic medical records at 39 medical centers, investigators analyzed patterns of blood glucose (BG) control and documented insulin therapy among 16,534 patients hospitalized with acute myocardial infarction from January 2000 to December 2005. Of the 4940 patients (30%) with recognized diabetes mellitus (DM), nearly half (2412 patients, 49%) had mean BG >200 mg/dL during the first 24 hours after hospital admission. When the entire hospitalization was considered, 34% of DM patients had mean BG >200 mg/dL, while 61% had mean BG between 110 and 200 mg/dL, and only 5% maintained mean BG <110 mg/dL. Among patients without recognized DM, 8% had mean BG >200 mg/dL during the first 24 hours. When the entire hospitalization was considered, 4% of patients without known DM had mean BG >200 mg/dL, while 65% had mean BG between 110 and 200 mg/dL, and 31% had mean BG <110 mg/dL. <110 >200 <110 >200 Mean BG, mg/dL Kosiborod M, et al. J Am Coll Cardiol. 2007;49(9): :283A-284A. Kosiborod M, Inzucchi S, Clark B, et al. National patterns of glucose control among patients hospitalized with acute myocardial infarction. J Am Coll Cardiol. 2007;49(9): :283A-284A.
 control and documented insulin therapy among 16,534 patients hospitalized with acute myocardial infarction from January 2000 to December Of the 4940 patients (30%) with recognized diabetes mellitus (DM), nearly half (2412 patients, 49%) had mean BG >200 mg/dL during the first 24 hours after hospital admission. When the entire hospitalization was considered, 34% of DM patients had mean BG >200 mg/dL, while 61% had mean BG between 110 and 200 mg/dL, and only 5% maintained mean BG <110 mg/dL. Among patients without recognized DM, 8% had mean BG >200 mg/dL during the first 24 hours. When the entire hospitalization was considered, 4% of patients without known DM had mean BG >200 mg/dL, while 65% had mean BG between 110 and 200 mg/dL, and 31% had mean BG <110 mg/dL. < >200. < >200. Mean BG, mg/dL. Kosiborod M, et al. J Am Coll Cardiol. 2007;49(9): :283A-284A. Kosiborod M, Inzucchi S, Clark B, et al. National patterns of glucose control among patients hospitalized with acute myocardial infarction. J Am Coll Cardiol. 2007;49(9): :283A-284A.")
7
Hyperglycemia and Mortality in the MICU
~4x ~3x 45 45 45 [Krinsley.MayoClin Proc.Dec.2003/ p1471/Abstract/c1/ line A4-A8; p1476/ Table 7] 40 40 40 ~2x 35 35 35 30 30 30 Mortality Rate (%) 25 25 25 20 20 20 15 15 15 10 10 10 5 5 5 80-99 >300 Mean Glucose Value (mg/dL) N=1826 ICU patients. Krinsley JS. Mayo Clin Proc. 2003;78:
 >300. Mean Glucose Value (mg/dL) N=1826 ICU patients. Krinsley JS. Mayo Clin Proc. 2003;78:")
8
Intensive Insulin Management in Medical-Surgical ICU
P < 0.001 P < 0.002 29.3% Reduction Non-RCT… Intensive Insulin Management in Medical-Surgical ICU Continuous IV insulin was used if glucose values exceeded 200 mg/dL on 2 successive occasions. This protocol resulted in significantly improved glycemic control and was associated with decreased mortality and with no significant increase in nursing requirements. Mean BG Levels (mg/dL) Hospital Mortality (%) Baseline group (n = 800) Glucose management group (n = 800) Krinsley JS. Mayo Clin Proc. 79: , 2004.
 Hospital Mortality (%) Baseline group (n = 800) Glucose management group (n = 800) Krinsley JS. Mayo Clin Proc. 79: ,")
9
Hyperglycemia: A Predictor of Mortality Following CABG in Diabetics
10 [Furnary. Circulation.1999/ pI591/line 8-19] BG >200 P<0.0001 BG <200 8.6 n=1369 n=662 8 Postop 1.8% 5.0% * Mortality *P<0.001 5.8 6 Postop Mortality (%) Adjusted for 19 clinical and operation variables 3.8 4 Non-RCT – Impact of hyperglycemia following CABG First Postop Glucose >200 2x LOS 3x Vent duration 7x mortality !!! 2.1 1.7 2 1.4 <150 150- 175- 200- 225- >250 CABG, coronary artery bypass graft. 175 200 225 250 Furnary AP et al. Circulation. 1999:100 (Suppl I): I-591. Blood Glucose (mg/dL)
 Adjusted for 19 clinical and operation variables Non-RCT – Impact of hyperglycemia following CABG. First Postop Glucose >200. 2x LOS. 3x Vent duration. 7x mortality !!! < >250. CABG, coronary artery bypass graft Furnary AP et al. Circulation. 1999:100 (Suppl I): I-591. Blood Glucose (mg/dL)")
10
Intensive Insulin Therapy in Critically Ill Patients: The Leuven SICU Study
[VandenBerghe. NEJM.Nov.2001/ p1359/Abstract/line A6-A15,p1360/c1/ line 23-43, p1361/ Table 2] Randomized controlled trial: 1548 patients admitted to a surgical ICU, receiving mechanical ventilation. Patients were assigned to receive either: Conventional therapy: IV insulin only if BG >215 mg/dL Target BG levels: mg/dL Mean daily BG: 153 mg/dL Intensive therapy: IV insulin if BG >110 mg/dL Target BG levels : mg/dL Mean daily BG: 103 mg/dL First RCT- landmark paper that was the bases for previous guidelines. Van den Berghe et al. N Engl J Med. 2001;345:

11
Intensive Insulin Therapy in Critically Ill Patients: SICU
[VandenBerghe. NEJM.Nov.2001/ p1362/Table 3, p1365/Table 4] * * * * Remarkable results! * * *P<0.01 Relative Risk Reduction (%) Van den Berghe et al. N Engl J Med. 2001;345:
 Van den Berghe et al. N Engl J Med. 2001;345:")
12
28% mortality After 1 year 60% A Fib post op survival 2 yr
Benefits of Tight Glycemic Control: Observational Studies and Early Intervention Trials [Kitabchi. Metabolism.2008/ p116/c2/line 19-27, p117/c1/line 1-13] [Kitabchi/p117/c1/ line 13-28] [Kitabchi/p116/c1/ line 20-22, c2/ line 1-18] [Kitabchi/p117/c1/ line 29-34] [Kitabchi/p118/c1/ line 14-23] Study Setting Population Clinical Outcome Furnary, 1999 ICU DM undergoing open heart surgery 65% infection Furnary, 2003 DM undergoing CABG 57% mortality Krinsley, 2004 Medical/surgical ICU Mixed, no Cardiac 29% mortality Malmberg, 1995 CCU Mixed 28% mortality After 1 year Van den Berghe, 2001* Surgical ICU Mixed, with CABG 42% mortality Lazar, 2004 OR and ICU CABG and DM 60% A Fib post op survival 2 yr Summary of early trials – most of them non-RCT *RCT, randomized clinical trial. Kitabchi & Umpierrez. Metabolism. 2008;57:

13
Medical ICU Study Results
In-hospital mortality for patients who were in the ICU and on CII for >3 days was lower (52.5% to 43.0%) - RRR=18.1% P=.009 In-hospital morbidity was lower - Reduction in newly acquired kidney injury - Weaning from mechanical ventilation - Discharge from ICU; discharge from Hospital Hypoglycemia was an independent risk factor for mortality Van den Berghe et al. N Engl J Med. 2006;354:
 - RRR=18.1% P=.009. In-hospital morbidity was lower. - Reduction in newly acquired kidney injury. - Weaning from mechanical ventilation. - Discharge from ICU; discharge from Hospital. Hypoglycemia was an independent risk factor for mortality. Van den Berghe et al. N Engl J Med. 2006;354:")
14
Tight Glycemic Control Decreased Morbidity in Medical ICU Patients
Weaning From Mechanical Ventilation Discharge From ICU Discharge From Hospital 4.0 4.5 5 P=.03 4.0 P=.04 P=.05 3.5 3.5 4 3.0 Intensive treatment 3.0 2.5 3 2.5 2.0 Cumulative hazard 2.0 Conventional treatment 2 1.5 1.5 1.0 1.0 1 0.5 0.5 Tight Glycemic Control Decreased Morbidity in Medical ICU Patients Prospective, randomized, controlled study of adult patients admitted to the medical ICU, N=1200. On admission, patients were randomly assigned to intensive treatment (IV treatment to maintain blood glucose between mg/dL) or to conventional treatment (IV treatment given only when the blood glucose level >215 mg/dL and tapered when BG <180 mg/dL). The primary outcome of the study was all-cause mortality during hospitalization. A predefined subgroup analysis for patients staying in the ICU for ≥3 days was also performed. Intensive therapy significantly reduced morbidity but not in-hospital mortality. Reductions in morbidity were reflected by a reduction in newly acquired kidney injury, earlier weaning from the ventilator, earlier discharge from the ICU, and earlier discharge from the hospital. For all patients, total ICU and in-hospital mortality were not significantly different. In-hospital: 37.3% in the intensive treatment group died as compared with 40% in the conventional treatment group (P=.33). ICU: 24.2% in the intensive treatment group died compared with 26.8% in the conventional treatment group (P=.31). The predefined subanalysis demonstrated significantly decreased in-hospital mortality and appeared to decrease total ICU mortality among patients with an ICU stay ≥3 days. In-hospital: Among all patients in the hospital, 43% in the intensive treatment group died compared with 52.5% in the conventional treatment group (P=.009). ICU: 31.3% in the intensive treatment group died compared with 38.1% in the conventional treatment group (P=.05). 10 20 30 40 50 60 70 80 90 20 40 60 80 100 100 200 300 400 500 600 Days after admission to ICU Prospective, randomized, controlled study of adult patients admitted to the medical ICU, N= On admission, patients were randomly assigned to intensive treatment or to conventional treatment. Intensive insulin therapy significantly reduced morbidity but not in-hospital mortality. Van den Berghe G et al. N Engl J Med. 2006;354: Reference Van den Berghe G, Wilmer A, Hermans G, et al. Intensive insulin therapy in the medical ICU. N Engl J Med. 2006;354:
 or to conventional treatment (IV treatment given only when the blood glucose level >215 mg/dL and tapered when BG <180 mg/dL). The primary outcome of the study was all-cause mortality during hospitalization. A predefined subgroup analysis for patients staying in the ICU for ≥3 days was also performed. Intensive therapy significantly reduced morbidity but not in-hospital mortality. Reductions in morbidity were reflected by a reduction in newly acquired kidney injury, earlier weaning from the ventilator, earlier discharge from the ICU, and earlier discharge from the hospital. For all patients, total ICU and in-hospital mortality were not significantly different. In-hospital: 37.3% in the intensive treatment group died as compared with 40% in the conventional treatment group (P=.33). ICU: 24.2% in the intensive treatment group died compared with 26.8% in the conventional treatment group (P=.31). The predefined subanalysis demonstrated significantly decreased in-hospital mortality and appeared to decrease total ICU mortality among patients with an ICU stay ≥3 days. In-hospital: Among all patients in the hospital, 43% in the intensive treatment group died compared with 52.5% in the conventional treatment group (P=.009). ICU: 31.3% in the intensive treatment group died compared with 38.1% in the conventional treatment group (P=.05) Days after admission to ICU. Prospective, randomized, controlled study of adult patients admitted to the medical ICU, N=1200. On admission, patients were randomly assigned to intensive treatment or to conventional treatment. Intensive insulin therapy significantly reduced morbidity but not in-hospital mortality. Van den Berghe G et al. N Engl J Med. 2006;354: Reference. Van den Berghe G, Wilmer A, Hermans G, et al. Intensive insulin therapy in the medical ICU. N Engl J Med. 2006;354:")
15
Intensive Glucose Management in RCT
Trial N Setting Primary Outcome ARR RRR Odds Ratio (95% CI) P-value Van den Berghe 2006 1200 MICU Hospital mortality 2.7% 7.0% 0.94* ( ) N.S. HI 240 CCU AMI 6-mo mortality -1.8%* -30%* NR Glucontrol 2007 1101 ICU ICU mortality -1.5% -10% 1.10* ( ) Ghandi 2007 399 OR Composite 2% 4.3% 1.0* ( ) VISEP 2008 537 28-d mortality 1.3% 5.0% 0.89* ( ) De La Rosa 2008 504 SICU -4.2% * -13%* NICE-SUGAR 2009 6104 3-mo mortality -2.6% -10.6 1.14 ( ) < 0.05 The slide shows results of trials of glucose management in critical care patients.1-10 Some early randomized trials suggested that intensive glucose lowering can improve outcomes.1,2 However, more recent studies in the critical care population were unable to replicate earlier studies, and identified severe hypoglycemia as a significant risk of intensive glucose control.3-10 In the study by Ghandi et al,7 intensive insulin therapy during cardiac surgery did not reduce perioperative death or morbidity. In the NICE-SUGAR study,10 critically ill patients treated in the intensive glucose control group ( mg/dL) were 14% more likely to die (27.5% vs 24.9%) than were those in the conventional glucose control group ( mg/dL). Severe hypoglycemia (blood glucose ≤40 mg/dL) occurred in 6.8% of the intensive-control group versus 0.5% of the conventional-control group (P<.001). *not significant
 P-value. Van den Berghe MICU. Hospital mortality. 2.7% 7.0% 0.94* ( ) N.S. HI CCU AMI. 6-mo mortality. -1.8%* -30%* NR. Glucontrol ICU. ICU mortality. -1.5% -10% 1.10* ( ) Ghandi OR. Composite. 2% 4.3% 1.0* ( ) VISEP d mortality. 1.3% 5.0% 0.89* ( ) De La Rosa SICU. -4.2% * -13%* NICE-SUGAR mo mortality. -2.6% ( ) < The slide shows results of trials of glucose management in critical care patients.1-10 Some early randomized trials suggested that intensive glucose lowering can improve outcomes.1,2 However, more recent studies in the critical care population were unable to replicate earlier studies, and identified severe hypoglycemia as a significant risk of intensive glucose control.3-10 In the study by Ghandi et al,7 intensive insulin therapy during cardiac surgery did not reduce perioperative death or morbidity. In the NICE-SUGAR study,10 critically ill patients treated in the intensive glucose control group ( mg/dL) were 14% more likely to die (27.5% vs 24.9%) than were those in the conventional glucose control group ( mg/dL). Severe hypoglycemia (blood glucose ≤40 mg/dL) occurred in 6.8% of the intensive-control group versus 0.5% of the conventional-control group (P<.001). *not significant.")
16
NICE-SUGAR NICE-SUGAR Investigators. N Engl J Med 2009;360:1283-97
Trial design: Patients admitted to the ICU were randomized to intensive glucose control ( mg/dl; n = 3,054) vs. conventional glucose control (<180 mg/dl; n = 3,050). Insulin was given intravenously and nutrition was given enterally. Mean BG 115 mg vs 144 mg/dL. Results (p = 0.02) (p < 0.001) All-cause mortality at 90 days: 27.5% for intensive group vs. 24.9% for conventional group (p = 0.02) All-cause mortality at 28 days: 22.3% vs. 20.8% (p = 0.17), respectively Severe hypoglycemia: 6.8% vs. 0.5% (p < 0.001), respectively 27.5 24.9 % 6.8 Conclusions 0.5 Among patients admitted to the ICU, intensive glucose control increased mortality an absolute 2.6% at 90 days (p = ns; CI 0.4 – 4.8) Severe hypoglycemia was more common in the intensive control group All-cause mortality at 90 days Severe hypoglycemia Intensive glucose control Conventional glucose control NICE-SUGAR Investigators. N Engl J Med 2009;360:
 vs. conventional glucose control (<180 mg/dl; n = 3,050). Insulin was given intravenously and nutrition was given enterally. Mean BG 115 mg vs 144 mg/dL. Results. (p = 0.02) (p < 0.001) All-cause mortality at 90 days: 27.5% for intensive group vs. 24.9% for conventional group (p = 0.02) All-cause mortality at 28 days: 22.3% vs. 20.8% (p = 0.17), respectively. Severe hypoglycemia: 6.8% vs. 0.5% (p < 0.001), respectively % 6.8. Conclusions Among patients admitted to the ICU, intensive glucose control increased mortality an absolute 2.6% at 90 days (p = ns; CI 0.4 – 4.8) Severe hypoglycemia was more common in the intensive control group. All-cause mortality at 90 days. Severe hypoglycemia. Intensive glucose control. Conventional glucose control. NICE-SUGAR Investigators. N Engl J Med 2009;360:")
17
NICE-SUGAR Study Outcomes
Outcome Measure Intensive Group Conventional Group Morning BG (mg/dL) Hypoglycemia (≤ 40mg/dL) 206/3016 (6.8%) 15/3014 (0.5%) 28 Day Mortality (p=0.17) 22.3% 20.8% 90 Day Mortality (p=0.02) 27.5% 24.9% The NICE-SUGAR Study Investigators. N Engl J Med. 360: , 2009.
 Hypoglycemia. (≤ 40mg/dL) 206/3016. (6.8%) 15/3014. (0.5%) 28 Day Mortality (p=0.17) 22.3% 20.8% 90 Day Mortality (p=0.02) 27.5% 24.9% The NICE-SUGAR Study Investigators. N Engl J Med. 360: ,")
18
NICE-SUGAR: Strengths
Large (N=6104) 2. Multicenter 3. Patients characteristic of a general ICU population 4. Uniformly applied, web-based IV insulin protocol 5. Hard primary endpoint (90-day mortality) 6. Robust analytical plan
 2. Multicenter. 3. Patients characteristic of a general ICU population. 4. Uniformly applied, web-based IV insulin protocol. 5. Hard primary endpoint (90-day mortality) 6. Robust analytical plan.")
19
NICE-SUGAR: Limitations
Specified BG targets & ultimate BG separation (-27 mg/dl) not as distinct as prior trials 2. Treatment target not achieved in the intensive arm. 3. Variable methods/sources for BG measurement 4. More steroid therapy in intensive arm 5. More hypoglycemia in intensive arm (15-fold) 6. No explanation of increased mortality in intensive arm (? hypoglycemia) 7. ~ 10% early withdrawls in intensive arm; ‘per-procotol’ (‘completers’) analysis not provided.
 not as distinct as prior trials. 2. Treatment target not achieved in the intensive arm. 3. Variable methods/sources for BG measurement. 4. More steroid therapy in intensive arm. 5. More hypoglycemia in intensive arm (15-fold) 6. No explanation of increased mortality in intensive arm ( hypoglycemia) 7. ~ 10% early withdrawls in intensive arm; ‘per-procotol’ (‘completers’) analysis not provided.")
20
Tight Glycemic Control in the Hospital
By normalizing glucose in the hospital, glucose toxicity is broken, improving both insulin secretion and insulin sensitivity 382 Type 2 DM patients, aged 25–70 years, from nine hospital centers in China had their glucose normalized by MDI or CSII for 2 weeks Remission rates after 1 year were significantly higher in the insulin groups (51% in CSII and 44% in MDI) than in the oral hypoglycaemic agents group (26%; p=0.0012) Vol 371 May 24, 2008
 than in the oral hypoglycaemic agents group (26%; p=0.0012) Vol 371 May 24,")
21
Intensive Insulin Therapy and Mortality Among Critically Ill Patients
Favors IIT Favors Control Mixed ICU Medical ICU Results of a recent meta-analysis that included the NICE-SUGAR study. Overall no difference… but Surgical patients appear to benefit from tight glycemic control. Surgical ICU ALL ICU Griesdale DE, et al. CMAJ. 2009;180(8):
:")
22
No. Events/Total No. Patients
Intensive Insulin Therapy and Hypoglycemic Events in Critically Ill Patients No. Events/Total No. Patients Study IIT Control Risk ratio (95% CI) Van den Berghe et al 39/765 6/783 6.65 ( ) Henderson et al 7/32 1/35 7.66 ( ) Bland et al 1/5 1.00 ( ) 111/595 19/605 5.94 ( ) Mitchell et al 5/35 0/35 11.00 ( ) Azevedo et al 27/168 6/169 4.53 ( ) De La Rosa et al 21/254 2/250 10.33 ( ) Devos et al 54/550 15/551 3.61( ) Oksanen et al 7/39 1/51 9.15 ( ) Brunkhorst et al 42/247 12/290 4.11( ) Iapichino et al 8/45 3/45 2.67 ( ) Arabi et al 76/266 8/257 9.18 ( ) Mackenzie et al 50/121 9/119 5.46 ( ) NICE-SUGAR 206/3016 15/3014 13.72 ( ) Overall 654/6138 98/6209 5.99 ( ) Hypoglycemic Events Favors IIT Favors Control Canadian meta-analysis– tight glycemic control is associated with a six-fold increased risk of hypoglycemia 0.1 1 10 Reproduced with permission from Griesdale DE, et al. CMAJ. 2009;180(8): Risk Ratio (95% CI)
 Van den Berghe et al. 39/765. 6/ ( ) Henderson et al. 7/32. 1/ ( ) Bland et al. 1/ ( ) 111/ / ( ) Mitchell et al. 5/35. 0/ ( ) Azevedo et al. 27/168. 6/ ( ) De La Rosa et al. 21/254. 2/ ( ) Devos et al. 54/ / ( ) Oksanen et al. 7/39. 1/ ( ) Brunkhorst et al. 42/ / ( ) Iapichino et al. 8/45. 3/ ( ) Arabi et al. 76/266. 8/ ( ) Mackenzie et al. 50/121. 9/ ( ) NICE-SUGAR. 206/ / ( ) Overall. 654/ / ( ) Hypoglycemic Events. Favors IIT Favors Control. Canadian meta-analysis– tight glycemic control is associated with a six-fold increased risk of hypoglycemia Reproduced with permission from Griesdale DE, et al. CMAJ. 2009;180(8): Risk Ratio (95% CI)")
23
Is Hypoglycemia Life Threatening?
[Devos.CurrOpin ClinNutr.2007/p206/ c2/line 40-46, p207/ c1/line 1-4] Strategies for Preventing Hypoglycemia These recent studies and meta-analysis bring up 2 questions…

24
Blood Glucose During Hospitalization and Incidence of Death Within 2 Years
[Svensson.EurHeartJ. 2005/p1260/Fig 2] Lowest blood glucose recorded during hospital stay ≤3.0 mmol/L or 55 mg/dL n+44; 20 deaths mmol/L or mg/dL n=364; 101 deaths ≥6.6 mmol/L or ≥120 mg/dL n=276; 107 deaths ( ) -3.5 -2.5 -1.5 -.5 .5 1.5 2.5 3.5 Referent ( ) This study evaluated the associations between glycometabolic parameters at admission and during hospitalization and 2-year all-cause mortality risk in an unselected cohort of consecutive patients with diabetes admitted for unstable angina or non-Q-wave myocardial infarction to a university hospital during For the 684 patients with blood glucose data during hospitalization available, 44 patients had at least 1 documented hypoglycemic event with glucose documented ≤3.0 mmol/L (≤55 mg/dL), 364 had an intermediate glucose value ( mmol/L or mg/dL), and 276 had persistent hypoglycemia with the lowest glucose documented ≥6.6 mmol/L (or 120 mg/dL). Compared with the intermediate group, both the lowest and the highest groups had significantly higher adjusted 2-year mortality using a model that included on-arrival blood glucose as a covariate (HR, 1.93; 95% CI, ; HR, 1.48; 95% CI, , respectively). Svensson AM et al. Eur Heart J :
 Referent ( ) This study evaluated the associations between glycometabolic parameters at admission and during hospitalization and 2-year all-cause mortality risk in an unselected cohort of consecutive patients with diabetes admitted for unstable angina or non-Q-wave myocardial infarction to a university hospital during For the 684 patients with blood glucose data during hospitalization available, 44 patients had at least 1 documented hypoglycemic event with glucose documented ≤3.0 mmol/L (≤55 mg/dL), 364 had an intermediate glucose value ( mmol/L or mg/dL), and 276 had persistent hypoglycemia with the lowest glucose documented ≥6.6 mmol/L (or 120 mg/dL). Compared with the intermediate group, both the lowest and the highest groups had significantly higher adjusted 2-year mortality using a model that included on-arrival blood glucose as a covariate (HR, 1.93; 95% CI, ; HR, 1.48; 95% CI, , respectively). Svensson AM et al. Eur Heart J :")
25
Severe Hypoglycemia in Critically Ill Patients Associated With Increased Risk of Mortality
60 50 40 Mortality Rate, % 30 20 10 This study was a retrospective database review, including a case-control analysis that matched each patient with severe hypoglycemia with 3 controls. It included 102 patients with at least 1 episode of severe hypoglycemia extracted from a series of 5365 medical, surgical, and cardiac patients admitted consecutively between October 1, 1999, and June 15, A program of tight glycemic control was implemented on February 1, 2003; 2666 patients were treated before and 2699 after this date. Multivariable logistic regression analysis identified diabetes, septic shock, renal insufficiency, mechanical ventilation, severity of illness, and treatment in the tight glycemic control period as independent risk factors for the development of severe hypoglycemia (defined as glucose <40 mg/dL). Mortality was 55.9% among the 102 patients with severe hypoglycemia and 39.5% among the 306 controls (P=.006). Multivariable logistic regression analysis identified severe hypoglycemia as an independent predictor of mortality for the entire cohort (odds ratio, 2.28; 95% CI, ; P=.008). SH Controls No SH Severe hypoglycemia (<40 mg/dL) was associated with an increased risk of mortality (OR, 2.28; 95% CI, ; P=.0008) Krinsley JS, Grover A. Crit Care Med. 2007;35(10):
. Mortality was 55.9% among the 102 patients with severe hypoglycemia and 39.5% among the 306 controls (P=.006). Multivariable logistic regression analysis identified severe hypoglycemia as an independent predictor of mortality for the entire cohort (odds ratio, 2.28; 95% CI, ; P=.008). SH. Controls. No SH. Severe hypoglycemia (<40 mg/dL) was associated with an increased risk of mortality (OR, 2.28; 95% CI, ; P=.0008) Krinsley JS, Grover A. Crit Care Med. 2007;35(10):")
26
Blood Glucose & Post-AMI Outcomes A U-Shaped Relationship?
Title Subtitle Blood Glucose & Post-AMI Outcomes A U-Shaped Relationship? P < for each endpoint Pinto DS, et al. J Am Coll Cardiol. 2005;46: 26

27
Mean Glucose & In-Hospital Mortality in 16,871 Patients with AMI
(Reference: Mean BG mg/dl) Investigators evaluated 16,871 acute myocardial infarction (MI) patients hospitalized from January 2000 to December Using logistic regression models and C indexes, 3 metrics of glucose control (mean glucose, time-averaged glucose, hyperglycemic index), each evaluated over 3 time windows (first 24 hours, 48 hours, entire hospitalization), were compared with admission glucose for their ability to discriminate hospitalization survivors from nonsurvivors. Models were then used to evaluate the relationship between mean glucose and in-hospital mortality. In unadjusted analysis, higher mean hospitalization glucose was strongly associated with higher in-hospital mortality. As shown in the figure on the left, when mean hospitalization glucose was analyzed in increments of 10 mg/dL, there was a clear J-shaped relationship between glucose values and mortality rates. Although in the normal glucose range, patients without recognized diabetes had a lower mortality rate than patients with diabetes, their risk increased much more steeply at higher glucose levels, surpassing the risk of patients with diabetes at approximately 130 mg/dL. After multivariable adjustment, the nature of these relationships persisted. As shown in the figure on the right, higher mean hospitalization glucose continued to be strongly associated with higher in-hospital mortality. There was a statistically significant, gradual increase in the odds of in-hospital mortality with each 10-mg/dL incremental rise in mean hospitalization glucose levels above the threshold of 120 mg/dL. The odds of death associated with higher mean glucose rose steeply in patients without recognized diabetes once mean glucose levels exceeded 120 mg/dL. Measures of persistent hyperglycemia were better predictors of mortality than was admission glucose. Mean hospitalization glucose appears to be the most practical metric of hyperglycemia-associated risk in patients with acute MI. Kosiborod M et al. Circulation 2008:117:1018
 Investigators evaluated 16,871 acute myocardial infarction (MI) patients hospitalized from January 2000 to December Using logistic regression models and C indexes, 3 metrics of glucose control (mean glucose, time-averaged glucose, hyperglycemic index), each evaluated over 3 time windows (first 24 hours, 48 hours, entire hospitalization), were compared with admission glucose for their ability to discriminate hospitalization survivors from nonsurvivors. Models were then used to evaluate the relationship between mean glucose and in-hospital mortality. In unadjusted analysis, higher mean hospitalization glucose was strongly associated with higher in-hospital mortality. As shown in the figure on the left, when mean hospitalization glucose was analyzed in increments of 10 mg/dL, there was a clear J-shaped relationship between glucose values and mortality rates. Although in the normal glucose range, patients without recognized diabetes had a lower mortality rate than patients with diabetes, their risk increased much more steeply at higher glucose levels, surpassing the risk of patients with diabetes at approximately 130 mg/dL. After multivariable adjustment, the nature of these relationships persisted. As shown in the figure on the right, higher mean hospitalization glucose continued to be strongly associated with higher in-hospital mortality. There was a statistically significant, gradual increase in the odds of in-hospital mortality with each 10-mg/dL incremental rise in mean hospitalization glucose levels above the threshold of 120 mg/dL. The odds of death associated with higher mean glucose rose steeply in patients without recognized diabetes once mean glucose levels exceeded 120 mg/dL. Measures of persistent hyperglycemia were better predictors of mortality than was admission glucose. Mean hospitalization glucose appears to be the most practical metric of hyperglycemia-associated risk in patients with acute MI. Kosiborod M et al. Circulation 2008:117:1018.")
28
Hypoglycemia and Cardiovascular Events
Tachycardia and high blood pressure Myocardial ischemia Silent ischemia, angina, infarction Cardiac arrhythmias Transiently prolonged corrected QT interval, Increased QT dispersion Sudden death Why is hypoglycemia bad? We MUST avoid hypoglycemia NOT ONLY because acute neuroglycopenia, AMS and risk of seizures, but due to CV complications. Wright RJ, Frier BM, Diabetes Metab Res Rev 2008; 24: 353–363.

29
Strategies for Preventing Hypoglycemia in the ICU
[Devos.CurrOpin ClinNutr.2007/p206/ c2/line 40-46, p207/ c1/line 1-4] Better protocols and systems to implement insulin protocols Less aggressive BG targets (AACE/ADA Guidelines) Improved glucose monitoring devices to analyzed frequent and accurate real-time CGM Inpatient hyperglycemia teams SO, WHAT CAN we DO?
 Improved glucose monitoring devices to analyzed frequent and accurate real-time CGM. Inpatient hyperglycemia teams. SO, WHAT CAN we DO")
30
AACE/ADA Recommended Target Glucose Levels in ICU Patients
ICU setting: Starting threshold of no higher than 180 mg/dL Once IV insulin is started, the glucose level should be maintained between 140 and 180 mg/dL Lower glucose targets ( mg/dL) may be appropriate in selected patients Targets <110 mg/dL or >180 mg/dL are not recommended Based on the high rate of hypoglycemia and no difference in mortality in major trials, and the results of NICE –SUGAR that reported increased mortality… NEW TASK FORCE. The slide shows the recommendations for target glucose levels in critically ill patients in the intensive care setting, which were released on May 8, 2009, by the American Association of Clinical Endocrinologists and the American Diabetes Association, and published online in the June issues of Endocrine Practice and Diabetes Care. They include the following: Insulin therapy should be initiated for treatment of persistent hyperglycemia, starting at a threshold of no greater than 180 mg/dL. Once insulin therapy has been started, a glucose range of 140 to 180 mg/dL is recommended for the majority of critically ill patients. Intravenous insulin infusions are the preferred method for achieving and maintaining glycemic control in critically ill patients. Validated insulin infusion protocols with demonstrated safety and efficacy, and with low rates of occurrence of hypoglycemia, are recommended. With IV insulin therapy, frequent glucose monitoring is essential to minimize the occurrence of hypoglycemia and to achieve optimal glucose control. Recommended Acceptable Not recommended <110 >180 Moghissi ES, et al; AACE/ADA Inpatient Glycemic Control Consensus Panel. Endocr Pract. 2009;15(4). Moghissi ES, Korytkowski MT, Dinardo M, et al; AACE/ADA Inpatient Glycemic Control Consensus Panel. American Association of Clinical Endocrinologists and American Diabetes Association Consensus Statement on Inpatient Glycemic Control. Endocr Pract. 2009;15(4). Accessed May 18, 2009. 30
 may be appropriate in selected patients Targets <110 mg/dL or >180 mg/dL are not recommended. Based on the high rate of hypoglycemia and no difference in mortality in major trials, and the results of NICE –SUGAR that reported increased mortality… NEW TASK FORCE. The slide shows the recommendations for target glucose levels in critically ill patients in the intensive care setting, which were released on May 8, 2009, by the American Association of Clinical Endocrinologists and the American Diabetes Association, and published online in the June issues of Endocrine Practice and Diabetes Care. They include the following: Insulin therapy should be initiated for treatment of persistent hyperglycemia, starting at a threshold of no greater than 180 mg/dL. Once insulin therapy has been started, a glucose range of 140 to 180 mg/dL is recommended for the majority of critically ill patients. Intravenous insulin infusions are the preferred method for achieving and maintaining glycemic control in critically ill patients. Validated insulin infusion protocols with demonstrated safety and efficacy, and with low rates of occurrence of hypoglycemia, are recommended. With IV insulin therapy, frequent glucose monitoring is essential to minimize the occurrence of hypoglycemia and to achieve optimal glucose control. Recommended Acceptable Not recommended. <110. >180. Moghissi ES, et al; AACE/ADA Inpatient Glycemic Control Consensus Panel. Endocr Pract. 2009;15(4). Moghissi ES, Korytkowski MT, Dinardo M, et al; AACE/ADA Inpatient Glycemic Control Consensus Panel. American Association of Clinical Endocrinologists and American Diabetes Association Consensus Statement on Inpatient Glycemic Control. Endocr Pract. 2009;15(4). Accessed May 18,")
31
AACE/ADA Target Glucose Levels in Non–ICU Patients
Non–ICU setting: Premeal glucose targets <140 mg/dL Random BG <180 mg/dL To avoid hypoglycemia, reassess insulin regimen if BG levels fall below 100 mg/dL Occasional patients may be maintained with a glucose range below and/or above these cut-points For the majority of noncritically ill patients treated with insulin, the premeal blood glucose (BG) target should generally be less than 140 mg/dL in conjunction with random BG levels less than 180 mg/dL, provided these targets can be safely achieved. To avoid hypoglycemia, consideration should be given to reassessing the insulin regimen if BG levels decline below 100 mg/dL. Modification of the regimen is necessary when BG values are <70 mg/dL, unless the event is easily explained by other factors (such as a missed meal). More stringent targets may be appropriate in stable patients in whom tight glycemic control was achieved previously. Less stringent targets may be appropriate in terminally ill patients or patients with severe comorbidities. Hypoglycemia is defined as any BG level <70 mg/dL. Severe hypoglycemia in hospitalized patients has been defined by many clinicians as BG <40 mg/dL, although this value is lower than the approximate 50 mg/dL level at which cognitive impairment begins in normal persons. Scheduled subcutaneous administration of insulin, with basal, nutritional, and correction components, is the preferred method for achieving and maintaining glucose control. Prolonged treatment with sliding-scale insulin as the sole regimen is discouraged. Noninsulin antihyperglycemic agents are not appropriate in most hospitalized patients who require treatment for hyperglycemia. Hypoglycemia = BG <70 mg/dL Severe hypoglycemia = BG <40 mg/dL Moghissi ES, et al; AACE/ADA Inpatient Glycemic Control Consensus Panel. Endocr Pract. 2009;15(4). Moghissi ES, Korytkowski MT, Dinardo M, et al; AACE/ADA Inpatient Glycemic Control Consensus Panel. American Association of Clinical Endocrinologists and American Diabetes Association Consensus Statement on Inpatient Glycemic Control. Endocr Pract. 2009;15(4). Accessed May 18, 2009. 31
 target should generally be less than 140 mg/dL in conjunction with random BG levels less than 180 mg/dL, provided these targets can be safely achieved. To avoid hypoglycemia, consideration should be given to reassessing the insulin regimen if BG levels decline below 100 mg/dL. Modification of the regimen is necessary when BG values are <70 mg/dL, unless the event is easily explained by other factors (such as a missed meal). More stringent targets may be appropriate in stable patients in whom tight glycemic control was achieved previously. Less stringent targets may be appropriate in terminally ill patients or patients with severe comorbidities. Hypoglycemia is defined as any BG level <70 mg/dL. Severe hypoglycemia in hospitalized patients has been defined by many clinicians as BG <40 mg/dL, although this value is lower than the approximate 50 mg/dL level at which cognitive impairment begins in normal persons. Scheduled subcutaneous administration of insulin, with basal, nutritional, and correction components, is the preferred method for achieving and maintaining glucose control. Prolonged treatment with sliding-scale insulin as the sole regimen is discouraged. Noninsulin antihyperglycemic agents are not appropriate in most hospitalized patients who require treatment for hyperglycemia. Hypoglycemia = BG <70 mg/dL. Severe hypoglycemia = BG <40 mg/dL. Moghissi ES, et al; AACE/ADA Inpatient Glycemic Control Consensus Panel. Endocr Pract. 2009;15(4). Moghissi ES, Korytkowski MT, Dinardo M, et al; AACE/ADA Inpatient Glycemic Control Consensus Panel. American Association of Clinical Endocrinologists and American Diabetes Association Consensus Statement on Inpatient Glycemic Control. Endocr Pract. 2009;15(4). Accessed May 18,")
32
Methods For Managing Hospitalized Persons with Diabetes
Title Subtitle Methods For Managing Hospitalized Persons with Diabetes Continuous Variable Rate IV Insulin Drip Surgery, NPO, Unstable, MI, DKA, Hyperglycemia, Steroids, Gastroparesis, Delivery, etc Basal / Bolus Therapy (MDI) when eating
 when eating.")
33
The Ideal IV Insulin Protocol
Title Subtitle The Ideal IV Insulin Protocol Easily ordered (signature only or preferably nurse mandated) Effective (Gets to goal quickly) Safe (Minimal risk of hypoglycemia) Easily implemented Able to be used hospital wide
 Effective (Gets to goal quickly) Safe (Minimal risk of hypoglycemia) Easily implemented. Able to be used hospital wide.")
34
Essentials of a good IV Insulin Algorithm
Title Subtitle Essentials of a good IV Insulin Algorithm Easily implemented by nursing staff Able to seek BG range via: - Hourly BG monitoring - Adjusts to the insulin sensitivity of the patient

35
Various Protocols Exist
Title Subtitle Various Protocols Exist Atlanta Multiplier Method Van den Berghe (studied in critical care setting) Portland Protocol (used in surgical setting) Markovitz (studied in postoperative heart surgery patients) Yale Protocol (studied in medical intensive care setting) Various Protocols Exist A number of protocols have been published for the administration of continuous insulin infusion. The use of standardized protocols is associated with improved glycemic control and low rates of hypoglycemia.
 Portland Protocol (used in surgical setting) Markovitz (studied in postoperative heart surgery patients) Yale Protocol (studied in medical intensive care setting) Various Protocols Exist. A number of protocols have been published for the administration of continuous insulin infusion. The use of standardized protocols is associated with improved glycemic control and low rates of hypoglycemia.")
36
Practical Closed Loop Insulin Delivery: Multiplier Method
A System for the Maintenance of Overnight Euglycemia and the Calculation of Basal Insulin Requirements in Insulin-Dependent Diabetics 1/slope = Multiplier = 0.02 6 5 4 Insulin Rate (U/hr) 3 2 1 100 200 300 400 Glucose (mg/dl) NEIL H. WHITE, M.D., DONALD SKOR, M.D., JULIO V. SANTIAGO, M.D.;Ann Int Med 1982 ;97:
 Glucose (mg/dl) NEIL H. WHITE, M.D., DONALD SKOR, M.D., JULIO V. SANTIAGO, M.D.;Ann Int Med 1982 ;97:")
37
Continuous Variable Rate IV Insulin Drip Atlanta Multiplier Method
Title Subtitle Continuous Variable Rate IV Insulin Drip Atlanta Multiplier Method Starting Rate Units / hour = (BG – 60) x 0.02 where BG is current Blood Glucose and is the multiplier Check glucose every hour and adjust drip Adjust Multiplier to keep in desired glucose target range (90 to 120 in ICU; 100 to 140 on floor)
 x where BG is current Blood Glucose. and 0.02 is the multiplier. Check glucose every hour and adjust drip. Adjust Multiplier to keep in desired glucose. target range (90 to 120 in ICU; 100 to 140 on floor)")
38
Multiplier Principles
Insulin Units / Hour Glucose mg/ dl Davidson et al, Diabetes Care 28(10): , 2005
: ,")
41
Ideal Solution Computer directed insulin infusion
Title Subtitle Ideal Solution Computer directed insulin infusion Complexity is moved to the computer Standardization is achieved Hypoglycemia is minimized Davidson et al, Diabetes Care 28(10): , 2005
: ,")
42
Computer-Guided Vs. Standard Column-Based Insulin Regimens
Study Aim: To determine differences in glycemic control between treatment with a computer-guided algorithm (Glucommander) and a standard paper-form algorithm in critically ill patients in the ICU Design: Multi-center, prospective, randomized trial in hyperglycemic patients admitted to a medical ICU Primary outcome: Differences in BG control Secondary outcomes: Number of hypoglycemic (BG <60 mg/dL and < 40 mg/dl) and hyperglycemic events (BG >200 mg/dL), ICU and hospital length of stay To investigate if “better or different algorithms” may not be the answer… we recently completed a Comparison study of Insulin Infusion Protocols in the ICU: Computer-Guided (Glucommander) Vs. Standard Column-Based (paper-form) Insulin Regimens. Presented at the ADA 2008 meeting. Newton CA et al. Diabetes 57 (Suppl. 1) 136A, 2008.
 and a standard paper-form algorithm in critically ill patients in the ICU. Design: Multi-center, prospective, randomized trial in hyperglycemic patients admitted to a medical ICU. Primary outcome: Differences in BG control. Secondary outcomes: Number of hypoglycemic (BG <60 mg/dL and < 40 mg/dl) and hyperglycemic events (BG >200 mg/dL), ICU and hospital length of stay. To investigate if better or different algorithms may not be the answer… we recently completed a Comparison study of Insulin Infusion Protocols in the ICU: Computer-Guided (Glucommander) Vs. Standard Column-Based (paper-form) Insulin Regimens. Presented at the ADA 2008 meeting. Newton CA et al. Diabetes 57 (Suppl. 1) 136A,")
43
Glucommander vs. Standard Mean Glucose Values
Mean Glucose Maintained once Target Achieved Glucommander = ± 9 mg/dL Standard = ± 18 mg/dL Glucommander lower BG (P<0.0001) but not sure if the difference is clinical significant (based on recent large RCT) * p < Newton CA et al. Diabetes 57 (Suppl. 1) 136A, 2008. 43
 but not sure if the difference is clinical significant (based on recent large RCT) * p < Newton CA et al. Diabetes 57 (Suppl. 1) 136A,")
44
Glucommander vs. Standard
% of Glucoses Maintained within Target Achieved Glucommander = 68.6% Standard = 46.4%* Glucommander had less BG variability (fluctuations) than paper form – may be an important point. * p < Newton CA et al. Diabetes 57 (Suppl. 1) 136A, 2008. 44
 than paper form – may be an important point. * p < Newton CA et al. Diabetes 57 (Suppl. 1) 136A,")
45
% of PATIENTS with LOWEST BG < 40 mg/dL
BGmean All GlucommanderTM 1.1% G+TM G+TM SICU Other Tight-Control NICE-SUGAR GlucommanderTM

46
Strategies for Preventing Hypoglycemia
Algorithm 1 Algorithm 2 Algorithm 3 Algorithm 4 BG (mg/dL) Units/hr BG (mg/dL) <60 = Hypoglycemia (See below for treatment) <70 Off 70 - 109 0.2 0.5 1 1.5 110 119 2 3 120 149 5 150 179 4 7 180 209 9 210 239 6 12 240 269 8 16 270 299 10 20 300 329 Reduce insulin rate or hold insulin infusion at a higher BG concentration This is an example of a paper-form protocol. High rate of BG < 60 mg/dl -- The reason is that we targeted a BG between mg/dl. Both protocols did not reduce or held insulin until the BG was < 70 mg/dl. 24 330 - 359 4 330 - 359 8 330 - 359 14 >330 28 >360 6 >360 12 >360 16 Newton CA et al. Diabetes 57 (Suppl. 1) 136A, 2008.
 Units/hr. BG. (mg/dL) <60 = Hypoglycemia (See below for treatment) <70. Off Reduce insulin rate or hold insulin infusion at a higher BG concentration. This is an example of a paper-form protocol. High rate of BG < 60 mg/dl -- The reason is that we targeted a BG between mg/dl. Both protocols did not reduce or held insulin until the BG was < 70 mg/dl > > > > Newton CA et al. Diabetes 57 (Suppl. 1) 136A,")
47
Events Triggering Hospital Hypoglycemia
Transportation off ward, causing meal delay Failure to measure blood glucose before insulin doses New NPO status Interruption of IV dextrose therapy Total parenteral nutrition Enteral feedings Continuous venovenous hemodialysis NON_ICU The slide lists events that can trigger in-hospital hypoglycemia. All of the events, except for failure to measure blood glucose before insulin doses, result from decreased caloric intake related to illness or hospital routine. Braithwaite SS, et al. Endocr Pract. 2004;10(suppl 2):89-99. Braithwaite SS, Buie MM, Thompson CL, et al. Hospital hypoglycemia: not only treatment but also prevention. Endocr Pract. 2004;10(suppl 2):89-99.
: Braithwaite SS, Buie MM, Thompson CL, et al. Hospital hypoglycemia: not only treatment but also prevention. Endocr Pract. 2004;10(suppl 2):")
48
Features Increasing the Risk of Hypoglycemia in an Inpatient Setting
Advanced age Renal failure Liver disease Concurrent illness (cerebral vascular accident, congestive heart failure, shock, sepsis) Ventilator use Concurrent medications (-blockers, quinolones, epinephrine) Among the patient risk factors for hypoglycemia are advanced age, renal failure, liver disease, concurrent illness (eg, cerebral vascular accident, congestive heart failure, shock, sepsis), ventilator use, and use of concurrent medications (eg, β-blockers, quinolones, steroids, epinephrine). D’Hondt NJ. Diabetes Spectrum. 2008;21(4):
 Ventilator use. Concurrent medications (-blockers, quinolones, epinephrine) Among the patient risk factors for hypoglycemia are advanced age, renal failure, liver disease, concurrent illness (eg, cerebral vascular accident, congestive heart failure, shock, sepsis), ventilator use, and use of concurrent medications (eg, β-blockers, quinolones, steroids, epinephrine). D’Hondt NJ. Diabetes Spectrum. 2008;21(4):")
49
Benefits of a Nurse-Mandated Protocol
Title Subtitle Benefits of a Nurse-Mandated Protocol All patients are screened and treated the same way Standardization can be achieved Modification of the protocols can easily be done based on outcomes and analysis of the data

50
Patient Presents With Hyperglycemia
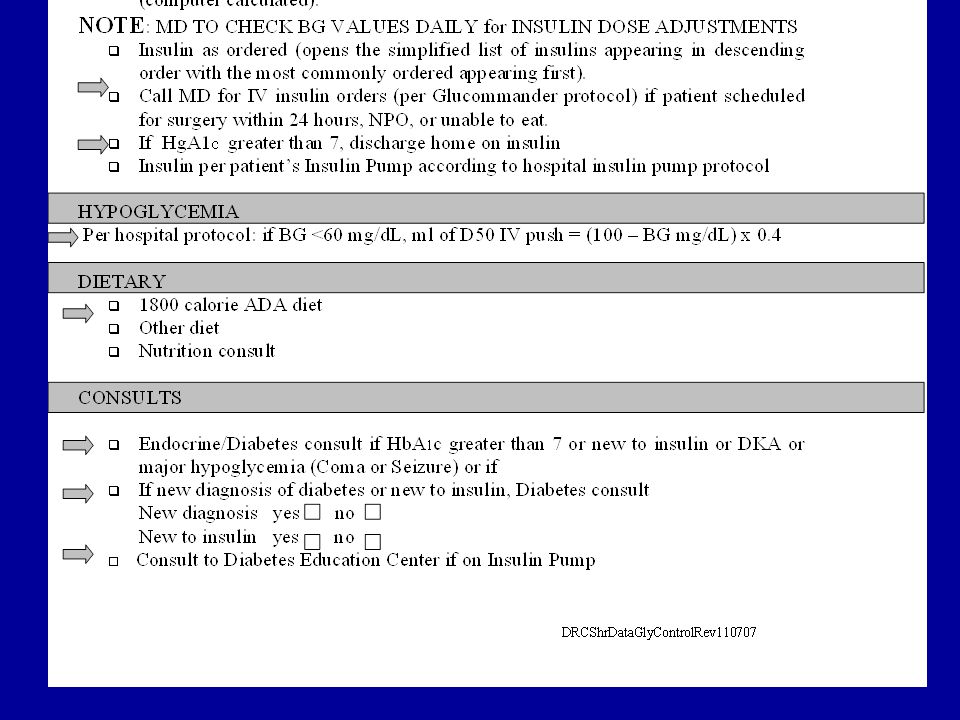
Title Subtitle Patient Presents With Hyperglycemia Previously diagnosed DM Diabetic ketoacidosis or hyperglycemic crisis follow DKA protocol No previous diagnosis of DM and BG > 140 mg/dL Modification of therapy to keep BG at goal BG is > 110 mg/dL for a critically ill patient; notify physician for initiation of IV insulin therapy Begin BG testing BG is > 140 mg/dL for noncritically ill patient, notify physician for initiation of subcutaneous therapy All patients with hyperglycemia should have an HbA1C drawn to aid in transition and discharge therapy

51
Methods of Screening for Hyperglycemia
Title Subtitle Methods of Screening for Hyperglycemia Finger stick blood glucose on admission or use of the glucose done on the biochemical profile If glucose >110 mg/dL fasting or >140 mg/dL random, place in appropriate protocol and continue monitoring Draw Hemoglobin A1C for help in deciding who needs transition from IV to SC insulin and what treatment is needed at home, including insulin. Hyperglycemia in Patients With Undiagnosed Diabetes New hyperglycemia was defined as an admission or in-hospital fasting glucose level of 126 mg/dL (7 mmol/L) or more or a random blood glucose level of 200 mg/dL (11.1 mmol/L) or more on 2 or more determinations. Hyperglycemia was present in 38% of patients admitted to the hospital, of whom 26% had a known history of diabetes, and 12% had no history of diabetes before admission. Newly discovered hyperglycemia was associated with a higher in-hospital mortality rate (16%) compared with patients with a history of diabetes (3%) and patients with normoglycemia (1.7%; both P < 0.01). In addition, new hyperglycemic patients had longer hospital stays and a higher admission rate to an intensive care unit, and were less likely to be discharged to home, frequently requiring transfer to a transitional care unit or nursing home facility. The results indicate that in-hospital hyperglycemia is a common finding and represents an important marker of poor clinical outcome and mortality in patients with and without a history of diabetes. Patients with newly diagnosed hyperglycemia had a significantly higher mortality rate and a lower functional outcome than patients with a known history of diabetes or normoglycemia. 1. Umpierrez GE, Isaacs SD, Bazargan N, et al. Hyperglycemia: an independent marker of in-hospital mortality in patients with undiagnosed diabetes. J Clin Endocrinol Metab. 2002;87:
 or more or a random blood glucose level of 200 mg/dL (11.1 mmol/L) or more on 2 or more determinations. Hyperglycemia was present in 38% of patients admitted to the hospital, of whom 26% had a known history of diabetes, and 12% had no history of diabetes before admission. Newly discovered hyperglycemia was associated with a higher in-hospital mortality rate (16%) compared with patients with a history of diabetes (3%) and patients with normoglycemia (1.7%; both P < 0.01). In addition, new hyperglycemic patients had longer hospital stays and a higher admission rate to an intensive care unit, and were less likely to be discharged to home, frequently requiring transfer to a transitional care unit or nursing home facility. The results indicate that in-hospital hyperglycemia is a common finding and represents an important marker of poor clinical outcome and mortality in patients with and without a history of diabetes. Patients with newly diagnosed hyperglycemia had a significantly higher mortality rate and a lower functional outcome than patients with a known history of diabetes or normoglycemia. 1. Umpierrez GE, Isaacs SD, Bazargan N, et al. Hyperglycemia: an independent marker of in-hospital mortality in patients with undiagnosed diabetes. J Clin Endocrinol Metab. 2002;87:")
54
Results of Nurse-Mandated Protocol in CV Patients
Title Subtitle Results of Nurse-Mandated Protocol in CV Patients ~2000 CV surgery patients have been studied On IV insulin BG stabilized at <120 mg/dL in a mean of 3 hours IV insulin was continued for an average of 37 hours 98% were controlled so that no BG was >200 mg/dL in the 48 hours following surgery 2% had transient BG <50 mg/dL; 0% <40 mg/dL The mean for all BG in all patients was 107 mg/dL Davidson PC et al. J Diabetes Sci and Technol. 2008; 2(3): 54
:")
55
Average BG’s ± SD of All Glycemic Protocol Runs (n = 470)
Title Subtitle Average BG’s ± SD of All Glycemic Protocol Runs (n = 470)
")
56
Managed by Anesthesiology in Operating Room
Title Subtitle Transition to SubQ Managed by Anesthesiology in Operating Room SubQ Basal-Bolus Glucommander hours

57
Transition from Glucommander to Basal-Bolus Insulin
Glargine and Aspart Basal: Multiplier * 500; CIR: 0.5 / Multiplier; Correction Factor: 1.7 / Multiplier n=209 Blood Glucose (mg/dl) Hours after IV insulin Last GM Bedtime Breakfast Breakfast Breakfast Lunch Dinner 3:00AM Lunch Bedtime Dinner 3:00AM Bedtime Lunch Dinner 3:00AM
 Hours after IV insulin. Last GM. Bedtime. Breakfast. Breakfast. Breakfast. Lunch. Dinner. 3:00AM. Lunch. Bedtime. Dinner. 3:00AM. Bedtime. Lunch. Dinner. 3:00AM.")
58
CVS Hyperglycemia Protocol Piedmont Hospital 2006
Title Subtitle CVS Hyperglycemia Protocol Piedmont Hospital 2006 Reduced post-op length of stay: 0.8 days ICU cost per day: $1,244.99 CVS at Piedmont per year: 998 Annual savings: 0.8 * $1,245 * 998 = $994,000 Sites in database of Society of Thoracic Surgeons: 860 Projected total national savings: $855 million

59
Converting to SC insulin
Title Subtitle Converting to SC insulin If More than 0.5 u/hr IV insulin required with normal BG, start long-acting insulin (glargine) Exception: if no prior DM and normal A1C, may not need SC insulin Must start SC insulin at least 1 to 2 hours before stopping IV insulin Some centers start long-acting insulin on initiation of IV insulin or the night before stopping the drip
 Exception: if no prior DM and normal A1C, may not need SC insulin. Must start SC insulin at least 1 to 2 hours before stopping IV insulin. Some centers start long-acting insulin on initiation of IV insulin or the night before stopping the drip.")
60
Total Intravenous vs. Subcutaneous 24-hour Insulin Requirements, units
Title Subtitle Intravenous Insulin Infusion Under Basal Conditions Correlates Well With Subsequent Subcutaneous Insulin Requirement Total Intravenous vs. Subcutaneous 24-hour Insulin Requirements, units 275 250 225 200 175 150 125 100 75 50 25 Units SQ Intravenous Insulin Infusion Under Basal Conditions Correlates Well With Subsequent Subcutaneous Insulin Requirement 25 50 75 100 125 150 175 200 225 250 275 Units IV Hawkins et al. Endocr Pract. 1995;1:385–389.

61
Glulisine Glulisine Glulisine
Basal/Bolus Treatment Program with Rapid-acting and Long-acting Analogs Breakfast Lunch Dinner Aspart, Aspart, Aspart, Lispro Lispro Lispro or or or Glulisine Glulisine Glulisine Plasma insulin Glargine or Detemir 4:00 8:00 12:00 16:00 20:00 24:00 4:00 8:00 Time

62
Converting from IV to SC insulin
Title Subtitle Converting from IV to SC insulin Establish 24 hr Insulin Requirement Extrapolate from average over last 4 hr if stable Give One-Half Amount As Basal Give One-Half Amount As Total Bolus Give post meal based on portion of food consumed or Give 1.5 units Rapid-acting for every CHO consumed Monitor a.c. tid, hs, and 3 am Correction Bolus for All BG >140 mg/dl

63
Initiating SC Basal Bolus
Starting total dose = 0.5 x wgt. in kg Wt. is 100 kg; 0.5 x 100 = 50 units Basal dose (glargine) = 50% of starting dose at HS 0.5 x 50 = 25 units at HS Bolus doses (rapid analog) = 50% of starting dose 0.5 x 50 = 25 divided by 3 = ~8 units pc (tid) Correction bolus = (BG - 100)/ CF, where CF = 1700/total daily dose; CF = 30
 = 50% of starting dose at HS. 0.5 x 50 = 25 units at HS. Bolus doses (rapid analog) = 50% of starting dose. 0.5 x 50 = 25 divided by 3 = ~8 units pc (tid) Correction bolus = (BG - 100)/ CF, where CF = 1700/total daily dose; CF = 30.")
64
Case #1 Fifty-eight y/o male with: T2DM x 8 years
Shortness of breath lasting ~48 hours Substernal fullness (oppressive feeling) OFF/ON for 4 hours T2DM x 8 years Metformin plus SU plus TZD (maximum doses) CAD with history of MI 3 years ago 2 vessel stent placements following MI Dual oral antiplatelet therapy HTN x 8 years ACE inhibitor, β-blocker, furosemide Dyslipidemia x 8 years Statin Patient History Key Point: This is a case study of a 58-year-old man who is presenting to the local emergency department (ED) with chief complaints of shortness of breath and pedal edema. SU, sulfonylurea; TZD, thiazolidinedione; CAD, coronary artery disease; HTN, hypertension; ACE, angiotensin converting enzyme; BMI, body mass index.
 OFF/ON for 4 hours. T2DM x 8 years. Metformin plus SU plus TZD (maximum doses) CAD with history of MI 3 years ago. 2 vessel stent placements following MI. Dual oral antiplatelet therapy. HTN x 8 years. ACE inhibitor, β-blocker, furosemide. Dyslipidemia x 8 years. Statin. Patient History. Key Point: This is a case study of a 58-year-old man who is presenting to the local emergency department (ED) with chief complaints of shortness of breath and pedal edema. SU, sulfonylurea; TZD, thiazolidinedione; CAD, coronary artery disease; HTN, hypertension; ACE, angiotensin converting enzyme; BMI, body mass index.")
65
Rabbit 2 Trial: Treatment Success With Basal-Bolus vs
Rabbit 2 Trial: Treatment Success With Basal-Bolus vs. Sliding Scale Insulin 300 Sliding-scale Basal-bolus Hypoglycemia rate: 280 260 240 Basal Bolus Group: BG < 60 mg/dL: 3% BG < 40 mg/dL: none SSRI: BG < 40 mg/dL: none 220 BG, mg/dL 200 180 160 140 120 100 Admit 1 2 3 4 1 2 3 4 5 6 7 Key Point: A significant number of patients in the basal-bolus group reached the BG target of <140 mg/dL. Blood glucose levels significantly improved in patients who had failed sliding-scale insulin delivery and were switched to the basal-bolus regimen. With the BG target of <140 mg/dL, 66% (43 patients) in the basal-bolus group reached the target, while only 38% (25 patients) in the sliding-scale insulin delivery group met this goal. Fourteen percent (9 patients) of the patients treated with sliding-scale insulin delivery remained severely hyperglycemic, defined as BG >240 mg/dL, despite dose maximization. Glycemic control improved in these patients once they were switched to the basal-bolus regimen. Two patients in each group had hypoglycemia (defined as BG <60 mg/dL). No cases of severe hypoglycemia (defined as BG <40 mg/dL) were reported. Days of Therapy Persistent hyperglycemia (BG>240 mg/dl) is common (15%) during SSI therapy Umpierrez GE, et al. Diabetes Care. 2007;30(9): Umpierrez GE, Smiley D, Zisman A, et al. Randomized study of basal-bolus insulin therapy in the inpatient management of patients with type 2 diabetes (RABBIT 2 trial). Diabetes Care. 2007;30(9):
 in the basal-bolus group reached the target, while only 38% (25 patients) in the sliding-scale insulin delivery group met this goal. Fourteen percent (9 patients) of the patients treated with sliding-scale insulin delivery remained severely hyperglycemic, defined as BG >240 mg/dL, despite dose maximization. Glycemic control improved in these patients once they were switched to the basal-bolus regimen. Two patients in each group had hypoglycemia (defined as BG <60 mg/dL). No cases of severe hypoglycemia (defined as BG <40 mg/dL) were reported. Days of Therapy. Persistent hyperglycemia (BG>240 mg/dl) is common (15%) during SSI therapy. Umpierrez GE, et al. Diabetes Care. 2007;30(9): Umpierrez GE, Smiley D, Zisman A, et al. Randomized study of basal-bolus insulin therapy in the inpatient management of patients with type 2 diabetes (RABBIT 2 trial). Diabetes Care. 2007;30(9):")
66
Rabbit 2 Trial: Changes in Glucose Levels With Basal-Bolus vs
Rabbit 2 Trial: Changes in Glucose Levels With Basal-Bolus vs. Sliding Scale Insulin 240 220 a 200 a a b b 180 b BG, mg/dL b Sliding-scale 160 140 Basal-bolus 120 100 Admit 1 2 3 4 5 6 7 8 9 10 Key Point: Patients randomized to basal-bolus therapy achieved better glycemic control compared with those receiving sliding-scale insulin delivery in a hospitalized, non–ICU setting. This multicenter, prospective, open-label, randomized study enrolled 130 nonsurgical, insulin-naïve patients with a known history of diabetes for >3 months, admitted to medical general services with a blood glucose level between 140 and 400 mg/dL. Patients were randomly assigned to receive either sliding-scale regular insulin (SSRI; n=65) 4 times daily or a basal-bolus regimen with insulins glargine and glulisine (n=65). The goal of insulin therapy was to maintain fasting and premeal blood glucose levels <140 mg/dL while avoiding hypoglycemia. Compared with the basal-bolus group, patients who received sliding-scale insulin delivery had higher mean fasting glucose (165 ± 41 vs 147 ± 36 mg/dL, respectively, P<.01), mean random glucose (189 ± 42 vs 164 ± 35 mg/dL, respectively, P<.001), and mean glucose (193 ± 54 vs 166 ± 32 mg/dL, respectively, P<.001) during the hospital stay. The overall BG difference between treatment groups was 27 mg/dL (P<.01), with a mean daily BG difference ranging from 23 to 58 mg/dL during days 2 through 6 of therapy (P<.01). aP<.05. Days of Therapy bP<.05. Sliding scale regular insulin (SSRI) was given 4 times daily Basal-bolus regimen: glargine was given once daily; glulisine was given before meals. 0.4 U/kg/d x BG between mg/dL 0.5 U/kg/d x BG between mg/dL Umpierrez GE, et al. Diabetes Care. 2007;30(9): Umpierrez GE, Smiley D, Zisman A, et al. Randomized study of basal-bolus insulin therapy in the inpatient management of patients with type 2 diabetes (RABBIT 2 trial). Diabetes Care. 2007;30(9):
 4 times daily or a basal-bolus regimen with insulins glargine and glulisine (n=65). The goal of insulin therapy was to maintain fasting and premeal blood glucose levels <140 mg/dL while avoiding hypoglycemia. Compared with the basal-bolus group, patients who received sliding-scale insulin delivery had higher mean fasting glucose (165 ± 41 vs 147 ± 36 mg/dL, respectively, P<.01), mean random glucose (189 ± 42 vs 164 ± 35 mg/dL, respectively, P<.001), and mean glucose (193 ± 54 vs 166 ± 32 mg/dL, respectively, P<.001) during the hospital stay. The overall BG difference between treatment groups was 27 mg/dL (P<.01), with a mean daily BG difference ranging from 23 to 58 mg/dL during days 2 through 6 of therapy (P<.01). aP<.05. Days of Therapy. bP<.05. Sliding scale regular insulin (SSRI) was given 4 times daily. Basal-bolus regimen: glargine was given once daily; glulisine was given before meals. 0.4 U/kg/d x BG between mg/dL. 0.5 U/kg/d x BG between mg/dL. Umpierrez GE, et al. Diabetes Care. 2007;30(9): Umpierrez GE, Smiley D, Zisman A, et al. Randomized study of basal-bolus insulin therapy in the inpatient management of patients with type 2 diabetes (RABBIT 2 trial). Diabetes Care. 2007;30(9):")
67
Correction Bolus Formula
Current BG - Ideal BG Glucose Correction factor Example: Current BG: mg/dl Ideal BG: mg/dl Glucose Correction Factor: 30 mg/dl 30 = 5.0u

69
Categories of “Never” Events
Surgical eg, Amputation of incorrect body part Product/device eg, Use of contaminated device Patient protection eg, Inability to prevent a patient suicide Care management eg, Medication error leading to hypoglycemic event Environmental eg, Patient fall during hospital stay Criminal eg, Impersonation of a health care provider “Never” events can be related to surgical procedures, product/device, patient protection, care management, environment, and crime Surgical events include incorrect surgery being done, or surgery performed on the wrong body part or patient Product or device events involve patient death or disability as a result of contaminated drugs or devices, and the occurrence of intravascular embolism Patient protection events include patient suicide or disappearance of a patient resulting in death or serious disability Examples of care management events include patient death/serious disability related to a medication error (eg, wrong drug, dose, patient, time, rate, preparation, or route of administration); and death or serious disability associated with hypoglycemia, the onset of which occurs while the patient is being cared for in a health care facility Environmental events include burns, falls, electric shock, and the use of restraints that result in patient death or serious disability Criminal events range from abduction and assault to the ordering of patient care by someone impersonating a licensed health care provider National Quality Forum. Serious Reportable Events in Healthcare, 2006 Update: Executive Summary. Washington, DC: NQF; 2007. Reference National Quality Forum. Serious Reportable Events in Healthcare, 2006 Update: Executive Summary. Washington, DC: National Quality Forum; 2007.
; and death or serious disability associated with hypoglycemia, the onset of which occurs while the patient is being cared for in a health care facility. Environmental events include burns, falls, electric shock, and the use of restraints that result in patient death or serious disability. Criminal events range from abduction and assault to the ordering of patient care by someone impersonating a licensed health care provider. National Quality Forum. Serious Reportable Events in Healthcare, 2006 Update: Executive Summary. Washington, DC: NQF; Reference. National Quality Forum. Serious Reportable Events in Healthcare, 2006 Update: Executive Summary. Washington, DC: National Quality Forum;")
70
Protocol for Treatment of Hypoglycemia
Any BG <60 mg/dl: D50 = (100-BG) x 0.4 ml IV Recheck in 15 minutes and retreat if needed If eating, may use 15 gm of rapid CHO Do Not Hold Insulin When BG Normal
 x 0.4 ml IV. Recheck in 15 minutes and retreat if needed. If eating, may use 15 gm of rapid CHO. Do Not Hold Insulin When BG Normal.")
71
Hospital-Acquired Conditions: “Reasonably Preventable” Events
Foreign object left in patient postsurgery Air embolism Blood incompatibility Falls and trauma Pressure ulcers Vascular catheter- related infection Catheter-related urinary tract infection Manifestations of poor glycemic control Certain orthopedic surgical site infections Surgical site infection-mediastinitis following CABG Bariatric surgical site infections Deep vein thrombosis or pulmonary embolism after orthopedic procedures Hospital-acquired conditions (HACs) are defined as “reasonably preventable” with the implementation of evidence-based guidelines HACs include the following: Foreign object left in patient postsurgery Air embolism Blood incompatibility Falls and trauma Pressure ulcers Vascular catheter-related infection Catheter-related urinary tract infection Manifestations of poor glycemic control Certain orthopedic surgical site infections Bariatric surgical site infections Surgical site infection-mediastinitis following CABG Deep vein thrombosis or pulmonary embolism after orthopedic procedures Department of Health and Human Services: Centers for Medicare and Medicaid Services. Fed Regist. 2008;73: Reference Department of Health and Human Services: Centers for Medicare and Medicaid Services. Fed Regist. 2008;73:
 are defined as reasonably preventable with the implementation of evidence-based guidelines. HACs include the following: Foreign object left in patient postsurgery. Air embolism. Blood incompatibility. Falls and trauma. Pressure ulcers. Vascular catheter-related infection. Catheter-related urinary tract infection. Manifestations of poor glycemic control. Certain orthopedic surgical site infections. Bariatric surgical site infections. Surgical site infection-mediastinitis following CABG. Deep vein thrombosis or pulmonary embolism after orthopedic procedures. Department of Health and Human Services: Centers for Medicare and Medicaid Services. Fed Regist. 2008;73: Reference. Department of Health and Human Services: Centers for Medicare and Medicaid Services. Fed Regist. 2008;73:")
72
TPN or Enteral Feedings
Determine insulin requirement via IV Insulin needs For TPN, add insulin to TPN bag with correction SC every 4 to 6 hours For enteral feedings, give Glargine or Detemir every 12 hours or NPH every 8 hours or Regular every 6 hours with correction SC every 4 to 6 hours.

73
Hospital Diabetes Plan What Can We Do For Patients Admitted To Hospital?
Pathway Protocols For All Hyperglycemia and Diabetes Patients Finger Stick BG ac qid on ALL Admissions with BG >140 mg/dL or history of DM or high risk (ICU, Cardiac, Vascular, CVA, Steroids, etc) Check Hemoglobin A1C in all hyperglycemic patients
 Check Hemoglobin A1C in all hyperglycemic patients.")
74
Hospital Diabetes Plan Protocol for Insulin in Hospitalized Patient
Treat Any Patient With BG >110 or >140 mg/dl With Insulin If able to eat and not acutely sick, initiate basal bolus therapy SC If unable to eat or acutely ill or unable to control, pace on an insulin drip If known diabetes or A1c >6%, transition patient to basal bolus therapy once BG at goal and stable.

75
Endocrine or Diabetes Consult
Endocrine/Diabetes consult for any of the following reasons: Glycemic control is not obtained (i.e. BG’s <70 or >140 mg/dl) At the request of nursing services At MD request
 At the request of nursing services. At MD request.")
76
Diabetes Education and Discharge Planning
Diabetes service is contacted for all patients new to SC insulin. Discharge planning is initiated. Instruct Patient in Monitoring and Recording See That Patient Has Meter on Discharge Decide on Case Specific Program for Discharge Arrange Early F/U with PCP

77
Conclusion Our journey is not over, it has only begun
Title Subtitle Conclusion Our journey is not over, it has only begun We must normalize glucose in all hospital patients By implementing, assessing, and revising protocols / pathways for hyperglycemic management, we can ultimately achieve this goal of euglycemia

Similar presentations


 An Overview for Clinical Nurses NIH-NINDS U01 NSO69498.>")


