Download presentation
Presentation is loading. Please wait.

2
When you have completed your study of this chapter, you will be able to C H A P T E R C H E C K L I S T Use the production possibilities frontier to illustrate the economic problem. 1 Calculate opportunity cost. Define efficiency and describe an efficient use of resources. Explain how people gain from specialization and trade. 2 3 4

3
3.1 PRODUCTION POSSIBILITIES Production Possibilities Frontier Production possibilities frontier The boundary between the combinations of goods and services that can be produced and the combinations that cannot be produced, given the available factors of production and the state of technology. The PPF is a valuable tool for illustrating the effects of scarcity and its consequences.

4
Figure 3.1 shows the PPF for bottled water and CDs. Each point on the graph represents a column of the table. The line through the points is the PPF. 3.1 PRODUCTION POSSIBILITIES

6
The PPF puts three features of production possibilities in sharp focus: Attainable and unattainable combinations Full employment and unemployment Tradeoffs and free lunches

7
3.1 PRODUCTION POSSIBILITIES Attainable and Unattainable Combinations Because the PPF shows the limits to production, it separates attainable combinations from unattainable ones. Figure 3.2 on the next slide illustrates the attainable and unattainable combinations.

8
The PPF separates attainable combinations from unattainable combinations. Points outside the PPF such as point G are unattainable. We can produce at any point inside the PPF or on the frontier. 3.1 PRODUCTION POSSIBILITIES

10
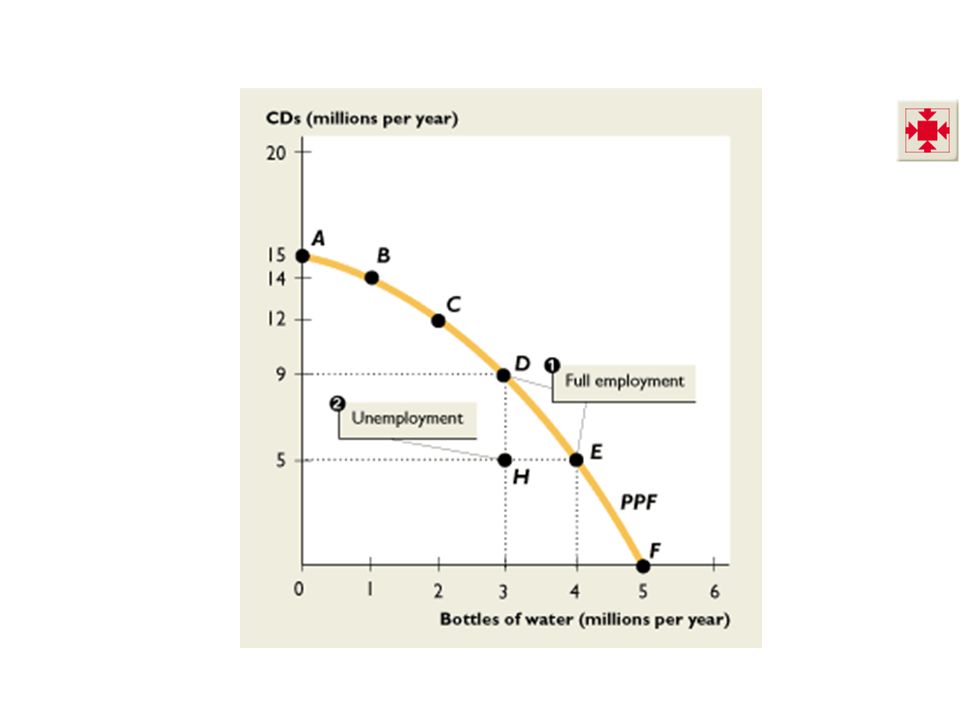
Full Employment and Unemployment Full employment occurs when all the available factors of production are being used. Unemployment occurs when some factors of production are not used. Figure 3.3 on the next slide illustrates full employment and unemployment.

11
1. When resources are fully employed, production occurs at points on the PPF such as D and E. 2. When resources are unemployed, production occurs at a point inside the PPF such as point H. 3.1 PRODUCTION POSSIBILITIES

13
Tradeoffs and Free Lunches Tradeoff A constraint or limit to what is possible that forces an exchange or a substitution of one thing for something else. To emphasize that every choice involves a cost, economists say, “There is no such thing as a free lunch.” But there would be a free lunch—something for nothing— if we were not at a point on the PPF.

14
1. When production is on the PPF, we face a tradeoff. There’s no free lunch. 2. If production were inside the PPF, there would be a free lunch. We could get more of both goods without forgoing either good. 3.1 PRODUCTION POSSIBILITIES

16
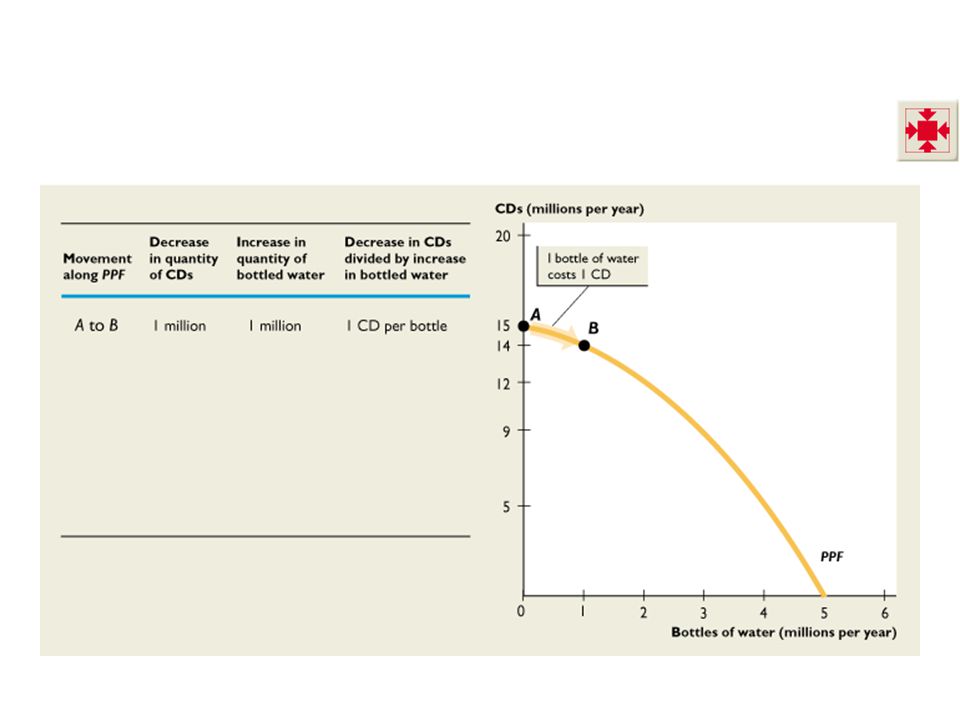
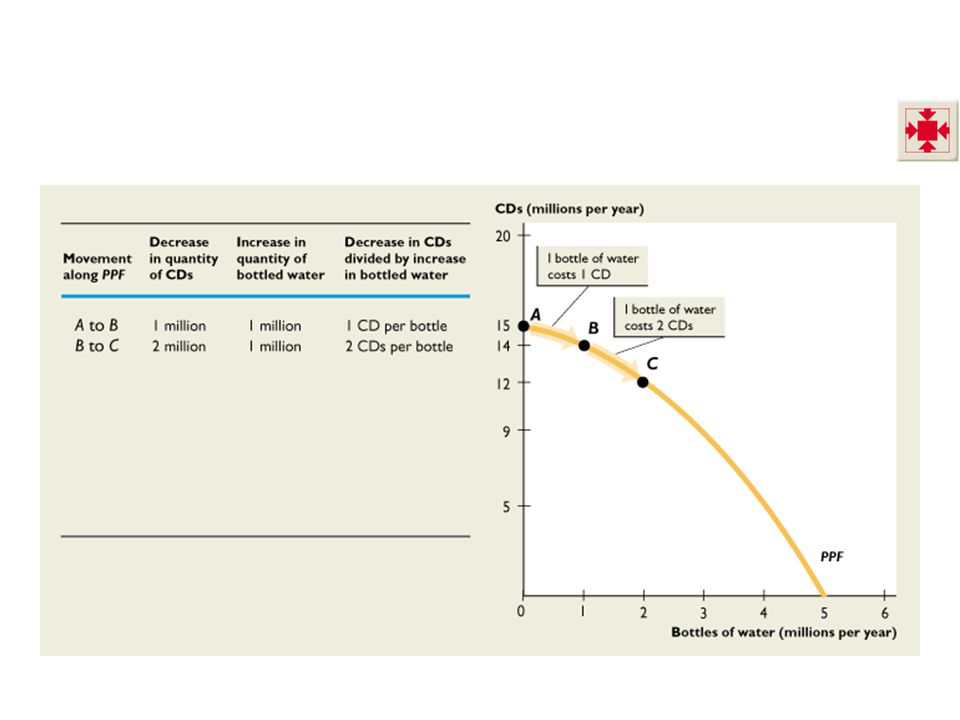
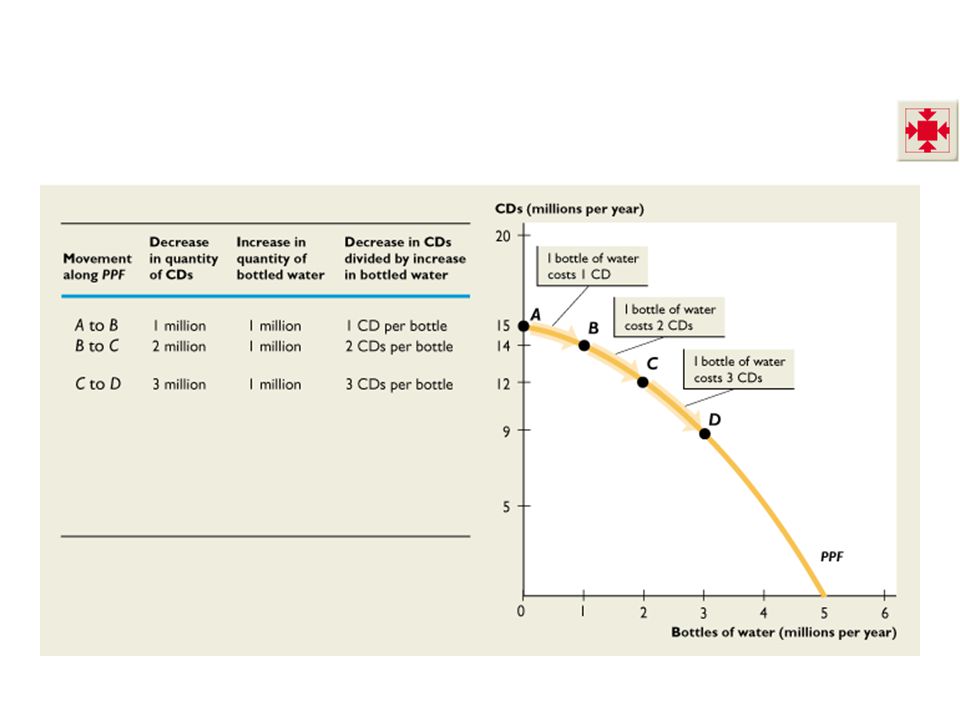
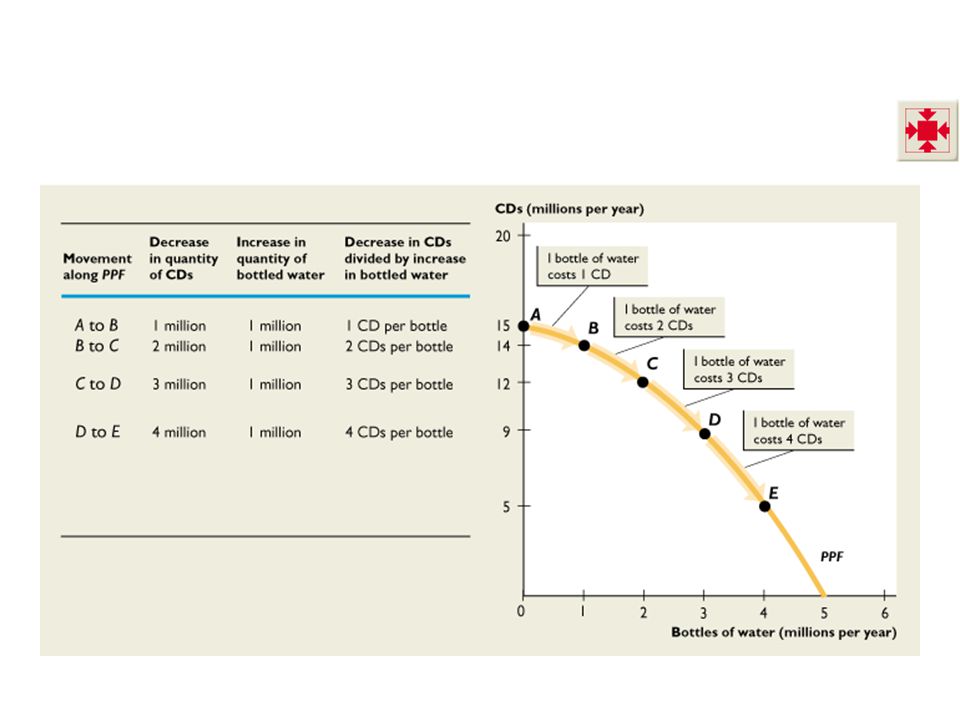
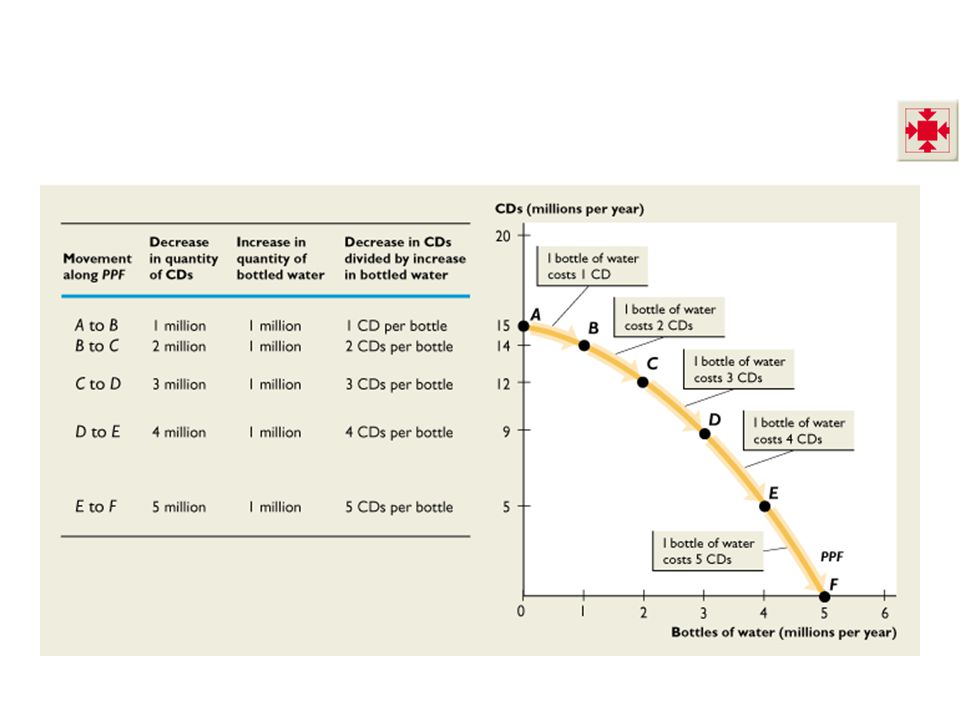
3.2 OPPORTUNITY COST The Opportunity Cost of a Bottle of Water The opportunity cost of a bottle of water is the decrease in the quantity of CDs divided by the increase in the number of bottles of water as we move along the PPF Figure 3.5 illustrates the calculation of the opportunity cost of a bottle of water.

17
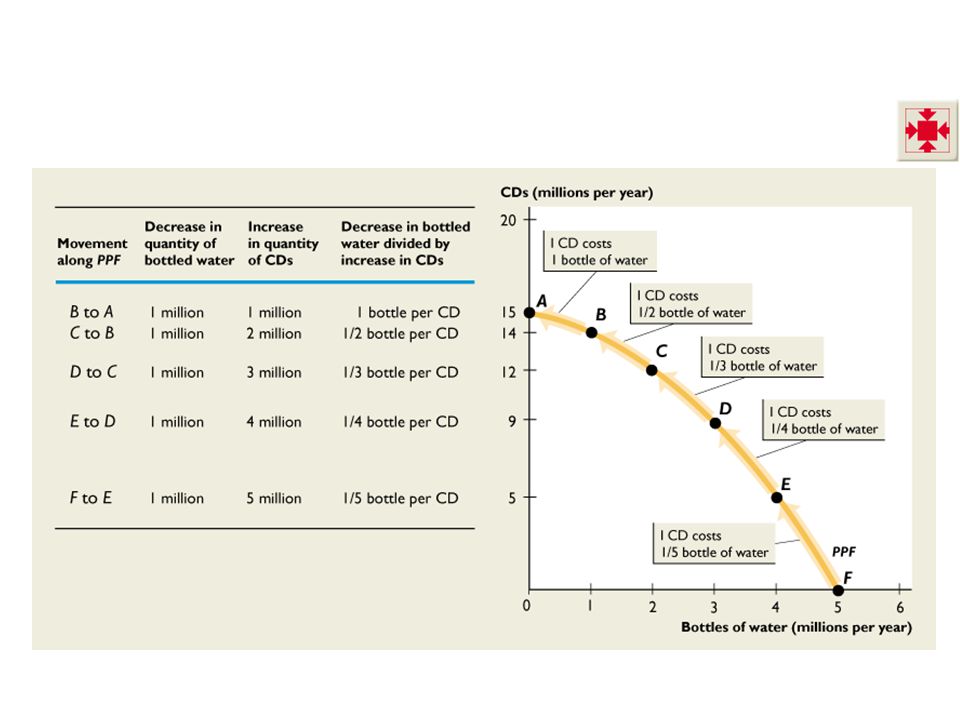
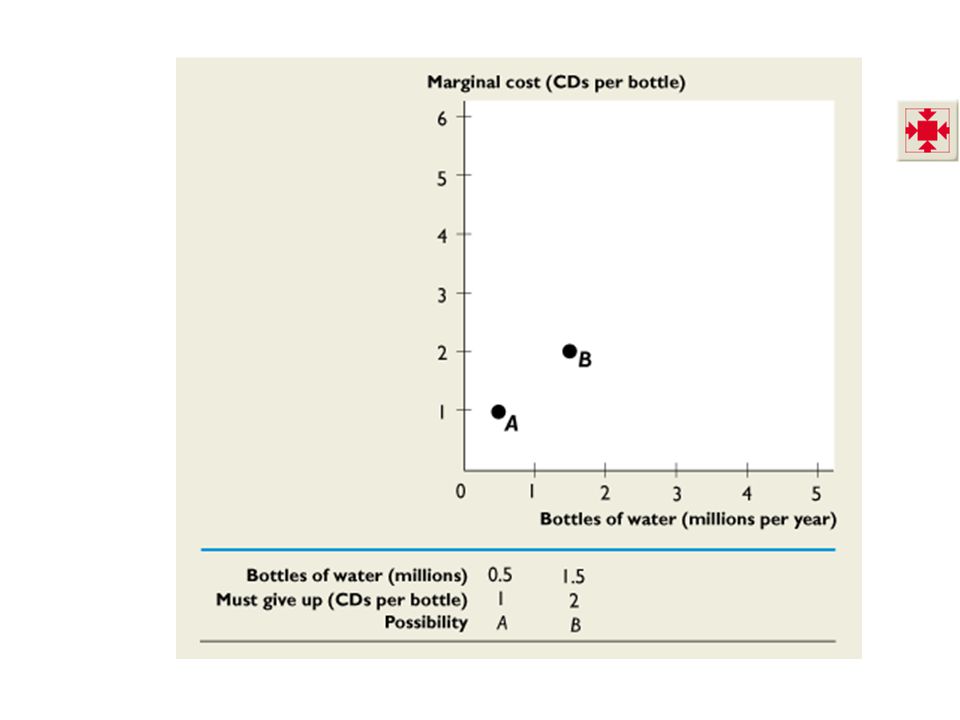
Moving from A to B, 1 bottle of water costs 1 CD. 3.2 OPPORTUNITY COST

19
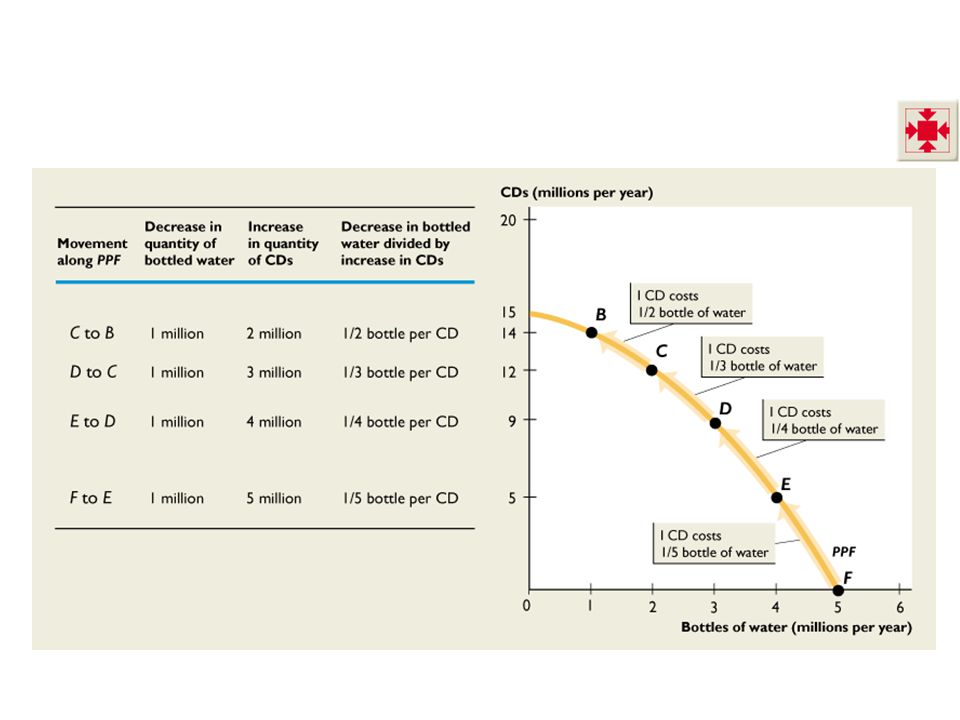
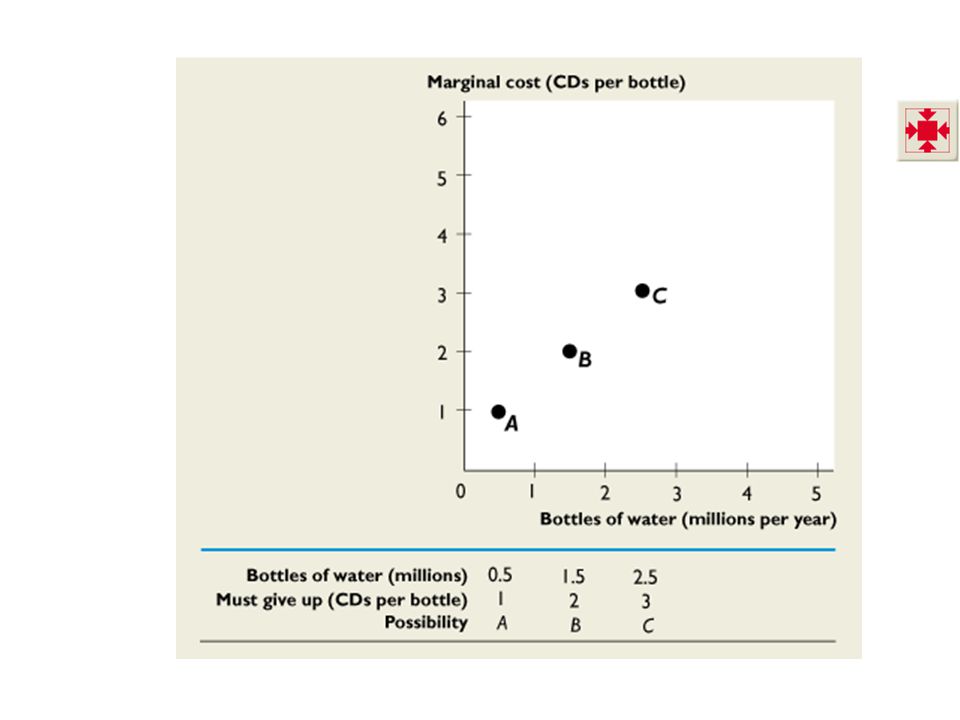
Moving from B to C, 1 bottle of water costs 2 CDs. 3.2 OPPORTUNITY COST

21
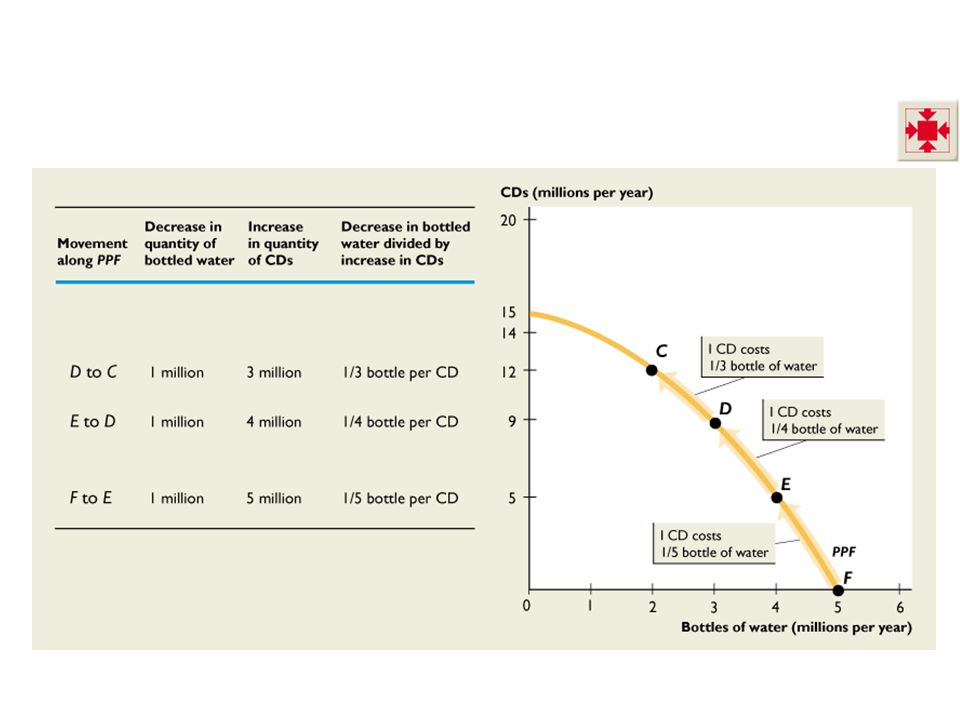
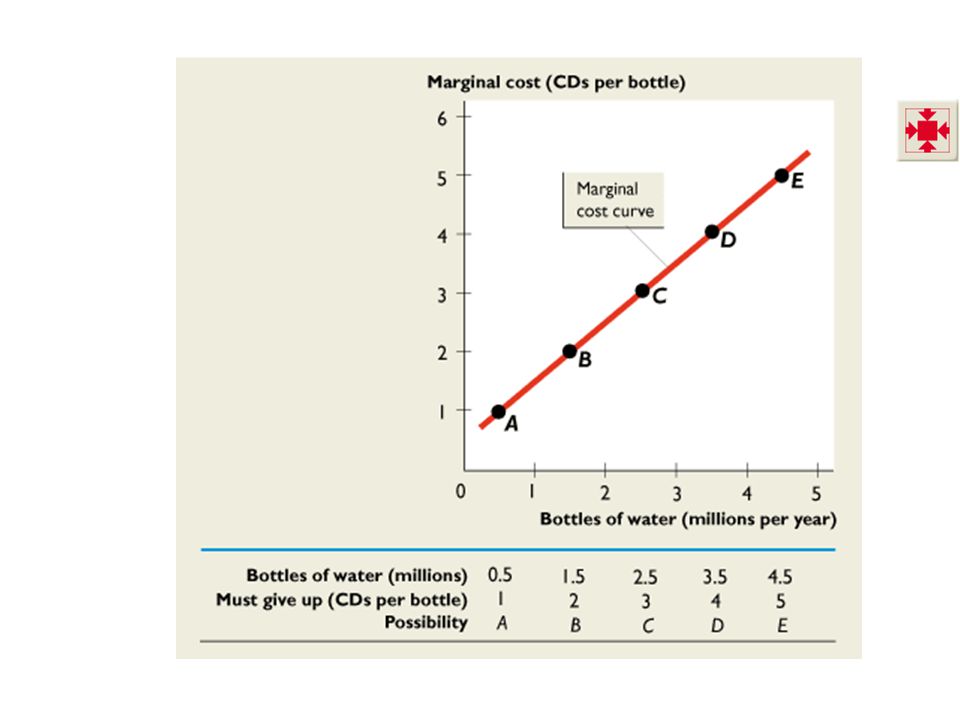
Moving from C to D, 1 bottle of water costs 3 CDs. 3.2 OPPORTUNITY COST

23
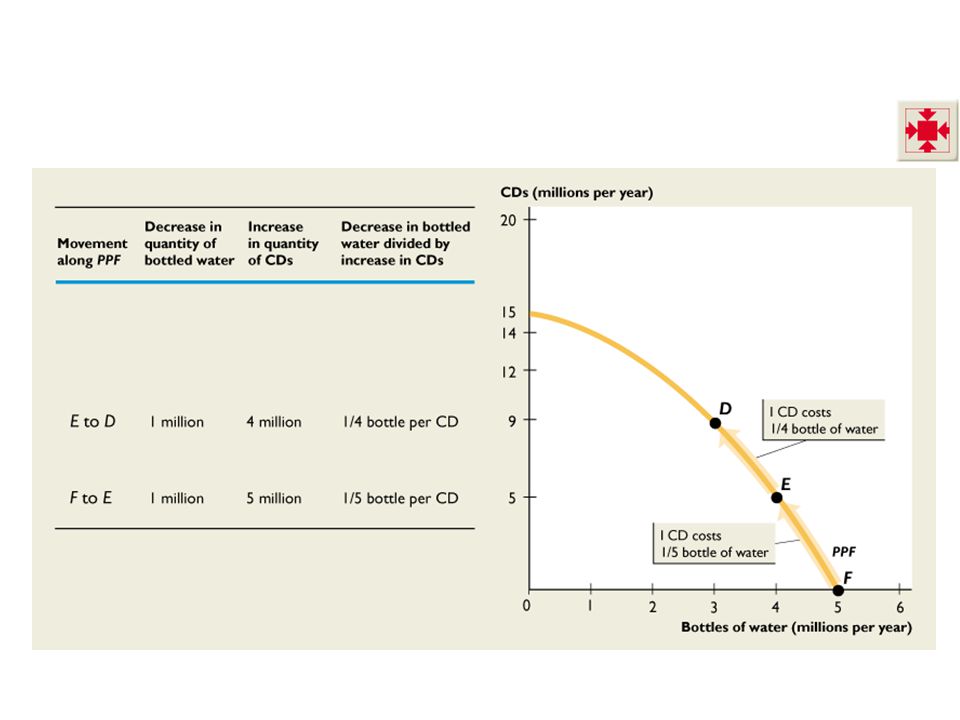
Moving from D to E, 1 bottle of water costs 4 CDs. 3.2 OPPORTUNITY COST

25
Moving from E to F, 1 bottle of water costs 5 CDs. 3.2 OPPORTUNITY COST

27
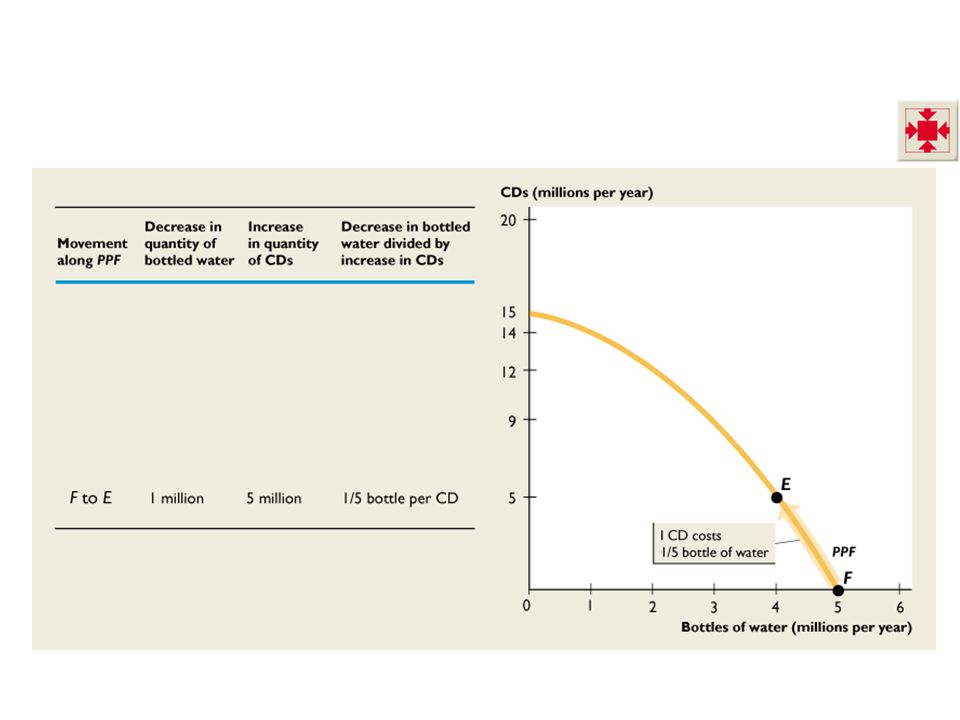
The Opportunity Cost of a CD The opportunity cost of a CD is the decrease in the quantity of bottles of water divided by the increase in the quantity of CDs as we move along the PPF. Figure 3.6 illustrates the calculation of the opportunity cost of a CD.

28
Moving from F to E, the 1 CD costs 1/5 of a bottle of water. 3.2 OPPORTUNITY COST

30
Moving from E to D, the 1 CD costs 1/4 of a bottle of water.

32
3.2 OPPORTUNITY COST Moving from D to C, the 1 CD costs 1/3 of a bottle of water.

34
3.2 OPPORTUNITY COST Moving from C to B, the 1 CD costs 1/2 of a bottle of water.

36
3.2 OPPORTUNITY COST Moving from B to A, the 1 CD costs 1 of a bottle of water.

38
3.2 OPPORTUNITY COST Opportunity Cost Is a Ratio The opportunity cost of a bottle of water is the quantity of CDs forgone divided by the increase in the quantity of water. The opportunity cost of a CD is the quantity of bottled water forgone divided by the increase in the quantity of CDs. When the opportunity cost of a bottle of water is x CDs, the opportunity cost of a CD is 1/x bottles of water.

39
3.2 OPPORTUNITY COST Increasing Opportunity Cost The opportunity cost of a bottle of water increases as the quantity of bottled water produced increases. The opportunity cost of a CD increases as the quantity of CDs produced increases. The shape of the PPF is bowed outward because opportunity cost increase.

40
3.2 OPPORTUNITY COST Increasing Opportunity Costs Are Everywhere Just about every activity that you can think of is one with an increasing opportunity cost.

41
3.3 USING RESOURCES EFFICIENTLY Efficiency A situation in which the quantities of goods and services produced are those that people value most highly. Resource use is efficient when we cannot produce more of a good or service without giving up some of another good or service that people value more highly.

42
3.3 USING RESOURCES EFFICIENTLY Two Conditions for Efficiency Production efficiency Allocative efficiency Production efficiency A situation in which we cannot produce more of one good or service without producing less of some other good or service—production is at a point on the PPF. Allocative efficiency The combination of goods and services on the PPF that we value most highly.

43
3.3 USING RESOURCES EFFICIENTLY Marginal Benefit The benefit that a person receives from consuming one more unit of a good or service. Marginal Benefit Schedule and Curve The marginal benefit from a bottle of water is the number of CDs that people are willing to forgo to get one more bottle of water. Marginal benefit decreases as more bottled water is available.

44
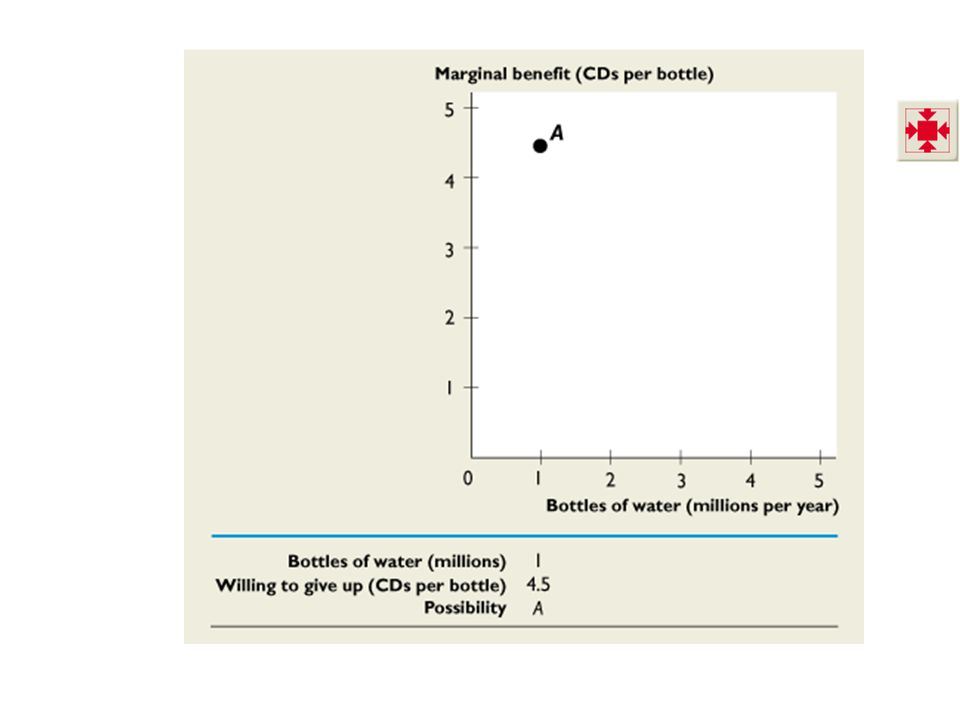
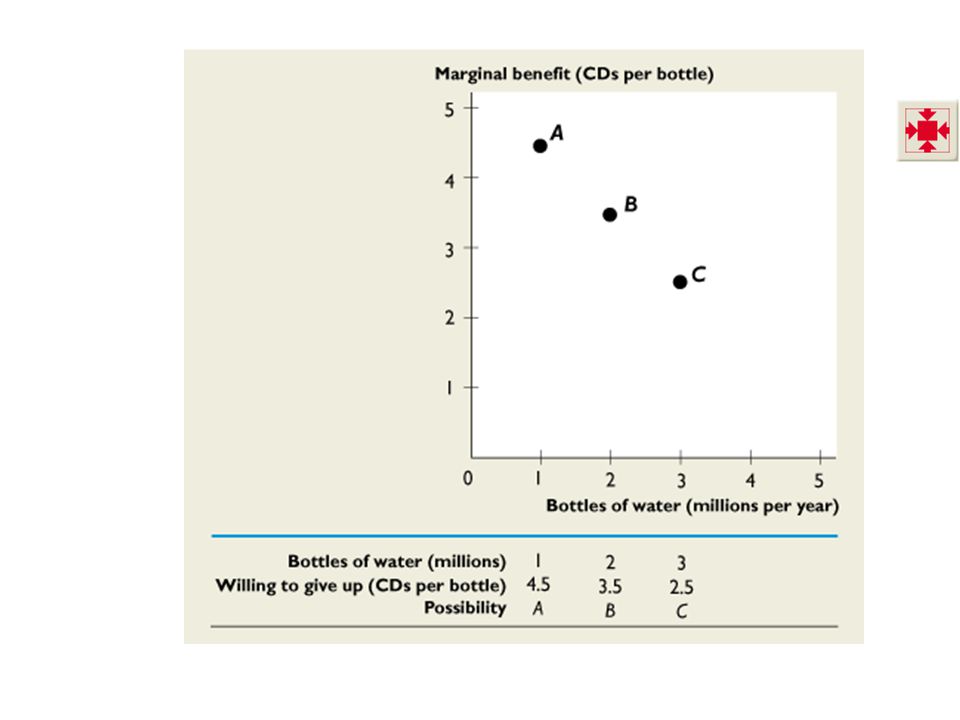
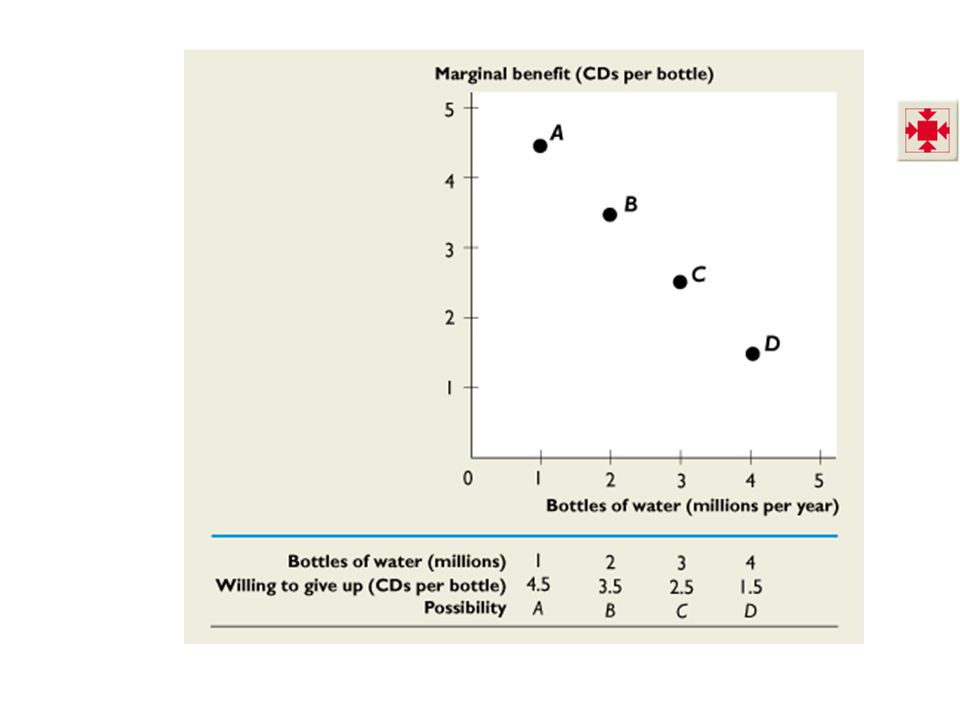
Point A tells us that if we produce 1 million bottles of water a year, the maximum quantity of CDs that people are willing to give up for an additional bottle of water is 4.5 CDs. 3.3 USING RESOURCES EFFICIENTLY

46
Point B tells us that if we produce 2 million bottles of water a year, the maximum quantity of CDs that people are willing to give up for an additional bottle of water is 3.5 CDs. 3.3 USING RESOURCES EFFICIENTLY

48
Point C tells us that if we produce 1 million bottles of water a year, the maximum quantity of CDs that people are willing to give up for an additional bottle of water is 2.5 CDs. 3.3 USING RESOURCES EFFICIENTLY

50
Point D tells us that if we produce 1 million bottles of water a year, the maximum quantity of CDs that people are willing to give up for an additional bottle of water is 1.5 CDs. 3.3 USING RESOURCES EFFICIENTLY

52
The marginal benefit curve passes through points A, B, C, and D. 3.3 USING RESOURCES EFFICIENTLY

54
Marginal Cost The opportunity cost of producing one more unit of a good or service. The marginal cost of producing a good increases as more of the good is produced.

55
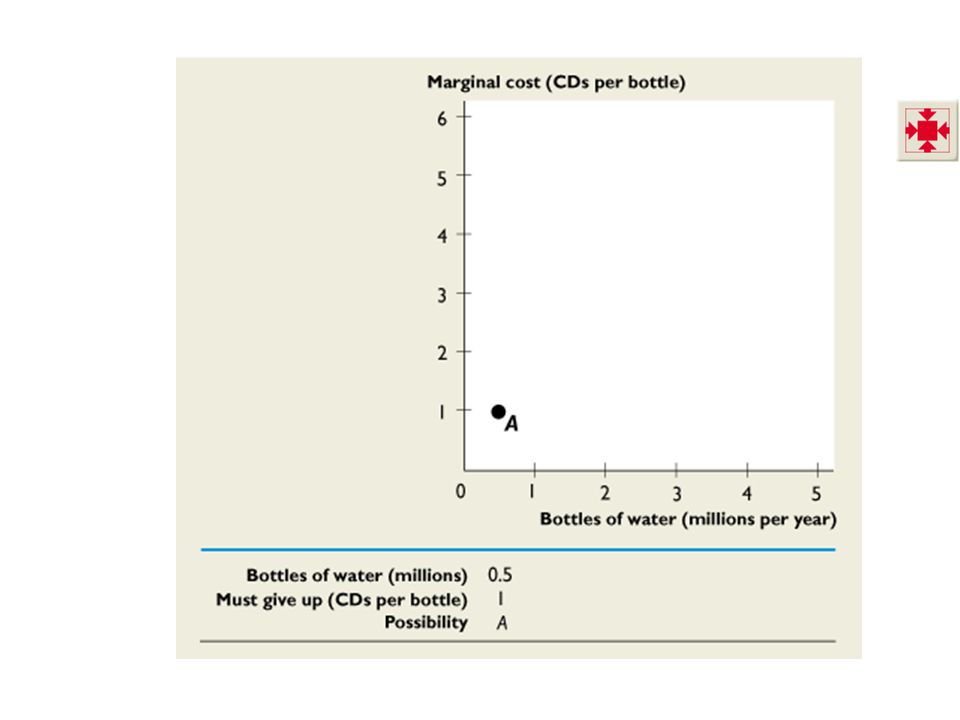
3.3 USING RESOURCES EFFICIENTLY To increase the quantity of water from 0 to 1 million bottles, we must forgo 1 million CDs. The marginal cost a 1 bottle of water is 1CD and marginal cost is plotted at the mid-point —0.5 million bottles.

57
3.3 USING RESOURCES EFFICIENTLY To increase the quantity of water from 1 to 2 million bottles, we must forgo 2 million CDs. The marginal cost a 1 bottle of water is 2 CDs and marginal cost is plotted at the mid-point —1.5 million bottles.

59
3.3 USING RESOURCES EFFICIENTLY To increase the quantity of water from 2 to 3 million bottles, we must forgo 3 million CDs. The marginal cost a 1 bottle of water is 3 CDs and marginal cost is plotted at the mid-point —2.5 million bottles.

61
3.3 USING RESOURCES EFFICIENTLY To increase the quantity of water from 3 to 4 million bottles, we must forgo 4 million CDs. The marginal cost a 1 bottle of water is 4 CDs and marginal cost is plotted at the mid-point —3.5 million bottles.

63
3.3 USING RESOURCES EFFICIENTLY To increase the quantity of water from 4 to 5 million bottles, we must forgo 5 million CDs. The marginal cost a 1 bottle of water is 5 CDs and marginal cost is plotted at the mid-point —4.5 million bottles.

65
3.3 USING RESOURCES EFFICIENTLY The line through points A, B, C, D, and E is the marginal cost curve.

67
3.3 USING RESOURCES EFFICIENTLY Efficient Use of Resources Resource use is efficient when we produce the goods and services that we value the most highly. That is, when we are using our resources efficiently, we cannot produce more of any good without producing less of something else that we value even more highly Figure 3.9 on the next slide shows the efficient quantity of bottled water.

68
1. Production efficiency occurs at all points on the PPF. Allocative efficiency occurs at the intersection of the marginal benefit curve (MB) and the marginal cost curve (MC). 3.3 USING RESOURCES EFFICIENTLY Only point B on the PPF is a point of allocative efficiency.
 and the marginal cost curve (MC). 3.3 USING RESOURCES EFFICIENTLY Only point B on the PPF is a point of allocative efficiency..")
70
2. With 1.5 million bottles, marginal benefit exceeds marginal cost, so the efficient quantity is larger. 3.3 USING RESOURCES EFFICIENTLY At point A on the PPF, too many CD are being produced. Increase the quantity of water by moving along the PPF.

72
3. With 3.5 million bottles, marginal cost exceeds marginal benefit, so the efficient quantity is smaller. 3.3 USING RESOURCES EFFICIENTLY At point C on the PPF, too much water is being produced. Decrease the quantity of water by moving along the PPF.

74
3.3 USING RESOURCES EFFICIENTLY Efficiency in the U.S. Economy Does our economy achieve an efficient use of resources? Do we have an efficient energy policy, or would a policy that favors clean-energy technologies be more efficient? Do we have an efficient method of urban transportation, or would more mass transit systems be more efficient?

75
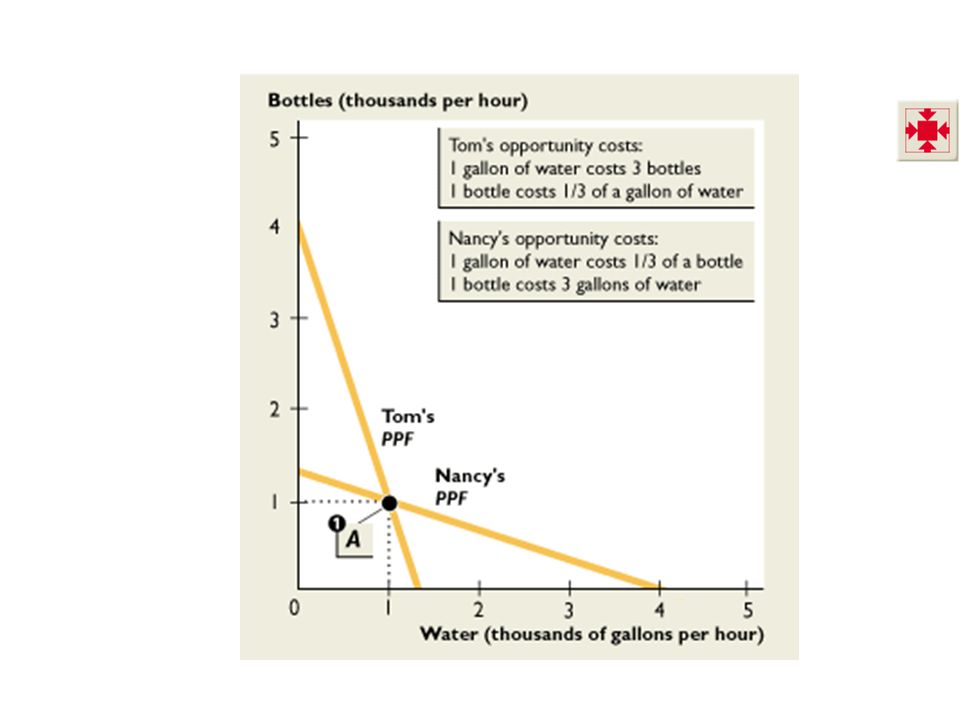
3.4 SPECIALIZATION AND EXCHANGE Comparative Advantage Comparative advantage The ability of a person to perform an activity or produce a good or service at a lower opportunity cost than someone else. Both Tom and Nancy produce bottles and water, but their opportunity costs differ.

76
Tom’s opportunity cost of 1 gallon of water is 3 bottles. Tom’s opportunity cost of 1 bottle is 1/3 of a gallon of water. 3.4 SPECIALIZATION AND EXCHANGE

78
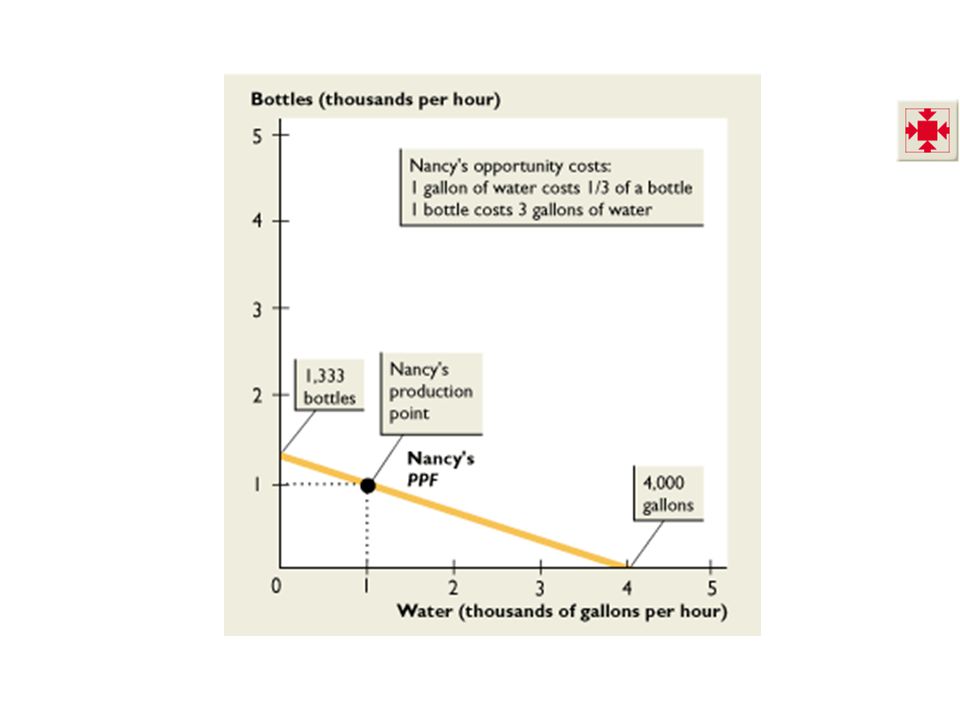
Nancy’s opportunity cost of 1 gallon of water is 1/3 of a bottle. Nancy’s opportunity cost of 1 bottle is 3 gallons of water. 3.4 SPECIALIZATION AND EXCHANGE

80
1. Tom and Nancy each produce at point A on their PPFs. Tom’s opportunity cost of bottles is less than Nancy’s: He has a comparative advantage in producing bottles. 3.4 SPECIALIZATION AND EXCHANGE Nancy’s opportunity cost of water is less than Tom’s: She has a comparative advantage in producing water.

82
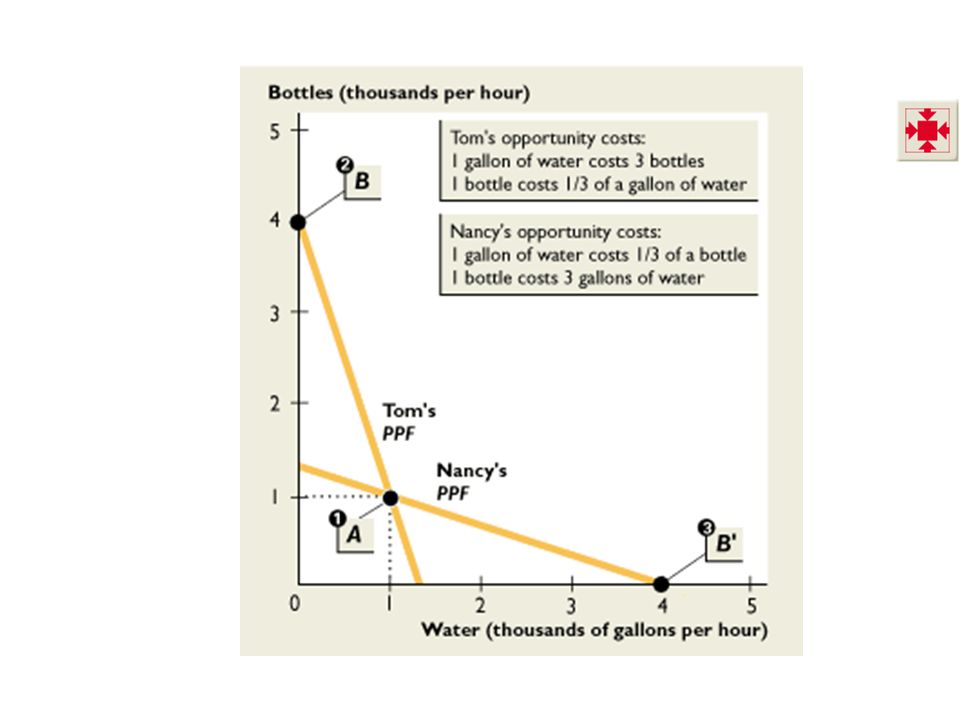
Tom and Nancy specialize in producing the good in which they have a comparative advantage. 3. Nancy produces water at point B′ on her PPF. 3.4 SPECIALIZATION AND EXCHANGE 2. Tom produces bottles at point B on his PPF.

84
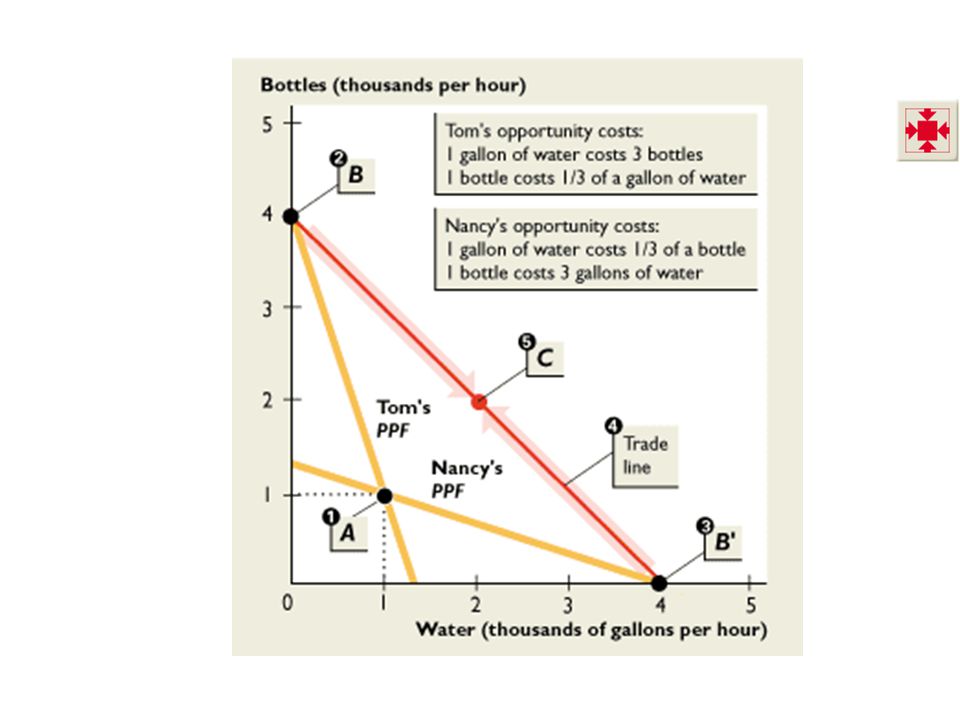
4. Tom and Nancy exchange goods along the red trade line. Nancy produces 4,000 gallons of water and buys bottles from Tom. 3.4 SPECIALIZATION AND EXCHANGE Tom produces 4,000 bottles and buys water from Nancy. 5. Both consume at point C, which is outside their PPFs.

86
3.4 SPECIALIZATION AND EXCHANGE Achieving the Gains from Trade By specializing and trading with each other: Tom doubles his production from 1,000 to 2,000 bottles of water an hour. Nancy doubles her production from 1,000 to 2,000 bottles of water an hour. Each gains 1,000 bottles of water as a result of the specialization and exchange. Both consume outside their PPFs.

87
3.4 SPECIALIZATION AND EXCHANGE Absolute Advantage Absolute advantage When one person is more productive than another person in several or even all activities. Gain from specialization and trade are determines by comparative advantage, not absolute advantage. Comparative advantage results from opportunity costs that diverge. So when opportunity costs diverge, gains from specialization and trade are always available.

Similar presentations