Download presentation
Presentation is loading. Please wait.

2
3 The Economic Problem Notes and teaching tips: 5, 6, 17, and 32.
CHAPTER Notes and teaching tips: 5, 6, 17, and 32. To view a full-screen figure during a class, click the red “expand” button. To return to the previous slide, click the red “shrink” button. To advance to the next slide, click anywhere on the full screen figure.

3
C H A P T E R C H E C K L I S T When you have completed your study of this chapter, you will be able to 1 Explain and illustrate the concepts of scarcity, production efficiency, and tradeoff using the production possibilities frontier. 2 Calculate opportunity cost. 3 Explain what makes production possibilities expand. 4 Explain how people gain from specialization and trade.

4
3.1 PRODUCTION POSSIBILITIES
Production Possibilities Frontier Production possibilities frontier The boundary between the combinations of goods and services that can be produced and the combinations that cannot be produced, given the available factors of production and the state of technology. The PPF is a valuable tool for illustrating the effects of scarcity and its consequences.

5
3.1 PRODUCTION POSSIBILITIES
Figure 3.1 shows the PPF for cell phones and DVDs. Each point on the graph represents a column of the table. Get the students to realize how useful even a simple economic model, such as the PPF model, is for helping us understand and interpret important political events in history. For instance, the PPF model can be used to analyze real-world events such as an “Arms Race” between nations. Draw a PPF for military goods and civilian goods production. Then draw another PPF for a country that is about twice the size of the first, but with the same degree of concavity as the PPF for the first country. Now assume that each country considers the other as a mortal “enemy,” and that they engage in a costly arms race. Each country picks a point on the PPF that produces an equal level of military output in absolute terms. What would happen if the larger country decided to increase military production? Emphasize that while the distance on the military output axis at the point of production is equal for both countries, the resulting distance on the civilian output axis is (by definition) a smaller quantity for the smaller country. The large country can create significant economic and political pressures on the government of the small country by forcing the small country to match the increase in military production. The PPF reveals how much more additional civilian output is forgone by the citizens of the small economy relative to the citizens of the larger economy. Emphasize also that the opportunity cost of civilian goods is higher for the smaller country. What were the economic repercussions of the Cold War? History and political science majors quickly perceive that these two PPF models reflect the Cold War relationship between the United States and the U.S.S.R. during the early 1980s. The Reagan administration increased U.S. military expenditures during the early 1980s to a post-Vietnam War peak of 6.6 percent of GDP (as compared to about 3.5 percent of GDP in the late 1990s). Many experts agree that this strategy contributed to the many political and economic pressures that ultimately lead to the dissolution of the U.S.S.R. The line through the points is the PPF.
 a smaller quantity for the smaller country. The large country can create significant economic and political pressures on the government of the small country by forcing the small country to match the increase in military production. The PPF reveals how much more additional civilian output is forgone by the citizens of the small economy relative to the citizens of the larger economy. Emphasize also that the opportunity cost of civilian goods is higher for the smaller country. What were the economic repercussions of the Cold War History and political science majors quickly perceive that these two PPF models reflect the Cold War relationship between the United States and the U.S.S.R. during the early 1980s. The Reagan administration increased U.S. military expenditures during the early 1980s to a post-Vietnam War peak of 6.6 percent of GDP (as compared to about 3.5 percent of GDP in the late 1990s). Many experts agree that this strategy contributed to the many political and economic pressures that ultimately lead to the dissolution of the U.S.S.R. The line through the points is the PPF.")
6
“What are the implications for the next fifty years
“What are the implications for the next fifty years?” China is currently the world’s third largest economy. It is predicted to become the second in a few years and the biggest by mid century. Ask your students how does this development influence the strategic balance and the position of the United States? The PPF model can be used to analyze global environmental agreements between nations This application of the PPF is a less hawkish and perhaps a more green perspective on a timely international policy issue. Compare a rich economy’s PPF to a poor economy’s PPF, each with the same degree of concavity. The production levels are now measured as output per person and the goods are “cleaner air” and “other goods and services.” What if the citizens of each country were required to make equal reductions in per-person greenhouse gas emissions? Show an equal quantity increase in per person output on the clean air axis for both countries’ PPF curve. Show how the opportunity cost of requiring additional pollution reductions (cleaner air) of equal amounts per person is much greater for the citizens of a poorer country than for the citizens of the richer country. This fact has been used to try to persuade developed countries (like the United States) to accept larger pollution reduction targets than developing countries (like China, India, and the African nations).
 of equal amounts per person is much greater for the citizens of a poorer country than for the citizens of the richer country. This fact has been used to try to persuade developed countries (like the United States) to accept larger pollution reduction targets than developing countries (like China, India, and the African nations).")
7
3.1 PRODUCTION POSSIBILITIES
The PPF puts three features of production possibilities in sharp focus: Attainable and unattainable combinations Efficient and inefficient production Tradeoffs and free lunches

8
3.1 PRODUCTION POSSIBILITIES
Attainable and Unattainable Combinations Because the PPF shows the limits to production, it separates attainable combinations from unattainable ones. Figure 3.2 on the next slide illustrates the attainable and unattainable combinations.

9
3.1 PRODUCTION POSSIBILITIES
We can produce at any point inside the PPF or on the frontier. We cannot produce at any point outside the PPF such as point G. The PPF separates attainable combinations from unattainable combinations.

11
3.1 PRODUCTION POSSIBILITIES
Efficient and Inefficient Production Production efficiency is a situation in which we cannot produce more of one good or service without producing less of something else. Figure 3.3 on the next slide illustrates the distinction between efficient and inefficient production.

12
3.1 PRODUCTION POSSIBILITIES
1. When production is on the PPF, such as at point E or D, production is efficient. 2. If production were inside the PPF, such as at point H, more could be produced of both goods without forgoing either good. Production is inefficient.

14
3.1 PRODUCTION POSSIBILITIES
Tradeoffs and Free Lunches A tradeoff is an exchange—giving up one thing to get something else. A free lunch is a gift—getting something without giving up something else. Figure 3.3 on the next slide illustrates the distinction between a tradeoff and a free lunch.

15
3.1 PRODUCTION POSSIBILITIES
3. When production is on the PPF, we face a tradeoff. 4. If production were inside the PPF, there would be a free lunch. Moving from point H to point D does not involve a tradeoff.

17
The Opportunity Cost of a Cell Phone
The opportunity cost of a cell phone is the decrease in the quantity of DVDs divided by the increase in the number of cell phones as we move along the PPF. Figure 3.4 illustrates the calculation of the opportunity cost of a cell phone. Students almost instinctively relate costs to monetary costs. To help them grasp the idea of opportunity cost while moving along the PPF, it is important to get students to realize very early on that thinking only of monetary costs is a narrow view and that it ignores the most important cost of all—opportunity cost. Demonstrate the fact that that opportunity cost does not necessarily involve money by launching your lecture with an example that hits close to home. Ask your students to take a minute to write down a list of things that qualify as the opportunity cost to them of attending your economics class. Expect a fairly wide range of answers from the downright silly to the very thoughtful. Stress that the true opportunity cost of any endeavor is only the one next best alternative forgone. The reason is because you can only perform one other activity in place of whatever it is you are doing at present. In other words, you will need to convince your students that even though they have come up with a fairly long list of items, the opportunity cost of attending your economics class can only be one of them. This one is the one that will rank above the others as the next best available alternative. Here might be some possible answers: by taking economics your students cannot take biology, physics or chemistry; they might have to give up overtime at work (if they are taking a night class); or the cost could be the forgone extra sleep they could have enjoyed if they are taking an 8:00 a.m. class!
; or the cost could be the forgone extra sleep they could have enjoyed if they are taking an 8:00 a.m. class!")
18
3.2 OPPORTUNITY COST Moving from A to B, 1 cell phone costs 1 DVD.

19
3.2 OPPORTUNITY COST Moving from B to C, 1 cell phone costs 2 DVDs.

20
3.2 OPPORTUNITY COST Moving from C to D, 1 cell phone costs 3 DVDs.

21
3.2 OPPORTUNITY COST Moving from D to E, 1 cell phone costs 4 DVDs.

22
3.2 OPPORTUNITY COST Moving from E to F, 1 cell phone costs 5 DVDs.

24
Increasing Opportunity Cost
The opportunity cost of a cell phone increases as more cell phones are produced.

26
Slope of the PPF and Opportunity Cost
The magnitude of the slope of the PPF measures opportunity cost. The slope of the PPF in Figure 3.4 measures the opportunity cost of a cell phone. The PPF is bowed outward, as more water is produced, the PPF becomes steeper and the opportunity cost of a cell phone increases.

27
Opportunity Cost Is a Ratio
The opportunity cost of a cell phone is the quantity of DVDs forgone divided by the increase in the quantity of cell phones. The opportunity cost of a DVD is the quantity of cell phones forgone divided by the increase in the quantity of DVDs. When the opportunity cost of a cell phone is x DVDs, the opportunity cost of a DVD is 1/x cell phones.

28
Increasing Opportunity Costs Are Everywhere
Just about every activity that you can think of is one with an increasing opportunity cost.

29
3.3 ECONOMIC GROWTH If we produce at point J, we produce only cell-phone factories and no cell phones. If we produce at point L, we produce cell phones and no cell-phone factories. And every year, consumption remains at 5 million cell phones.

30
3.3 ECONOMIC GROWTH But if we cut production of cell phones to 3 million this year, we can produce 2 cell-phone factories at point K. Then next year, our PPF shifts outward because we have more capital. We can consume at a point outside our original PPF, such as K'.

32
3.5 SPECIALIZATION AND TRADE
Comparative Advantage Comparative advantage is the ability of a person to perform an activity or produce a good or service at a lower opportunity cost than someone else. Joe and Liz operate smoothie bars and produce smoothies and salads. Comparative advantage and absolute advantage are concepts that give students trouble. It flies in the face of intuition to say that even though someone has the ability to produce something using fewer resources than someone else, nonetheless, it still pays for the two to trade. It is an especially difficult concept to grasp when you up the ante by saying that the same would still be true even if that person enjoyed an absolute advantage in everything over their trading partner! This might be a good opportunity to use a very concrete example that students should be able to compute right in the classroom. Lay out the following scenario: Assume Suzie, a computer consultant, is very good at repairing computers and also happens to be a very good house painter. In fact, she is so good that it turns out she is more productive at both things than her neighbor, Bob, who happens to paint houses for a living. To the right is a table that shows the amount of time it takes for Suzie and Bob to perform each of the two activities. In addition, let’s assume that Suzie and Bob earn $100 per computer repaired and Bob and Suzie earn $960 per house painted. Ask the students to compute the opportunity cost for Suzie and Bob repairing a computer and painting a house. The new table to the right contains the opportu54 nity costs. (To calculate these numbers, take Suzie’s opportunity cost of painting a house. In the 30 hours it takes her to paint a house, she could have repaired 15 computers, so the opportunity cost is 15 computers times $100 each.) It reveals that Suzie has the lower opportunity cost of repairing computers and Bob has the lower opportunity cost of painting houses. What this example demonstrates so powerfully is that a person can have an absolute disadvantage in everything, as is the case for Bob, but still manage to have a comparative advantage in an activity. Point out to students that this logic applies between individuals and also across cities, states, and nations
 It reveals that Suzie has the lower opportunity cost of repairing computers and Bob has the lower opportunity cost of painting houses. What this example demonstrates so powerfully is that a person can have an absolute disadvantage in everything, as is the case for Bob, but still manage to have a comparative advantage in an activity. Point out to students that this logic applies between individuals and also across cities, states, and nations.")
33
3.5 SPECIALIZATION AND TRADE
Liz's Smoothie Bar In an hour, Liz can produce either 40 smoothies or 40 salads. Liz's opportunity cost of producing 1 smoothie is 1 salad. Liz's opportunity cost of producing 1 salad is 1 smoothie. Each hour, Liz produces 20 smoothies and 20 salads.

34
3.5 SPECIALIZATION AND TRADE
Joe's Smoothie Bar In an hour, Joe can produce either 6 smoothies or 30 salads. Joe's opportunity cost of producing 1 smoothie is 5 salads. Joe's opportunity cost of producing 1 salad is 1/5 smoothie. Each hour, Joe's produces 5 smoothies and 20 salads.

35
3.5 SPECIALIZATION AND TRADE
Liz’s Absolute Advantage Absolute advantage is a situation in which one person is more productive than another person in several or even all activities. Liz is four times as productive as Joe—Liz can produce 20 smoothies and 20 salads an hour and Joe can produce only 5 smoothies and 5 salads an hour.

36
3.5 SPECIALIZATION AND TRADE
Liz’s Comparative Advantage Liz’s opportunity cost of a smoothie is 1 salad. Joe’s opportunity cost of a smoothie is 5 salads. Liz’s opportunity cost of a smoothie is less than Joe’s, so Liz has a comparative advantage in producing smoothies.

37
3.5 SPECIALIZATION AND TRADE
Joe’s Comparative Advantage Joe’s opportunity cost of a salad is 1/5 smoothie. Liz’s opportunity cost of a salad is 1 smoothie. Joe’s opportunity cost of a salad is less than Liz’s, so Joe has a comparative advantage in producing salads.

38
3.5 SPECIALIZATION AND TRADE
Achieving Gains from Trade Liz and Joe produce more of the good in which they have a comparative advantage: Liz produces 35 smoothies and 5 salads. Joe produces 30 salads.

39
3.5 SPECIALIZATION AND TRADE
Liz and Joe trade: Liz sells Joe 10 smoothies and buys 20 salads. Joe sells Liz 20 salads and buys 10 smoothies. After trade: Liz has 25 smoothies and 10 salads. Joe has 25 smoothies and 10 salads.

40
3.5 SPECIALIZATION AND TRADE
Gains from trade: Liz gains 5 smoothies and 5 salads an hour—she originally produced 20 smoothies and 20 salads. Joe gains 5 smoothies and 5 salads an hour—he originally produced 5 smoothies and 5 salads. Figure 3.10 on the next slide illustrates the gains from trade.

42
3.5 SPECIALIZATION AND TRADE
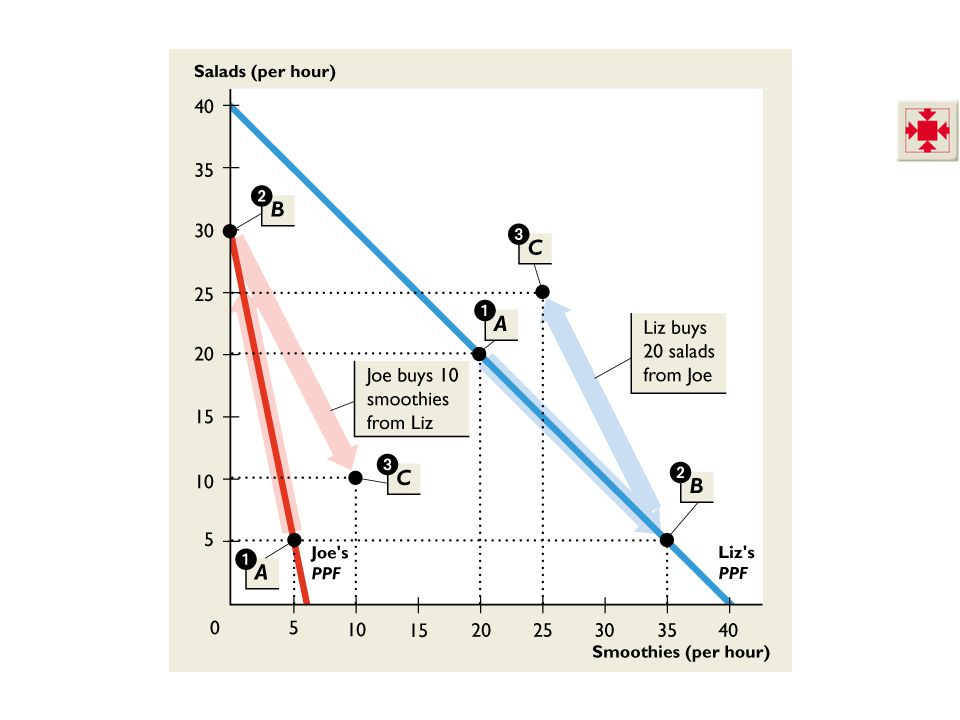
1. Joe and Liz each produce at point A on their PPFs. Joe has a comparative advantage in producing salads. Liz has a comparative advantage in producing smoothies.

43
3.5 SPECIALIZATION AND TRADE
Joe and Liz produce more of the good in which they have a comparative advantage. 2. Joe produces 30 salads at point B on his PPF. 2. Liz produces 35 smoothies and 5 salads at point B on her PPF.

44
3.5 SPECIALIZATION AND TRADE
Joe and Liz trade salads and smoothies at a price of 2 salads per smoothie. Joe sells 20 salads and buys 10 smoothies from Liz. Liz sells 10 smoothies and buys 5 salads from Joe. 3. Both consume at point C, which is outside their PPFs.

Similar presentations


 to perform an activity or produce a.>")


