Download presentation
Presentation is loading. Please wait.

1
Algorithms for Data Analytics Chapter 3

2
Plans Introduction to Data-intensive computing (Lecture 1) Statistical Inference: Foundations of statistics (Chapter 2) (Lecture 2) This week we will look at Algorithms for data analytics (Chapter 3) A Data Scientist: Stat (Ch.2) + Algorithms (Ch.3) + BigData (Lin&Dyer’s text) Uniqueness of this course Using the right tools and pre-existing libraries “creatively” (see Project 1) Statistical inference comes from statisticians (nothing new) Algorithms come from Computer Scientists (nothing new) Both area have taken a new meaning in the context of Big-data
 Statistical Inference: Foundations of statistics (Chapter 2) (Lecture 2) This week we will look at Algorithms for data analytics (Chapter 3) A Data Scientist: Stat (Ch.2) + Algorithms (Ch.3) + BigData (Lin&Dyer’s text) Uniqueness of this course Using the right tools and pre-existing libraries creatively (see Project 1) Statistical inference comes from statisticians (nothing new) Algorithms come from Computer Scientists (nothing new) Both area have taken a new meaning in the context of Big-data")
3
Data Analytics (Data Science) EDA Data Intuition/ understanding Big-data analytics Stats/Algs Discoveries/ intelligence Statistical Inference Decisions/ Answers/ Results * *
 EDA Data Intuition/ understanding Big-data analytics Stats/Algs Discoveries/ intelligence Statistical Inference Decisions/ Answers/ Results * *")
4
Three Types of Data Science Algorithms Pipelines (data flow) to prepare data Three types: 1.Data preparation algorithms such as sorting, MapReduce, and Pregel 2.Optimization algorithms stochastic gradient descent, least squares… 3.Machine learning algorithms…
 to prepare data Three types: 1.Data preparation algorithms such as sorting, MapReduce, and Pregel 2.Optimization algorithms stochastic gradient descent, least squares… 3.Machine learning algorithms…")
5
Machine Learning Algorithms Comes from Artificial Intelligence No underlying generative process Build to predict or classify something …. Read the very nice comparison on p.53 Three algorithms are discussed: linear regression, k-nn, k-means We will start with k-means…and move backwards Exclusive algorithms: what one can accomplish other(s) cannot
 cannot.")
6
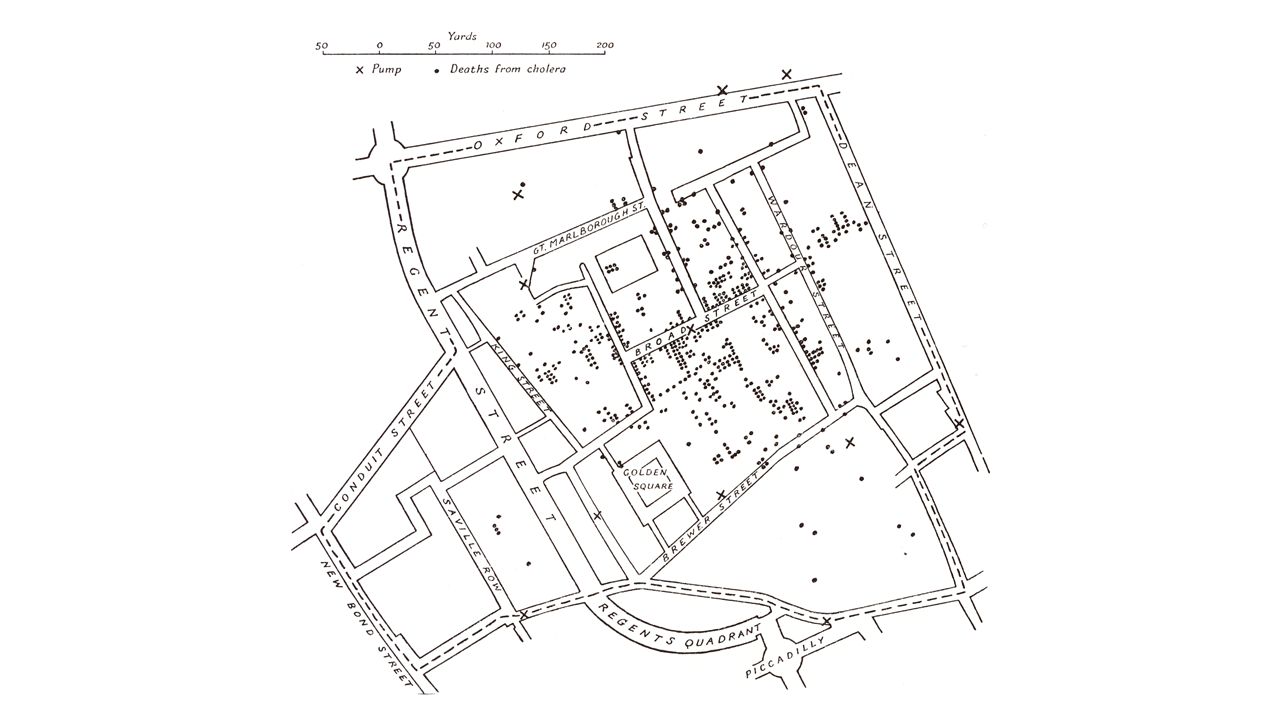
K-means K-means is unsupervised: no prior knowledge of the “right answer” Goal of the algorithm Is to determine the definition of the right answer by finding clusters of data Kind of data g+ data, survey data, medical data, SAT scores Assume data {age, gender, income, state, household, size}, your goal is to segment the users. Lets understand kmeans using an example. Also read about “birth of statistics” in John Snow’s classic study of Cholera epidemic in London 1854: “cluster” around Broadstreet pump: http://www.ph.ucla.edu/epi/snow.htmlhttp://www.ph.ucla.edu/epi/snow.html

8
K-NN K- nearest neighbor Supervised ML You know the “right answers” or at least data that is “labeled”: training set Set of objects have been classified or labeled (training set) Another set of objects are yet to be labeled or classified (test set) Your goal is to automate the processes of labeling the test set. Intuition behind k-NN is to consider most similar items --- similarity defined by their attributes, look at the existing label and assign the object a label.

9
K-NN Issues How many nearest neighbors? In other words what is the value of k Implications of small k and large k How do define similarity or closeness? Error rate or misclassification (k can chosen to lower this) Curse of dimensionality
 Curse of dimensionality.")
Similar presentations


 Biological Sequences Analysis, MTA.>")


 EDA Data Intuition/ understand ing Big-data analytics StatsAlgs Discoveries / intelligence Statistical Inference.>")
. Example of system for Data Analyzing based on neural networks.>")


