Download presentation
Presentation is loading. Please wait.

1
DaRTS Data Reporting Tool for Schools: Making Data Connections 2013 CSOTTE Fall Conference CREATE Center for Research, Evaluation and Advancement of Teacher Education

2
Consortium of 54 Texas Universities – Texas A&M University System – Texas State University System – University of Houston System – University of Texas System – Other Public Universities – Private Universities WHO WE ARE

3
WHAT WE DO ADVANCE THE QUALITY AND EFFECTIVENESS OF TEACHER PREPARATION PROGRAMS IN TEXAS UNIVERSITIES

4
OUR WORK Expand Knowledge Through Research Build Capacity for Institutional Change Initiate Action Through Programs

5
PACE Performance Analysis for Colleges of Education REPORTS FOR USE BY THE UNIVERSITY WITH AN EMPHASIS ON AREA PUBLIC SCHOOLS A Short History Public Schools School Listings School Demographics Enrollment Trends Achievement Trends University Teacher Production Teacher Certification Supply/Demand Teacher Employment Retention

6
DISTRICT DATA REPORTS Section I: Employment Trends Section II: Assignment Trends Section III: Retention Trends DaRTS Data Reporting Tool for Schools

7
SECTION I REPORTS Section I: Employment Trends All District Teachers Newly-Hired Teachers

8
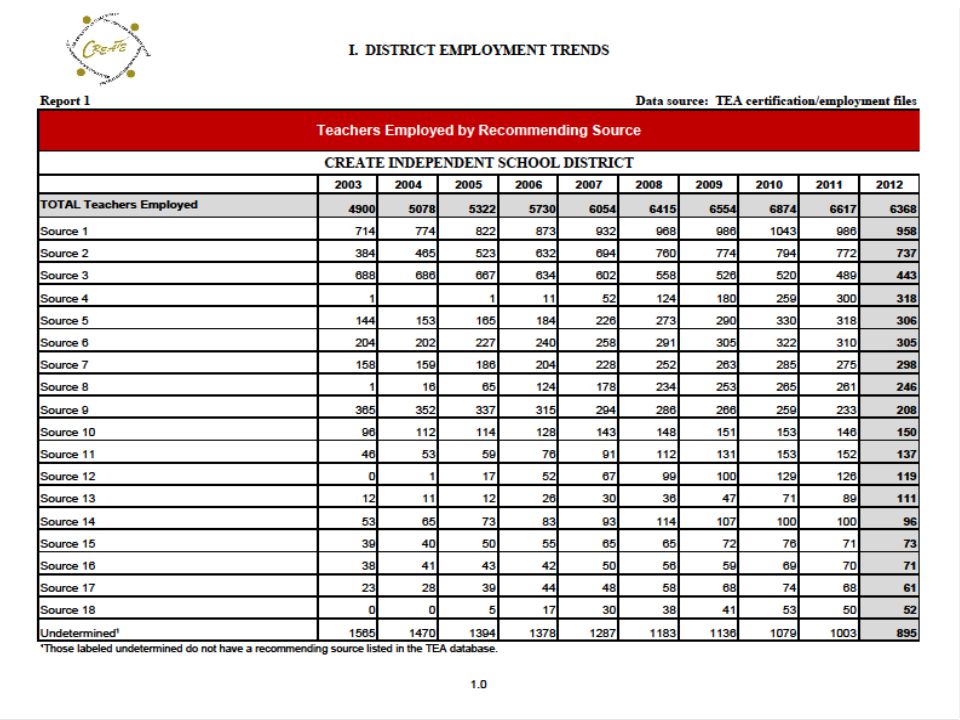
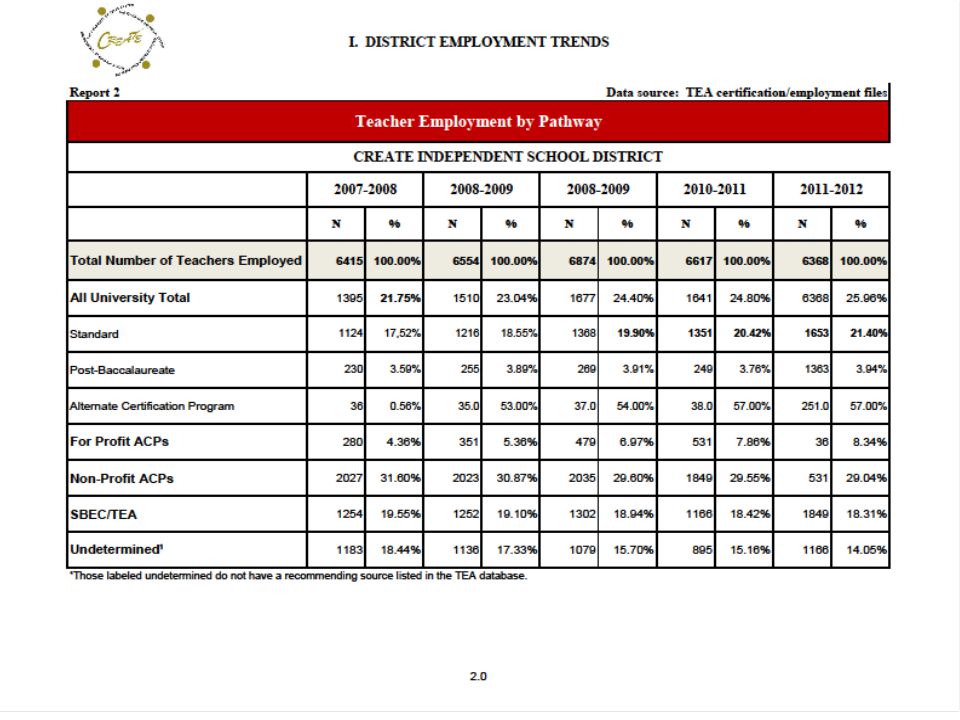
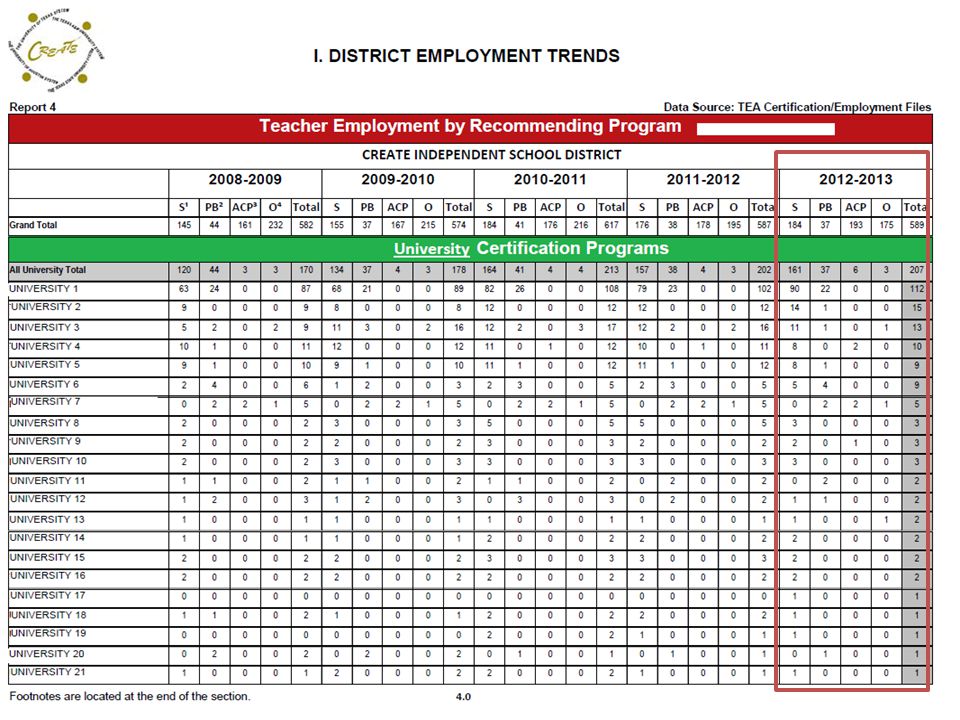
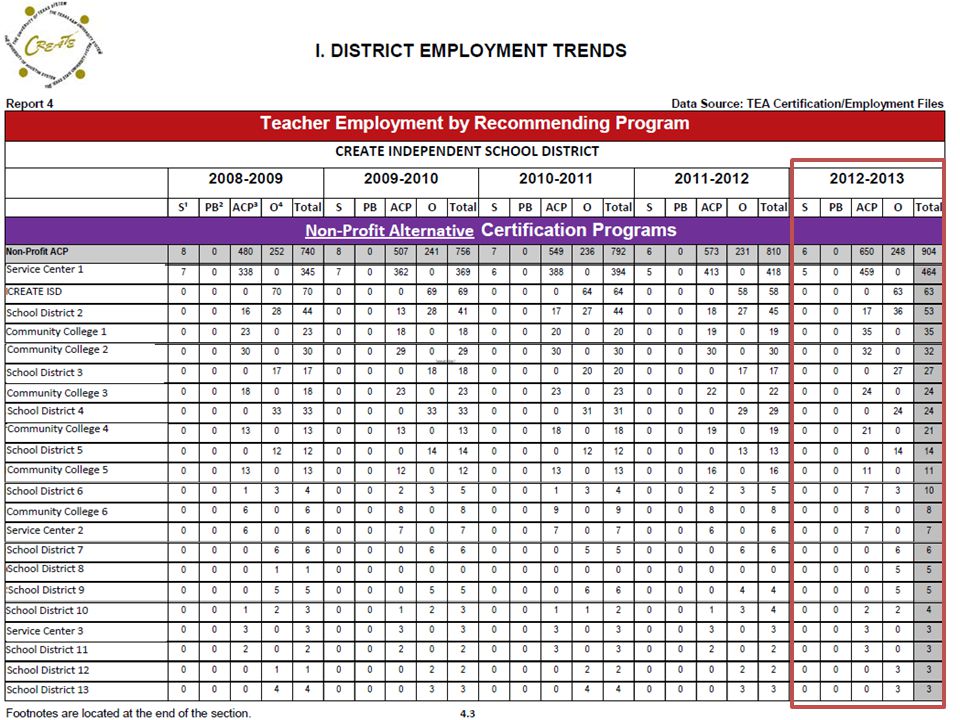
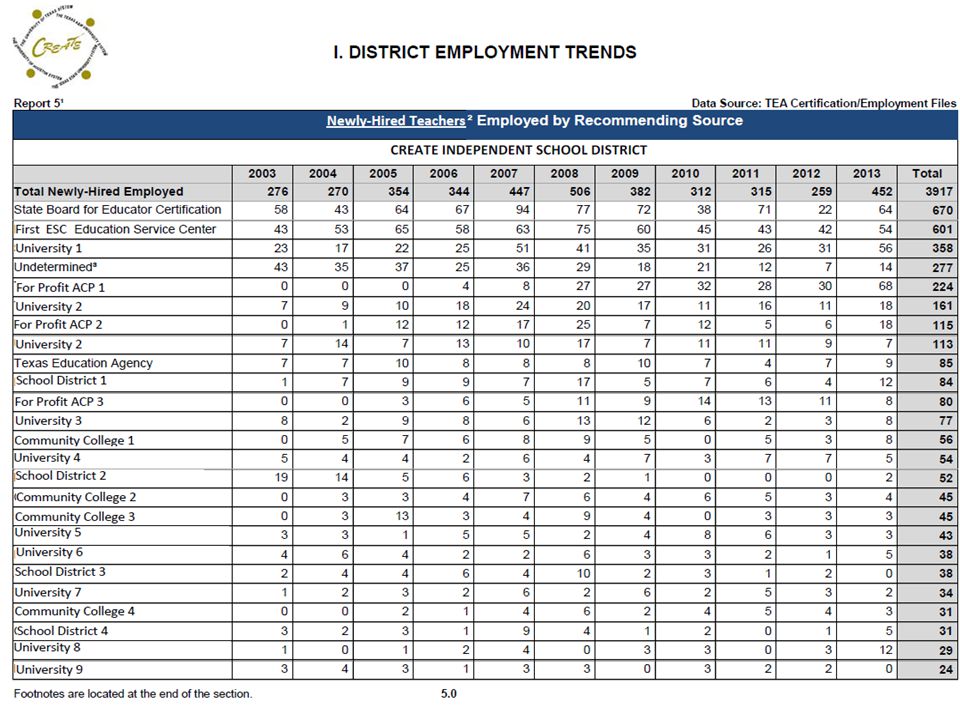
SECTION I: EMPLOYMENT TRENDS All District Teachers 1.Teachers Employed by Recommending Source 2.Teacher Employment by Certification Pathway 3.Campus-Level Teacher Employment by Pathway 4.Teacher Employment by Recommending Program

14
Section I: EMPLOYMENT TRENDS Newly-Hired District Teachers 5.Teachers Employed by Recommending Source 6.Teacher Employment by Certification Pathway 7.Campus-Level Teacher Employment by Pathway 8.Teacher Employment by Recommending Program

16
SECTION II: ASSIGNMENT TRENDS All District Teachers by Level Elementary School - Reports 9-12 Middle School - Reports 13-16 High School- Reports 17-20

17
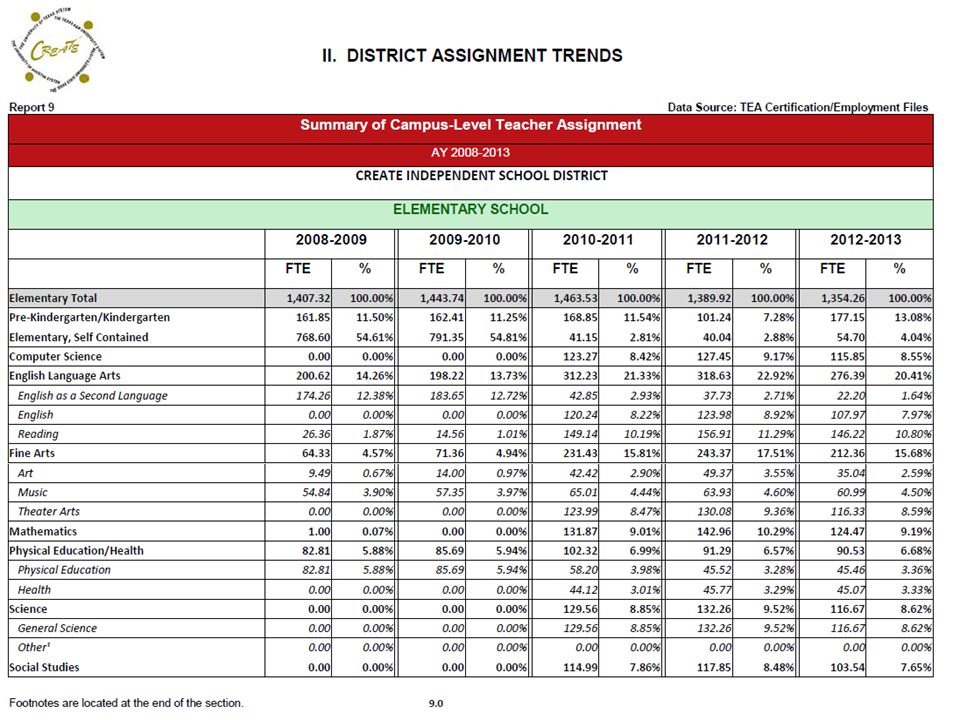
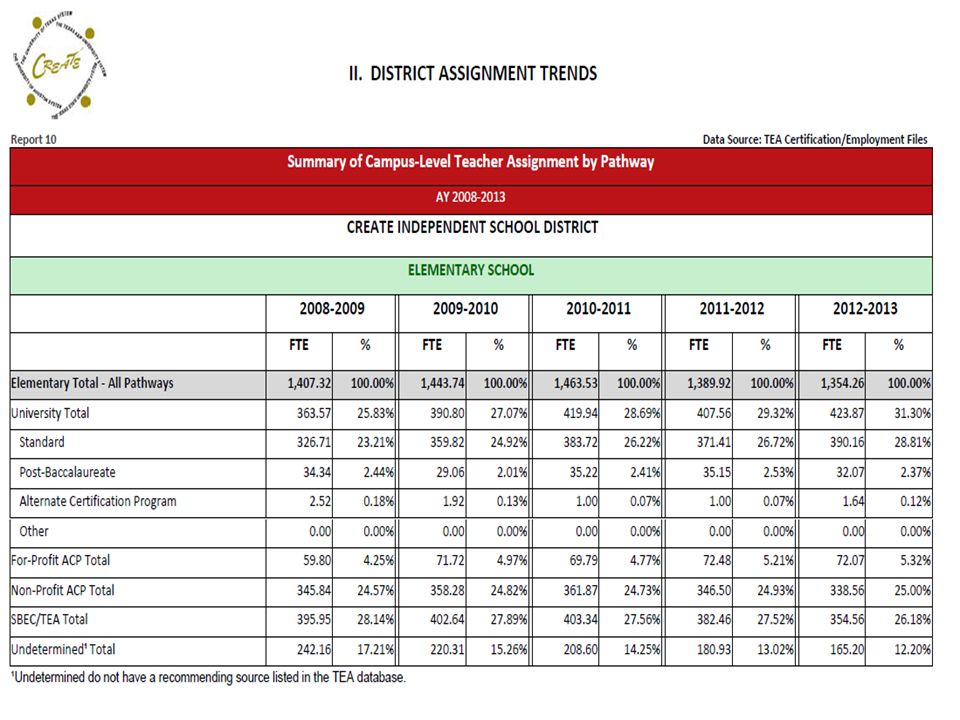
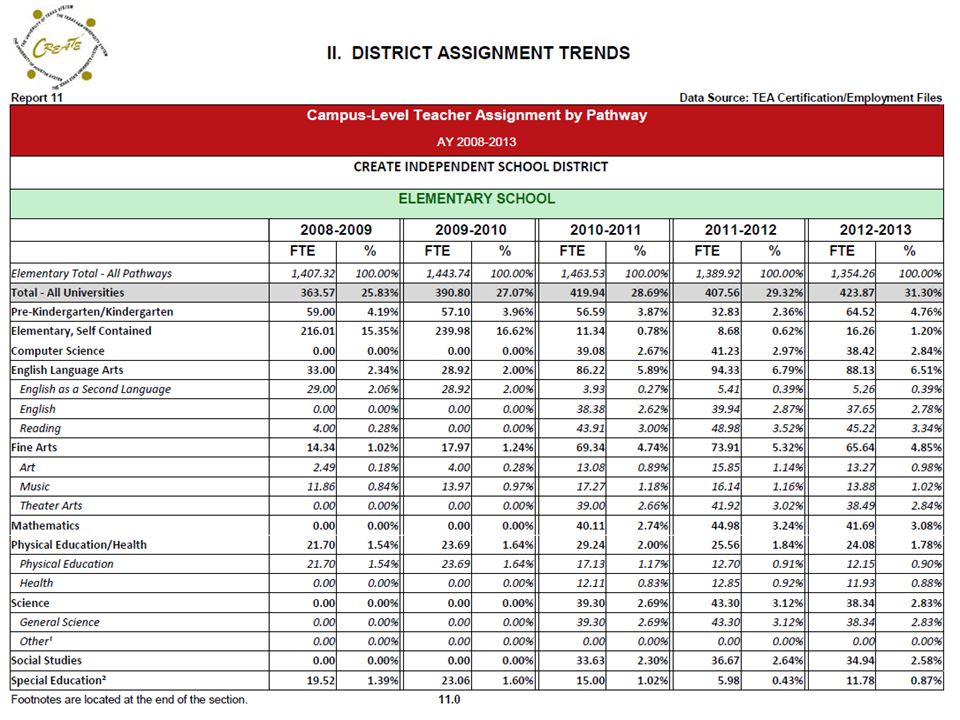
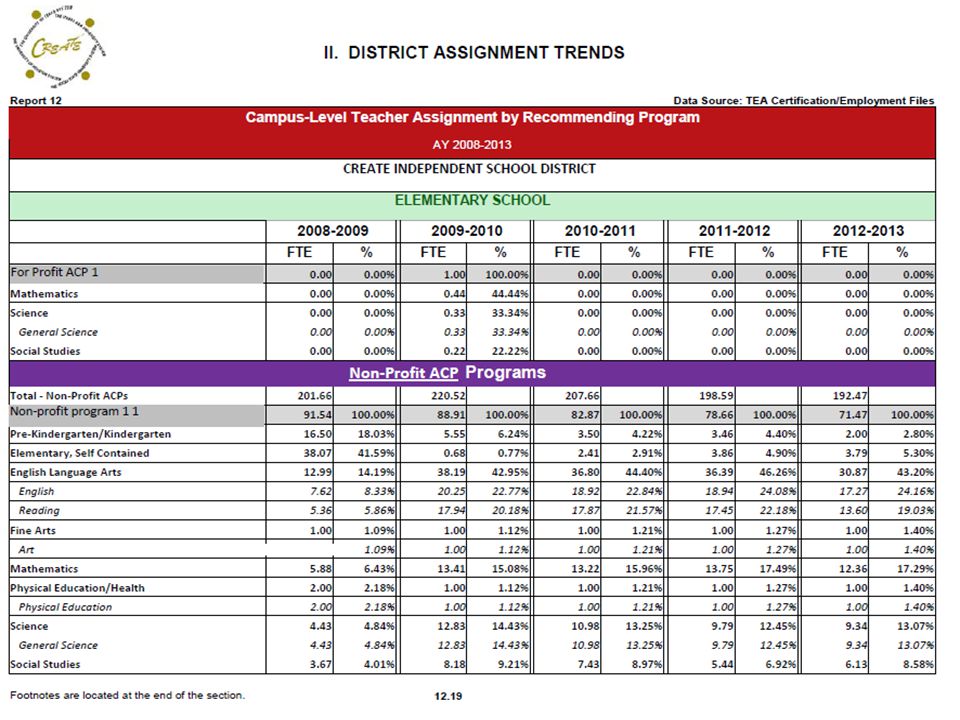
SECTION II: ASSIGNMENT TRENDS All District Teachers – Elementary School 9.Summary of Campus-Level Teacher Assignment 10.Summary of Campus-Level Teacher Assignment by Certification Pathway 11.Campus-Level Teacher Assignment by Pathway 12.Campus-Level Teacher Assignment by Recommending Program

22
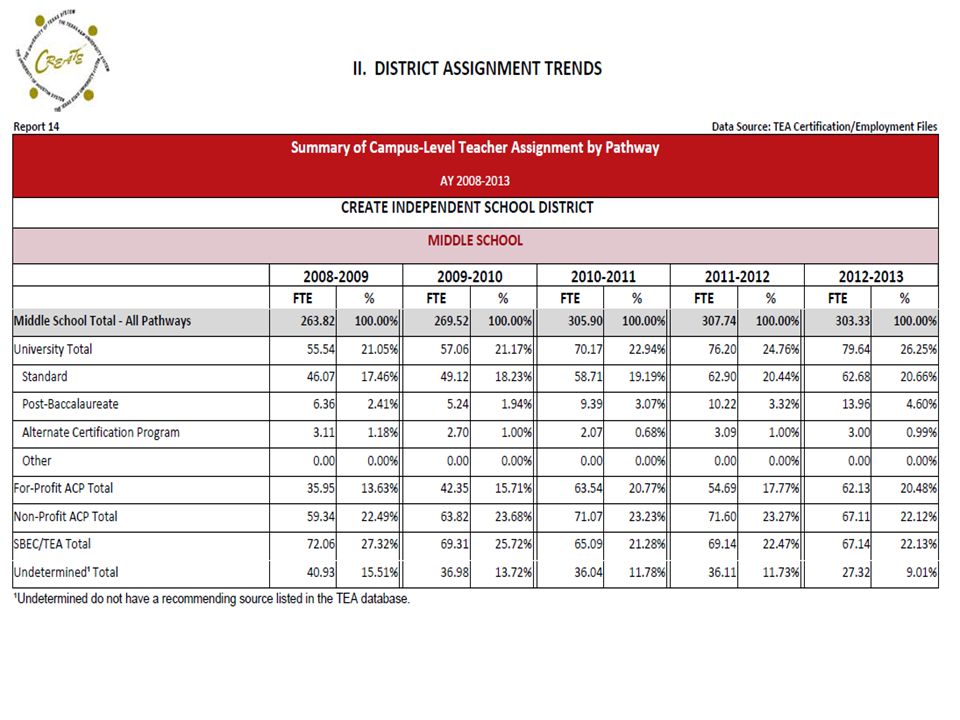
SECTION II: ASSIGNMENT TRENDS All District Teachers ̶ M S Reports 13-16 13.Summary of Campus-Level Teacher Assignment 14.Summary of Campus-Level Teacher Assignment by Certification Pathway 15.Campus-Level Teacher Assignment by Pathway 16.Campus-Level Teacher Assignment by Recommending Program

24
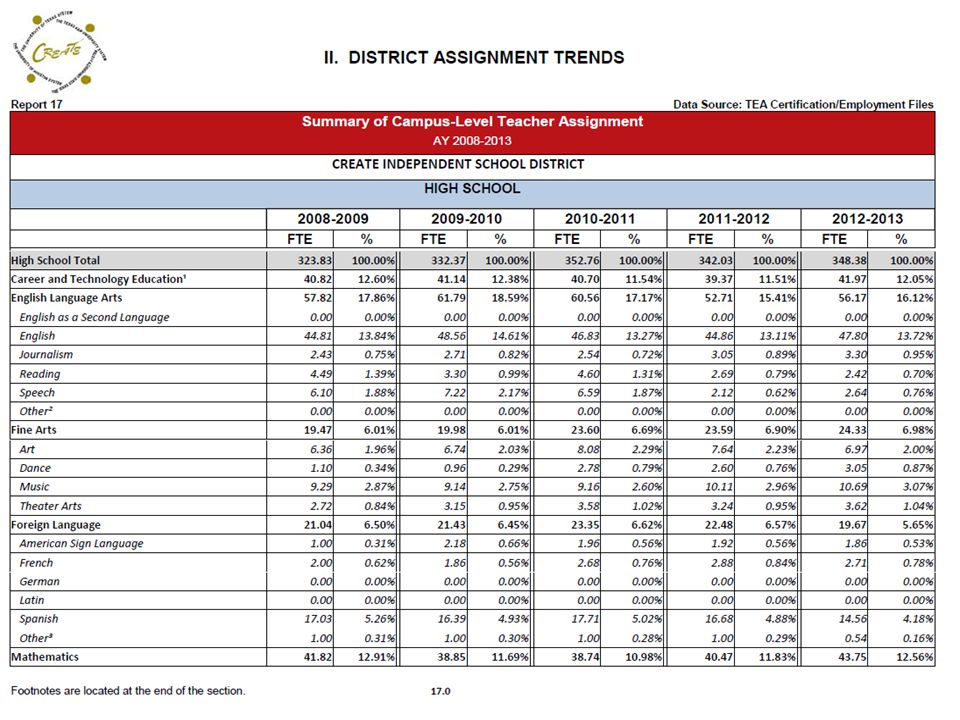
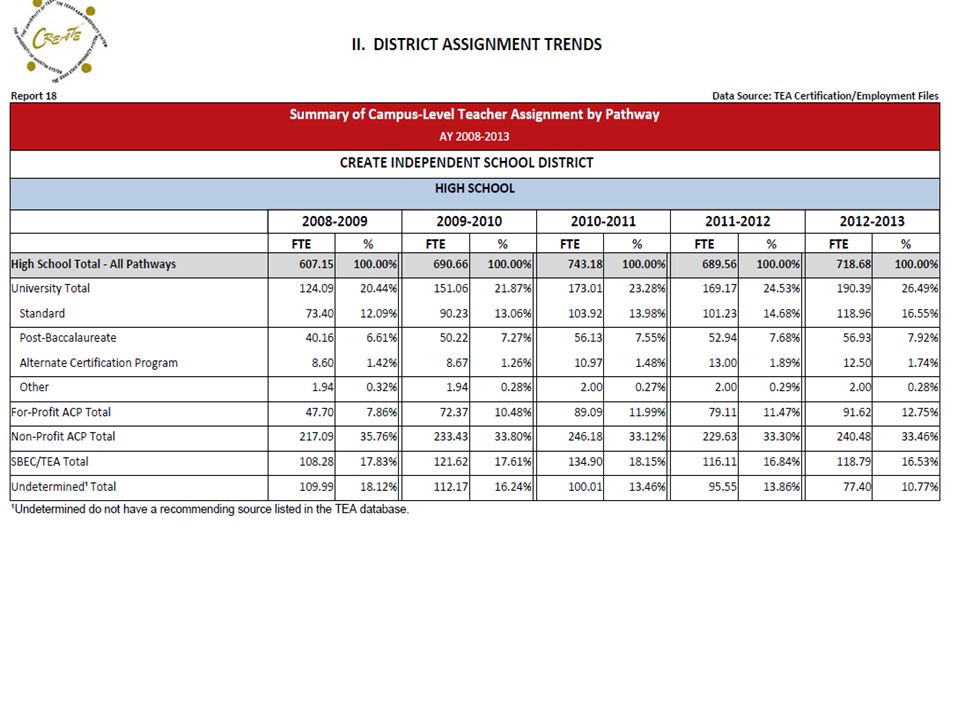
SECTION II: Assignment TRENDS All District Teachers — H S Reports 17-20 17.Summary of Campus-Level Teacher Assignment 18.Summary of Campus-Level Teacher Assignment by Certification Pathway 19.Campus-Level Teacher Assignment by Pathway 20.Campus-Level Teacher Assignment by Recommending Program

27
CREATE INDEPENDENT SCHOOL DISTRICT

28
SECTION II: Assignment TRENDS Newly-Hired Teachers by Level − EL,MS,HS Reports 21-32 Summary of Campus-Level Teacher Assignment Summary of Campus-Level Teacher Assignment by Certification Pathway Campus-Level Teacher Assignment by Pathway Campus-Level Teacher Assignment by Recommending Program

29
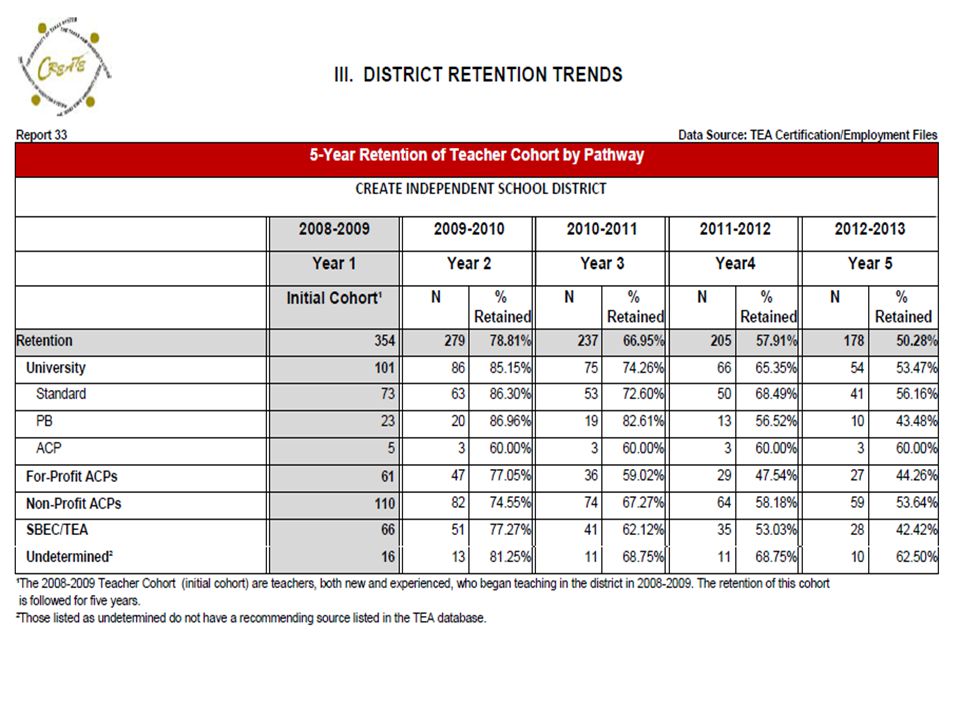
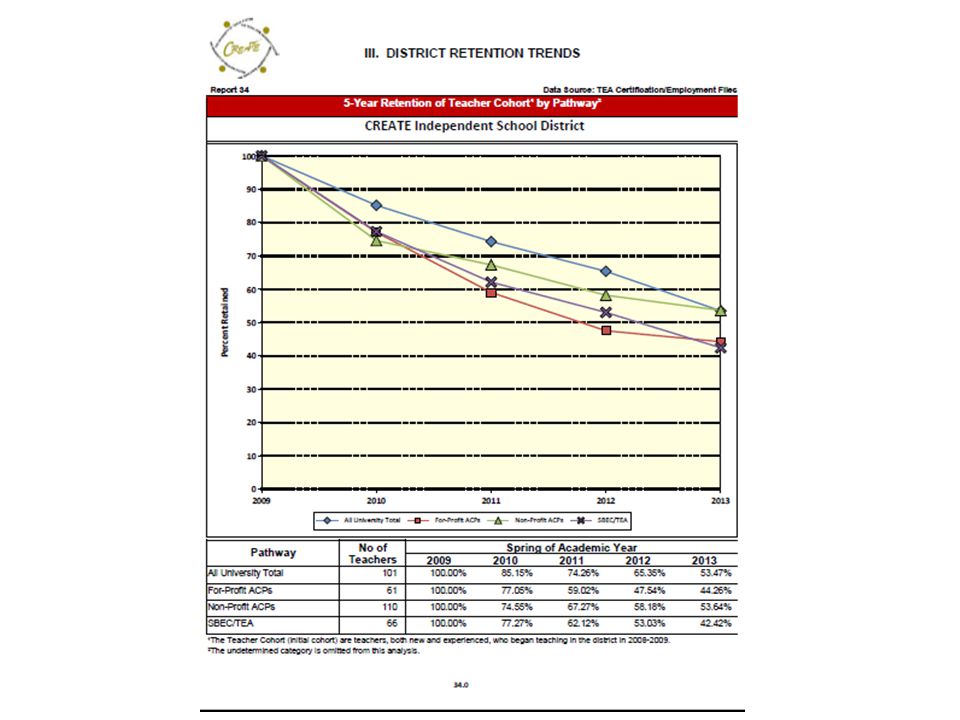
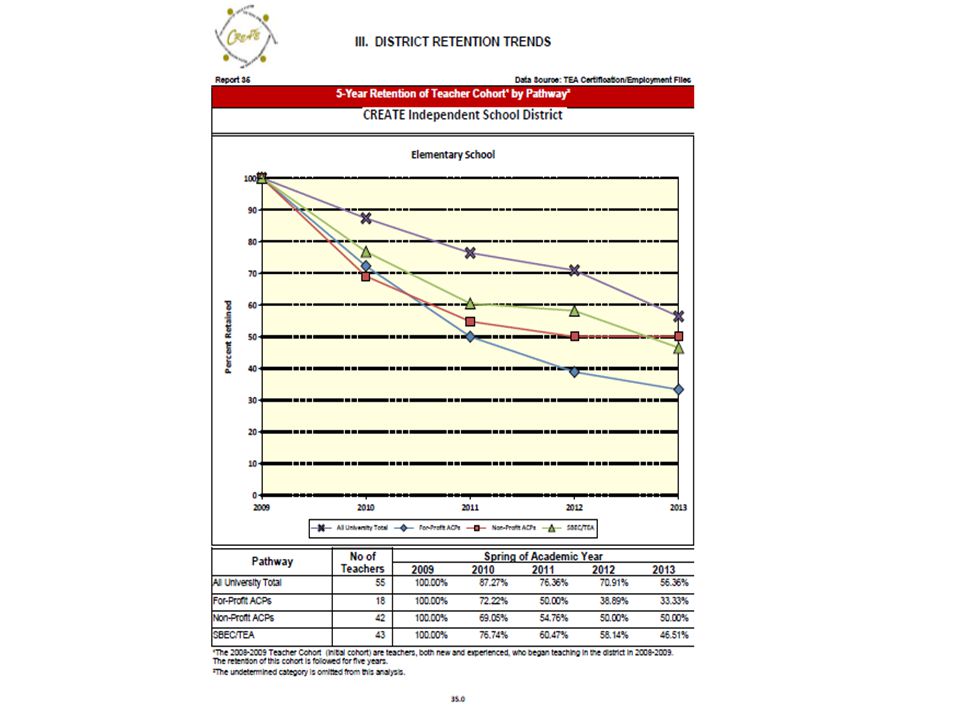
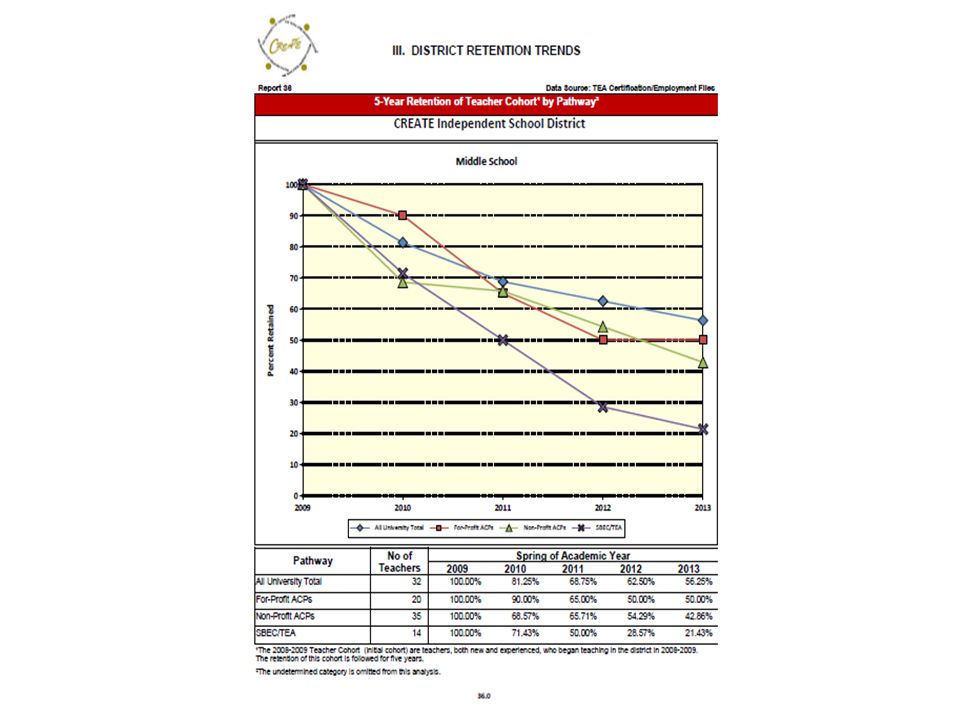
All District Teachers 33. 5-Year Retention of Teacher Cohort by Pathway 34.Figure of 5-Year Retention of Teacher Cohort by Pathway 35.Figure of 5-Year Retention of Teacher Cohort by Pathway— Elementary School 36.Figure of 5-Year Retention of Teacher Cohort by Pathway— Middle School Section III: RETENTON TRENDS

30
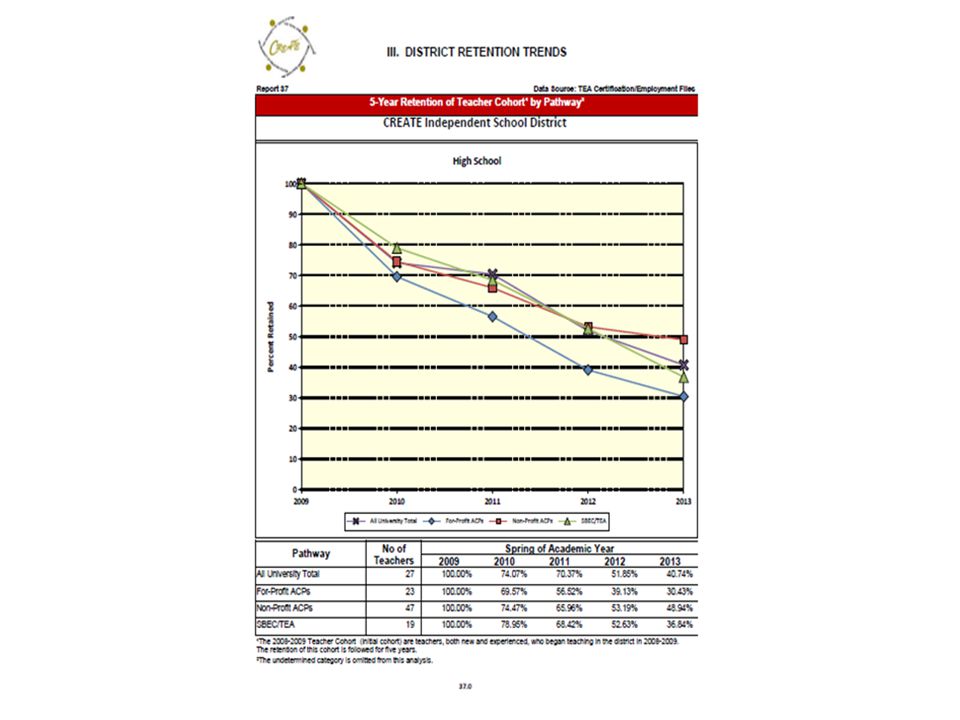
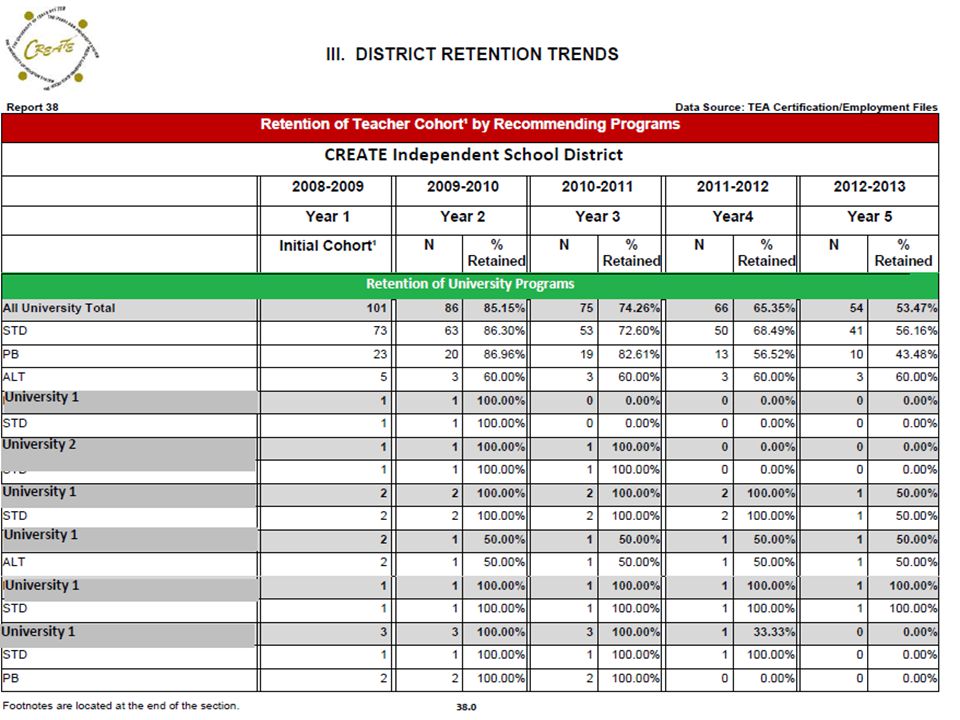
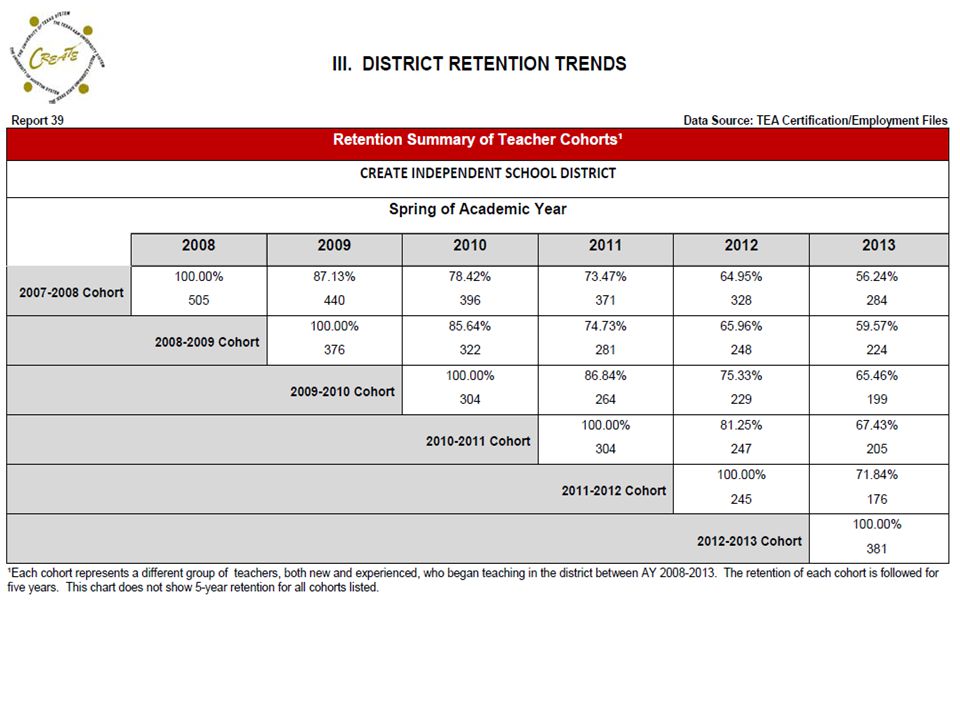
Section III: RETENTON REPORTS All District Teachers 37.5-Year Retention of Teacher Cohort by Pathway— High School 38.Retention of Teacher Cohort by Recommending Program 39.Retention Summary of 2007-2011 Teacher Cohorts

38
Customized Data Demographic Teacher Name Ethnicity Gender Employment Employment year District Campus name and code Assignment Role Population served Subject’s taught and % fte Certifications (to 8) Certification Year Organization Certification type Subject area For further analysis
 Certification Year Organization Certification type Subject area For further analysis")
39
DEMOGRAPHIC INFORMATION ID NumberLast NameFirst Name Middle Name EthnicityGender A unique identifier for each person listed in the database. For each employment year, a person's last, first and middle name will appear on a separate row for every class taught until % FTE adds up to 1.0. For each employ- ment year, a per- son's last, first, and middle name will appear as a separate row for every class taught until % FTE adds up to 1.0. Am. Indian/Alaska Native Asian Black/African American Hispanic/Latino White Female Male EMPLOYMENT INFORMATION Employment Year Campus Code Campus Name Role Population Served Subject Area Subjects Taught % FTE All employment is calculated in the spring of the academic year. If employment year is 2013, then employment took place during the 2012-2013 academic year. Code assigned to campus where teacher is employed. Name of public school campus where teacher is employed. As defined by PEIMS. Teacher Principal Asstistant Principal Counselor Librarian Educational Aide Diagnostician Intrepreter Type of student: Regular Bilingual Compensatory/Remedial Gifted/Talented Career/Technical Special Education English as a Second Language Adult Basic Education Honors Migrant The general subject area of the teaching assignment for each FTE up to 1.0 Description of the teaching assignment. This is tied to the % FTE column. If the % FTE is less than 1.0, there will be a line for each subject taught and the % FTE of the assignment. For each employment year, the allotment of subject taught per class up to 1.0. FIRST THROUGH EIGHTH CERTIFICATE Certification YearOrganization Program Type Certification Type Certification Subject AreaCertification Subject Field Starts at FY 1990. Data before 1989-1990 are not available. Name of recommending organization. Standard Post-baccalaureate Alternative By examination Jamison Bill Vocational experience Out-of-State Permit Paraprofessional Unknown Emergency (3 types) Non-renewable One year Paraprofessional & Standard Para. Probationary Professional Provisional Standard Stardard Professional Unknown Vocational Broad description of certification area.Detailed description of certification area.
 Non-renewable One year Paraprofessional & Standard Para. Probationary Professional Provisional Standard Stardard Professional Unknown Vocational Broad description of certification area.Detailed description of certification area..")
40
Data Format: – Electronic copy of structured reports in pdf format – Hardcopy of sample report – Customized data file with data dictionary Cost Availability School District Reports

41
CONTACT INFORMATION Mona S. Wineburg, Executive Director mwineburg@createtx.org mwineburg@createtx.org Sherri Lowrey Associate Director of Research slowrey@createtx.org slowrey@createtx.org John Beck Higher Education Research Liaison jbeck@createtx.org

Similar presentations


 Requirements No Child Left Behind December 2, 2009.>")


