Download presentation
Presentation is loading. Please wait.

1
Unit 5 Data Analysis

2
MM3D3 Empirical Rule

3
Normal Distributions Normal distributions are based on two parameters
Mean If you have population data use 𝜇 If you have sample data use 𝑥 Standard Deviation If you have population data use 𝜎 If you have sample data use s When a distribution is normal we use shorthand to show the mean and standard deviation Sample: N 𝑥 , 𝑠 Population: N 𝜇, 𝜎

4
Normal Curves Use the parameters to find the inflection points on the curve. Where the curve changes concavity

5
Normal Curves The mean is in the exact middle
Add and subtract the standard deviation to find the inflection points 𝑥 −3𝑠 𝑥 −2𝑠 𝑥 −𝑠 𝑥 𝑥 +𝑠 𝑥 +2𝑠 𝑥 +3𝑠

6
Empirical Rule 68% of the data is within one standard deviation of the mean 95% of the data is within two standard deviations of the mean 99.7% of the data is within three standard deviations of the mean 99.7% 95% 68% 𝑥 −3𝑠 𝑥 −2𝑠 𝑥 −𝑠 𝑥 𝑥 +𝑠 𝑥 +2𝑠 𝑥 +3𝑠

7
Empirical Rule Expanded
Sometimes, it is helpful to know the percent of the curve that is represented by each section of the distribution.

8
The middle 68 % ? ? 34% 34%

9
The middle 95 % 34% 34% 13.5% ? ? 13.5%

10
The middle 99.7 % 34% 34% 13.5% 13.5% ? 2.35% 2.35% ?

11
The Tails 34% 34% 13.5% 13.5% 0.15% ? ? 0.15% 2.35% 2.35%

12
Applying the Empirical Rule
Often the empirical rule is used to determine the percent of data that falls above or below a point of inflection. For example: IQ scores are normally distributed with a mean of 110 and standard deviation 25. What percent of people score lower than 110 on the IQ test

13
Normal Curves IQ scores are normally distributed with a mean of 110 and standard deviation 25. 𝑥 −3𝑠 𝑥 −2𝑠 𝑥 −𝑠 𝑥 𝑥 +𝑠 𝑥 +2𝑠 𝑥 +3𝑠 35 60 85 110 135 160 185

14
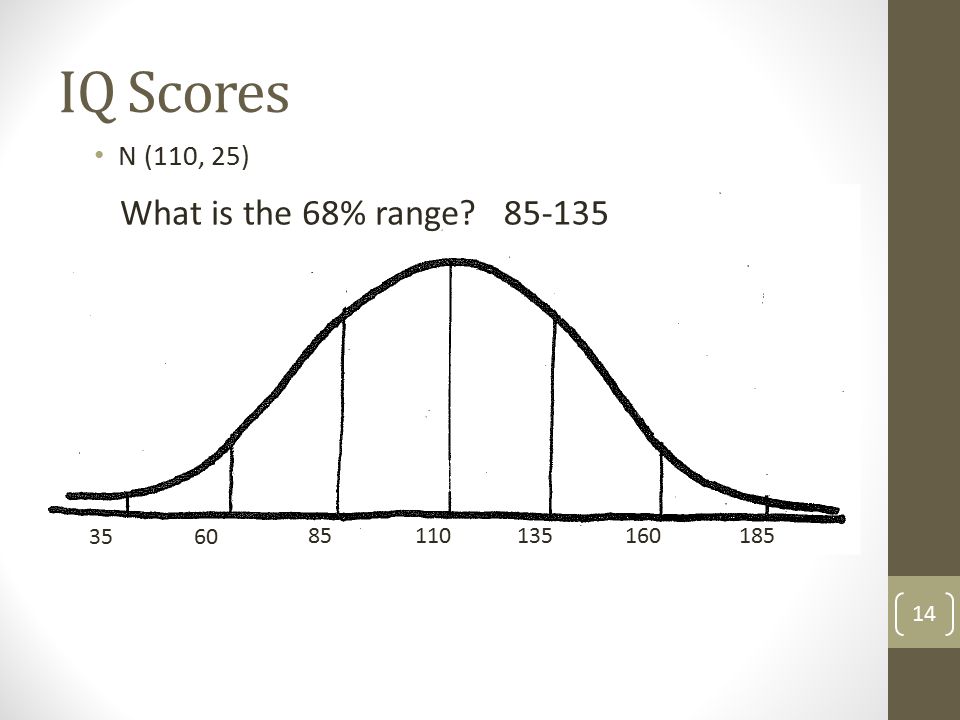
IQ Scores What is the 68% range? 85-135 N (110, 25) 35 60 85 110 135
160 185
15
IQ Scores What is the 95% range? 60-160 N (110, 25) 35 60 85 110 135
185

16
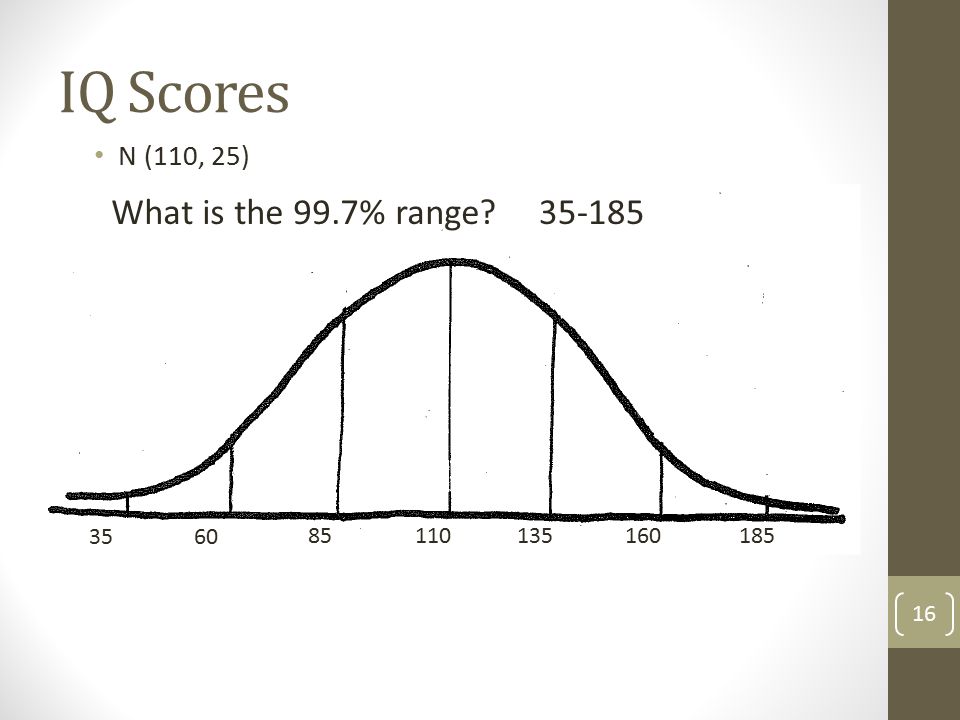
IQ Scores What is the 99.7% range? 35-185 N (110, 25) 35 60 85 110 135
160 185
17
IQ Scores What percent falls between 85 and 160? 81.5 N (110, 25) 35
135 160 185

18
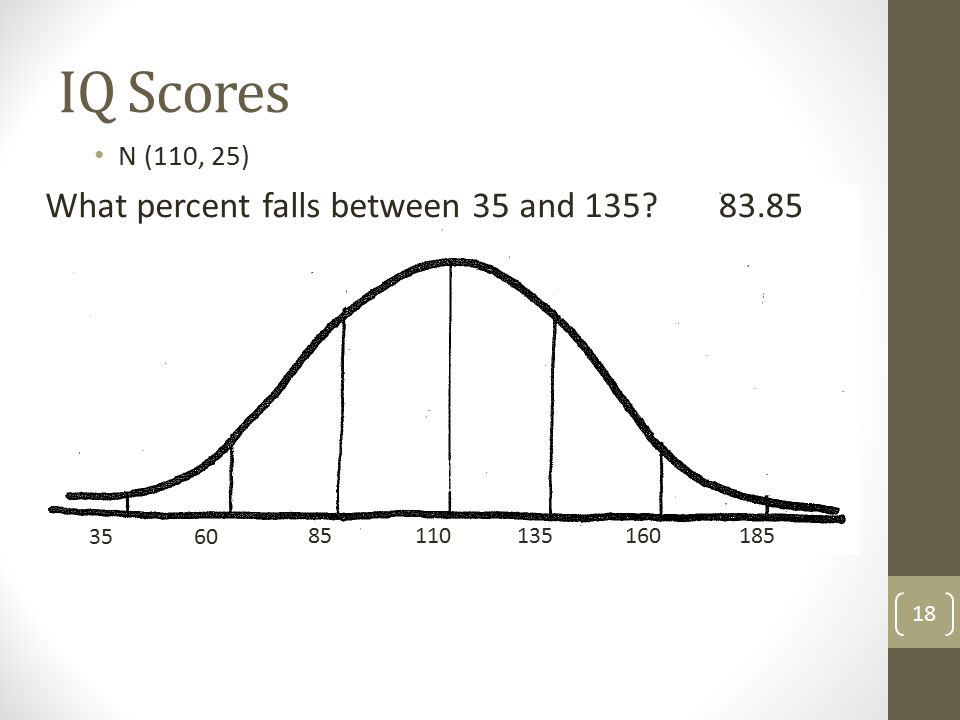
IQ Scores What percent falls between 35 and 135? 83.85 N (110, 25) 35
60 85 110 135 160 185
19
What percent falls below 85?
IQ Scores N (110, 25) What percent falls below 85? 16 35 60 85 110 135 160 185
 What percent falls below")
20
What percent falls below 185?
IQ Scores N (110, 25) What percent falls below 185? 99.85 35 60 85 110 135 160 185
 What percent falls below")
21
IQ Scores What percent is above 185? 0.15 N (110, 25) 35 60 85 110 135
160 185

22
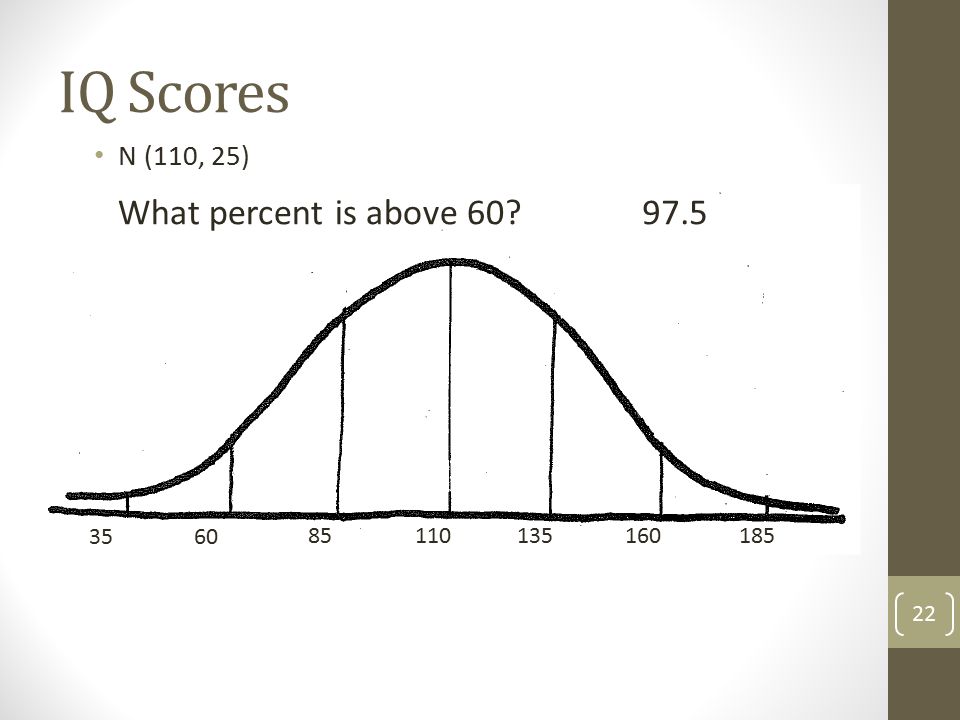
IQ Scores What percent is above 60? 97.5 N (110, 25) 35 60 85 110 135
160 185
23
Z-Scores

24
Recall: Empirical Rule
68% of the data is within one standard deviation of the mean 95% of the data is within two standard deviations of the mean 99.7% of the data is within three standard deviations of the mean 99.7% 95% 68% 𝑥 −3𝑠 𝑥 −2𝑠 𝑥 −𝑠 𝑥 𝑥 +𝑠 𝑥 +2𝑠 𝑥 +3𝑠

25
Example IQ Scores are Normally Distributed with N(110, 25)
Complete the axis for the curve 99.7% 95% 68% 35 60 85 110 135 160 185

26
Example 16% What percent of the population scores lower than 85? 99.7%
95% 68% 35 60 85 110 135 160 185

27
Example What percent of the population scores lower than 100? 99.7%
95% 68% 35 60 85 100 110 135 160 185

28
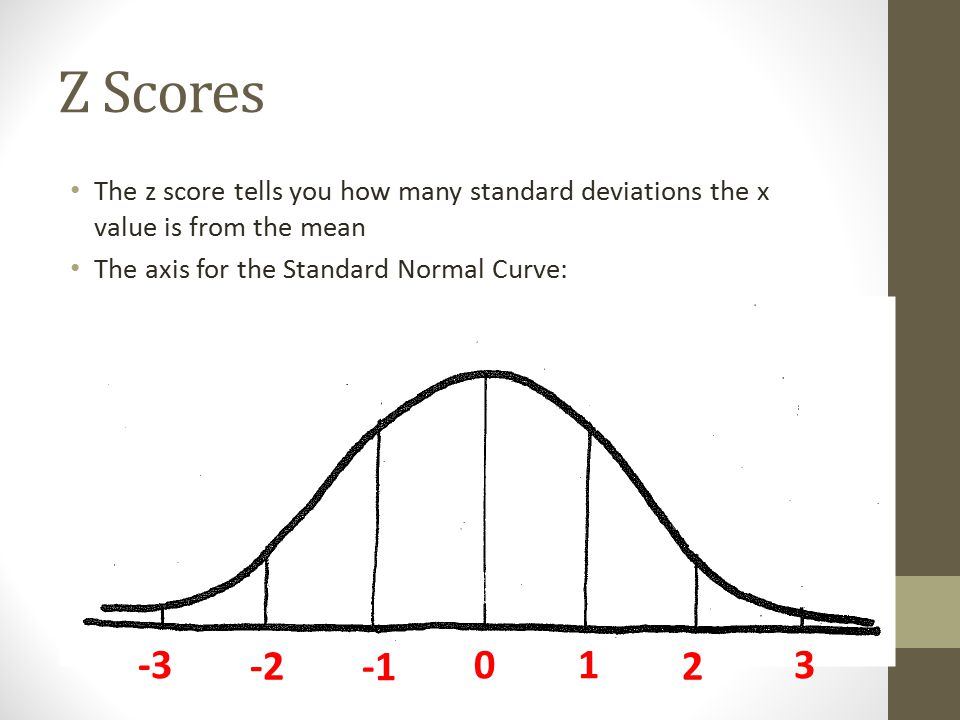
Z Scores Allow you to get percentages that don’t fall on the boundaries for the empirical rule Convert observations (x’s) into standardized scores (z’s) using the formula: 𝑧= 𝑥−𝜇 𝜎
 into standardized scores (z’s) using the formula: 𝑧= 𝑥−𝜇 𝜎.")
29
Z Scores The z score tells you how many standard deviations the x value is from the mean The axis for the Standard Normal Curve: -3 -2 -1 1 2 3
30
Z Score Table: The table will tell you the proportion of the population that falls BELOW a given z-score. The left column gives the ones and tenths place The top row gives the hundredths place What percent of the population is below .56? .7123 or 71.23%

31
Z Score Table: The table will tell you the proportion of the population that falls BELOW a given z-score. The left column gives the ones and tenths place The top row gives the hundredths place What percent of the population is below .4? .6554 or 65.54%

32
Using the z score table You can also find the proportion that is above a z score Subtract the table value from 1 or 100% Find the percent of the population that is above a z score of 2.59 .0048 or .48% Find the percent of the population that is above a z score of -1.91 .9719 or 97.19%

33
Using the z score table You can also find the proportion that is between two z scores Subtract the table values from each other Find the percent of the population that is between .27 and 1.34 .3035 or 30.35% Find the percent of the population that is between and 1.89 .9484 or 94.84%

34
Application 1 IQ Scores are Normally Distributed with N(110, 25) What percent of the population scores below 100? Convert the x value to a z score 𝑧= 𝑥−𝜇 𝜎 Use the z score table .3446 or 34.46% = 100−110 25 =−.4

35
Application 2 IQ Scores are Normally Distributed with N(110, 25)
What percent of the population scores above 115? Convert the x value to a z score 𝑧= 𝑥−𝜇 𝜎 Use the z score table .5793 fall below This question is asking for above, so you have to subtract from 1. .4207 or 42.07% = 115−110 25 =.2

36
Application 3 IQ Scores are Normally Distributed with N(110, 25)
What percent of the population score between 50 and 150? Convert the x values to z scores 𝑧= 𝑥−𝜇 𝜎 Use the z score table .9452 and .0082 This question is asking for between, so you have to subtract from each other. .9370 or 93.7% = 150−110 25 =1.6 = 50−110 25 =−2.4

Similar presentations


FREQUENCY 52-530.5 53-541.5 54-551 55-562 56-576.5 57-5818 58-5934.5 59-6079.5.>")


