Download presentation
Presentation is loading. Please wait.

1
DYNAMIC CAUSAL MODELLING FOR fMRI Theory and Practice
Diego Lorca Puls and Sotirios Polychronis

2
OUTLINE DCM: Theory Background Basis of DCM DCM: Practice
Neuronal Model Hemodynamic Model Model Inversion: Parameter Estimation, Model Comparison and Selection DCM Implementation Alternatives DCM: Practice Rules of Good Practice Experimental Design Step-by-step Guide

3
FUNDAMENTS OF CONNECTIVITY
Functional Segregation A given cortical area is specialized for some aspects of perceptual, motor or cognitive processing. Functional Integration Refers to the interactions among specialised neuronal populations and how these interactions depend upon the sensorimotor or cognitive context.

4
Structural, Functional and Effective Connectivity
large-scale anatomical infrastructures that support effective connections for coupling Structural connectivity statistical dependencies among remote neurophysiological events Functional connectivity Effective connectivity influence that one system exerts over another

5
Structural Equation Modelling (SEM)
Regression models (e.g. psycho-physiological interactions, PPIs) Volterra kernels Time series models (e.g. MAR/VAR, Granger causality) Dynamic Causal Modelling (DCM) Models of Effective Connectivity for fMRI Data
 Volterra kernels. Time series models (e.g. MAR/VAR, Granger causality) Dynamic Causal Modelling (DCM) Models of Effective Connectivity for fMRI Data.")
6
DCM OVERVIEW is a generic approach for inferring hidden (unobserved) neural states from measured brain activity by means of fitting a generative model to the data which provides mechanistic insights into brain function. Key features: Dynamic Causal Neurophysiologically plausible/interpretable Make use of a generative/forward model (mapping from consequences to causes) Bayesian in all aspects
 neural states from measured brain activity by means of fitting a generative model to the data which provides mechanistic insights into brain function. Key features: Dynamic. Causal. Neurophysiologically plausible/interpretable. Make use of a generative/forward model (mapping from consequences to causes) Bayesian in all aspects.")
7
A Bilinear Model of Interacting Visual Regions
z3 z4 *Z = X z1 z2 u2 u1

8
A Bilinear Model of Interacting Visual Regions
z3 z4 *Z = X z1 z2 u2 u1

9
A Bilinear Model of Interacting Visual Regions
z3 z4 *Z = X z1 z2 u2 u1

10
Neuronal Model Bilinear State Equation state changes
endogenous connectivity modulation of connectivity system state input parameters external inputs n regions m inputs (mod.) m inputs (driv.)
 m inputs (driv.)")
11
“C” (direct or driving effects)
extrinsic influences of inputs on neuronal activity. “A” (endogenous coupling or latent connectivity) fixed or intrinsic effective connectivity; first order connectivity among the regions in the absence of input; average/baseline connectivity in the system. “B” (bilinear term, modulatory effects or induced connectivity) context-dependent change in connectivity; second-order interaction between the input and activity in a source region when causing a response in a target region. rate constants (Hz) a strong connection means an influence that is expressed quickly or with a small time constant. Units of parameters
 fixed or intrinsic effective connectivity; first order connectivity among the regions in the absence of input; average/baseline connectivity in the system. B (bilinear term, modulatory effects or induced connectivity) context-dependent change in connectivity; second-order interaction between the input and activity in a source region when causing a response in a target region. rate constants (Hz) a strong connection means an influence that is expressed quickly or with a small time constant. Units of. parameters.")
12
Endogenous Connectivity
Neuronal Model Hemodynamic Model BOLD signal Endogenous Connectivity Modulation of connectivity Input parameters

13
Hemodynamic Model

14
Model Inversion DCM is a fully Bayesian approach aiming to explain how observed data (BOLD signal) was generated. DCM accommodates Prior knowledge New data posterior likelihood x prior updates (optimise) parameter estimates Empirical assumed Gaussian distribution parameter (re)estimation by means of VB under Laplace approximation DCM priors on parameters iterative process Principled Shrinkage
 parameter estimates. Empirical. assumed Gaussian distribution. parameter (re)estimation by means of VB under Laplace approximation. DCM priors on parameters. iterative process. Principled. Shrinkage.")
15
Akaike's Information Criterion (AIC)
Model Evidence Akaike's Information Criterion (AIC) Different approximations Bayesian Information Criterion (BIC) Negative variational free energy
 Different approximations. Bayesian Information Criterion (BIC) Negative variational free energy.")
16
A more intuitive interpretation of model comparisons is granted by Bayes factor:
Winning model? Best balance between accuracy and complexity Occam's razor (principle of parsimony)
")
17
DCM Implementation Alternatives

18
DCM Deterministic Stochastic

19
DCM: Practice Rules of good practice
10 Simple Rules for DCM (2010). Stephan et al. NeuroImage, 52 DCM in SPM. Steps within SPM. Example: attention to motion in the visual system (Büchel & Friston 1997, Cereb. Cortex, Büchel et al. 1998, Brain)
. Stephan et al. NeuroImage, 52. DCM in SPM. Steps within SPM. Example: attention to motion in the visual system (Büchel & Friston 1997, Cereb. Cortex, Büchel et al. 1998, Brain)")
20
Rules of good practice DCM is dependent on experimental disruptions.
Experimental conditions enter the model as inputs that either drive the local responses or change connections strengths. It is better to include a potential activation found in the GLM analysis. Use the same optimization strategies for design and data acquisition that apply to conventional GLM of brain activity: preferably multi-factorial (e.g. 2 x 2). one factor that varies the driving (sensory) input. one factor that varies the contextual input.
. one factor that varies the driving (sensory) input. one factor that varies the contextual input.")
21
Define the relevant model space
Define sets of models that are plausible, given prior knowledge about the system, this could be derived from principled considerations. informed by previous empirical studies using neuroimaging, electrophysiology, TMS, etc. in humans or animals. Use anatomical information and computational models to refine the DCMs. The relevant model space should be as transparent and systematic as possible, and it should be described clearly in any article.

22
Motivate model space carefully
Models are never true. They are meant to be helpful caricatures of complex phenomena. The purpose of model selection is to determine which model, from a set of plausible alternatives, is most useful i.e., represents the best balance between accuracy and complexity. The critical question in practice is how many plausible model alternatives exist? For small systems (i.e., networks with a small number of nodes), it is possible to investigate all possible connectivity architectures. With increasing number of regions and inputs, evaluating all possible models, a fact that becomes practically impossible.
, it is possible to investigate all possible connectivity architectures. With increasing number of regions and inputs, evaluating all possible models, a fact that becomes practically impossible.")
23
What you can not do with BMS
Model evidence is defined with respect to one particular data set. This means that BMS cannot be applied to models that are fitted to different data. Specifically, in DCM for fMRI, we cannot compare models with different numbers of regions, because changing the regions changes the data (We are fitting different data).
.")
24
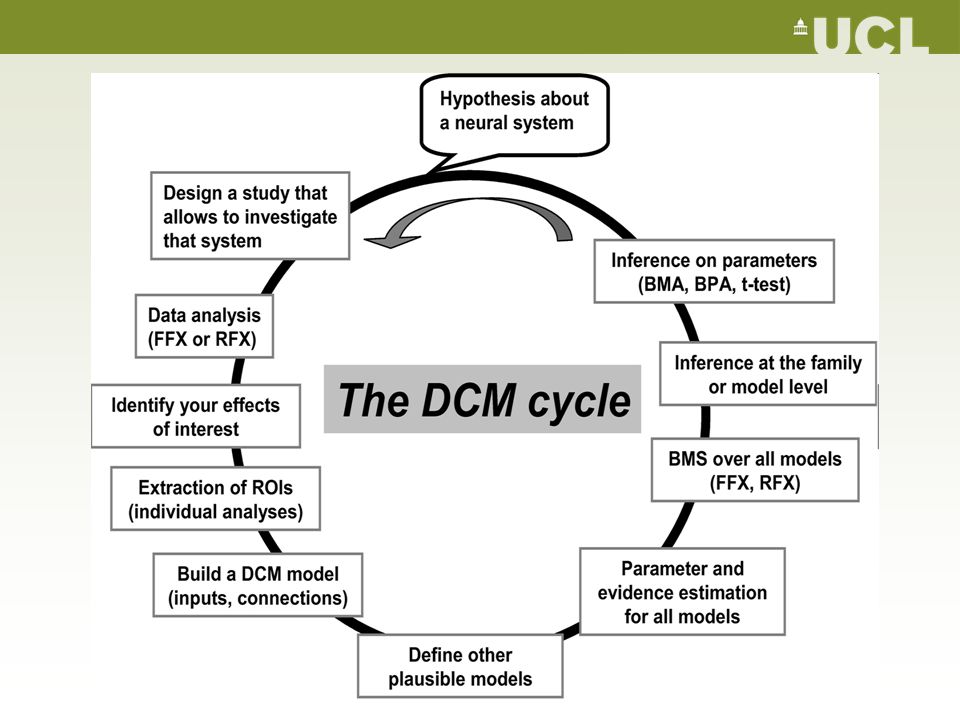
Fig. 1. This schematic summarizes the typical sequence of analysis in DCM, depending on the question of interest. Abbreviations: FFX=fixed effects, RFX=random effects, BMS=Bayesian model selection, BPA=Bayesian parameter averaging, BMA=Bayesian model averaging, ANOVA=analysis of variance.

25
Steps for conducting a DCM study on fMRI data…
Planning a DCM study The example dataset Identify your ROIs & extract the time series Defining the model space Model Estimation Bayesian Model Selection/Model inference Family level inference Parameter inference Group studies

26
Planning a DCM Study DCM can be applied to most datasets analysed using a GLM. BUT! there are certain parameters that can be optimised for a DCM study.

27
Attention to Motion Dataset
Question: Why does attention cause a boost of activity on V5? Sensory input factor static moving No attent Attent. Contextual factor No motion/ no attention No motion/ attention Motion / no attention Motion / attention DCM analysis regressors: Vision (photic) motion attention
 motion. attention.")
28
Attentional modulation of V1→V5 Attentional modulation of SPC→V5
MODEL 1 Attentional modulation of V1→V5 forward/bottom-up (modulation) MODEL 2 Attentional modulation of SPC→V5 backward/top-down
 MODEL 2. Attentional modulation of SPC→V5. backward/top-down.")
29
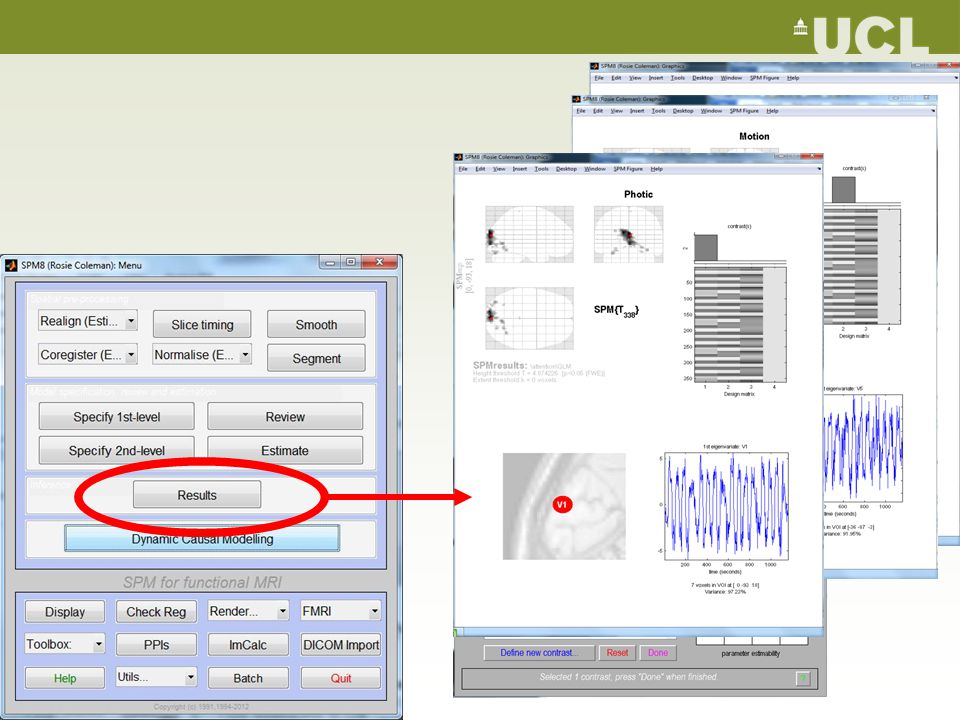
SPM8 Menu – Dynamic Causal Modelling

30
1. Extracting the time-series
We define our contrast (e.g. task vs. rest) and extract the time-series for the areas of interest. The areas need to be the same for all subjects. There needs to be significant activation in the areas that you extract. For this reason, DCM is not appropriate for resting state studies.
 and extract the time-series for the areas of interest. The areas need to be the same for all subjects. There needs to be significant activation in the areas that you extract. For this reason, DCM is not appropriate for resting state studies.")
32
2. Defining the model space
The models that you choose to define for your DCM depend largely on your hypotheses. well-supported predictions no strong indication of network structure inferences on model structure inferences on connection strengths → can define a small number of possible models. → may be useful to define all possible models. We use anatomical and computational knowledge. More models do NOT mean we are eligible for multiple comparisons!

33
At this stage, you can specify various options.
MODULATORY EFFECTS: bilinear vs non-linear STATES PER REGION: one vs. two STOCHASTIC EFFECTS: yes vs. no CENTRE INPUT: yes vs. no

34
3. Model Estimation We fit the predicted model to the data.
The dotted lines represent the real data whereas full lines represent the predicted data from SPM: blue being V1, green V5 and red SPC. Bottom graph shows your parameter estimations.

35
4. BMS & Model-Level Inference
We choose directory Optional: Load all models for all subjects (must be estimated!) Define families Compute BMA Then, choose FFX or RFX – Multiple subjects with possibility for different models = RFX Use ‘load model space’ to save time (this file is included in Attention to Motion dataset)
 Define families. Compute BMA. Then, choose FFX or RFX – Multiple subjects with possibility for different models = RFX. Use ‘load model space’ to save time (this file is included in Attention to Motion dataset)")
36
Attentional modulation of V1→V5
Winning Model! MODEL 1 Attentional modulation of V1→V5 forward/bottom-up

37
Modulatory Connections
Intrinsic Connections

38
5. Family-Level Inference
Often, there doesn’t appear to be one model that is an overwhelming ‘winner’. In these circumstances, we can group similar models together to create families. By sorting models into families with common characteristics, you can aggregate evidence. We can then use these to pool model evidence and make inferences at the level of the family.

39
6. Parameter-Level Inference
Bayesian Model Averaging Calculates the mean parameter values, weighted by the evidence for each model. Parameter Level Within Groups parameter 1 > parameter 2 ? parameter > 0 ? Does connection strength vary by performance/symptoms/other variable? BMA can be calculated based on an individual subject, or on a group-level. T-tests can be used to compare connection strengths.

40
7. Group Studies DCM can be fruitful for investigating group differences. E.g. patients vs. controls Groups that may differ in; Winning model Winning family Connection values as defined using BMA

41
So, DCM… enables us to infer hidden neuronal processes from fMRI data.
allows us to test mechanistic hypotheses about observed effects using a deterministic differential equation to model neuro-dynamics (represented by matrices A,B and C). is governed by anatomical and physiological principles. uses a Bayesian framework to estimate model parameters. is a generic approach to modelling experimentally disrupted dynamic systems.
. is governed by anatomical and physiological principles. uses a Bayesian framework to estimate model parameters. is a generic approach to modelling experimentally disrupted dynamic systems.")
43
Thank you for listening…
… and special thanks to our expert Mohamed Seghier!

44
REFERENCES http://www.fil.ion.ucl.ac.uk/spm/course/video/
Previous MfD slides Arthurs, O. J., & Boniface, S. (2002). How well do we understand the neural origins of the fMRI BOLD signal?. Trends in Neurosciences, 25, Bastos, A. M., Usrey, W. M., Adams, R. A., Mangun, G. R., Fries, P., & Friston, K. J. (2012). Canonical microcircuits for predictive coding. Neuron, 76, Daunizeau, J., David, O., & Stephan, K. E. (2011). Dynamic causal modelling: a critical review of the biophysical and statistical foundations. Neuroimage, 58, Daunizeau, J., Preuschoff, K., Friston, K., & Stephan, K. (2011). Optimizing Experimental Design for Comparing Models of Brain Function. PLoS Computational Biology, 7, 1-18. Daunizeau, J., Stephan, K. E., & Friston, K. J. (2012). Stochastic dynamic causal modelling of fMRI data: Should we care about neural noise?. Neuroimage, 62, Friston, K. J. (2011). Functional and Effective Connectivity: A Review. Brain Connectivity, 1, 13-36. Friston, K. J., Harrison, L., & Penny, W. (2003). Dynamic causal modelling. Neuroimage, 19, Friston, K. J., Kahan, J., Biswal, B., & Razi, A. (in press). DCM for resting state fMRI. NeuroImage. Friston, K. J., Mechelli, A., Turner, R., & Price, C. J. (2000). Nonlinear Responses in fMRI: The Balloon Model, Volterra Kernels, and Other Hemodynamics. Neuroimage, 12,
. How well do we understand the neural origins of the fMRI BOLD signal . Trends in Neurosciences, 25, Bastos, A. M., Usrey, W. M., Adams, R. A., Mangun, G. R., Fries, P., & Friston, K. J. (2012). Canonical microcircuits for predictive coding. Neuron, 76, Daunizeau, J., David, O., & Stephan, K. E. (2011). Dynamic causal modelling: a critical review of the biophysical and statistical foundations. Neuroimage, 58, Daunizeau, J., Preuschoff, K., Friston, K., & Stephan, K. (2011). Optimizing Experimental Design for Comparing Models of Brain Function. PLoS Computational Biology, 7, Daunizeau, J., Stephan, K. E., & Friston, K. J. (2012). Stochastic dynamic causal modelling of fMRI data: Should we care about neural noise . Neuroimage, 62, Friston, K. J. (2011). Functional and Effective Connectivity: A Review. Brain Connectivity, 1, Friston, K. J., Harrison, L., & Penny, W. (2003). Dynamic causal modelling. Neuroimage, 19, Friston, K. J., Kahan, J., Biswal, B., & Razi, A. (in press). DCM for resting state fMRI. NeuroImage. Friston, K. J., Mechelli, A., Turner, R., & Price, C. J. (2000). Nonlinear Responses in fMRI: The Balloon Model, Volterra Kernels, and Other Hemodynamics. Neuroimage, 12,")
45
Friston, K. , Moran, R. , & Seth, A. K. (2013)
Friston, K., Moran, R., & Seth, A. K. (2013). Analysing connectivity with Granger causality and dynamic causal modelling. Current Opinion in Neurobiology, 23, Goulden, N., Elliott, R., Suckling, J., Williams, S. R., Deakin, J. F., & McKie, S. (2012). Sample size estimation for comparing parameters using dynamic causal modeling. Brain Connectivity, 2, 80-90. Kahan, J., & Foltynie, T. (2013). Understanding DCM: Ten simple rules for the clinician. Neuroimage, 83, Marreiros, A., Kiebel, S., & Friston, K. (2008). Dynamic causal modelling for fMRI: A two-state model. Neuroimage, 39, Penny, W. D. (2012). Comparing Dynamic Causal Models using AIC, BIC and Free Energy. Neuroimage, 59, Penny, W. D., Stephan, K. E., Daunizeau, J., Rosa, M. J., Friston, K. J., Schofield, T. M., & Leff, A. P. (2010). Comparing families of dynamic causal models. PLoS Computational Biology, 6, 1-14. Penny, W., Stephan, K., Mechelli, A., & Friston, K. (2004). Comparing dynamic causal models. Neuroimage, 22, Pitt, M. A., & Myung, I. J. (2002). When a good fit can be bad. Trends in Cognitive Sciences, 6, Rigoux, L., Stephan, K. E., Friston, K. J., & Daunizeau, J. (2014). Bayesian model selection for group studies - revisited. Neuroimage, 84,
. Analysing connectivity with Granger causality and dynamic causal modelling. Current Opinion in Neurobiology, 23, Goulden, N., Elliott, R., Suckling, J., Williams, S. R., Deakin, J. F., & McKie, S. (2012). Sample size estimation for comparing parameters using dynamic causal modeling. Brain Connectivity, 2, Kahan, J., & Foltynie, T. (2013). Understanding DCM: Ten simple rules for the clinician. Neuroimage, 83, Marreiros, A., Kiebel, S., & Friston, K. (2008). Dynamic causal modelling for fMRI: A two-state model. Neuroimage, 39, Penny, W. D. (2012). Comparing Dynamic Causal Models using AIC, BIC and Free Energy. Neuroimage, 59, Penny, W. D., Stephan, K. E., Daunizeau, J., Rosa, M. J., Friston, K. J., Schofield, T. M., & Leff, A. P. (2010). Comparing families of dynamic causal models. PLoS Computational Biology, 6, Penny, W., Stephan, K., Mechelli, A., & Friston, K. (2004). Comparing dynamic causal models. Neuroimage, 22, Pitt, M. A., & Myung, I. J. (2002). When a good fit can be bad. Trends in Cognitive Sciences, 6, Rigoux, L., Stephan, K. E., Friston, K. J., & Daunizeau, J. (2014). Bayesian model selection for group studies - revisited. Neuroimage, 84,")
46
Seghier, M. L. , & Friston, K. J. (2013)
Seghier, M. L., & Friston, K. J. (2013). Network discovery with large DCMs. Neuroimage, 68, Seghier, M. L., Zeidman, P., Neufeld, N. H., Price, C. J., & Leff, A. P. (2010). Identifying abnormal connectivity in patients using dynamic causal modeling of fMRI responses. Frontiers in Systems Neuroscience, 4, 1-14. Stephan, K. E. (2004). On the role of general system theory for functional neuroimaging. Journal of Anatomy, 205, Stephan, K. E., Harrison, L. M., Penny, W. D., & Friston, K. J. (2004). Biophysical models of fMRI responses. Current Opinion in Neurobiology, 14, Stephan, K. E., Kasper, L., Harrison, L. M., Daunizeau, J., den, O. H. E., Breakspear, M., & Friston, K. J. (2008). Nonlinear dynamic causal models for fMRI. Neuroimage, 42, Stephan, K. E., Marshall, J. C., Penny, W. D., Friston, K. J., & Fink, G. R. (2007). Interhemispheric Integration of Visual Processing during Task-Driven Lateralization. Journal of Neuroscience, 27, Stephan, K. E., Penny, W. D., Daunizeau, J., Moran, R. J., & Friston, K. J. (2009). Bayesian Model Selection for Group Studies. Neuroimage, 46, 1004–1017. Stephan, K. E., Weiskopf, N., Drysdale, P. M., Robinson, P. A., & Friston, K. J. (2007). Comparing hemodynamic models with DCM. Neuroimage, 38, Stephan, K.E., Penny, W.D., Moran, R.J., den Ouden, H.E.M., Daunizeau, J., & Friston, K.J. (2010). Ten simple rules for dynamic causal modeling. NeuroImage, 49, 3099–3109.
. Network discovery with large DCMs. Neuroimage, 68, Seghier, M. L., Zeidman, P., Neufeld, N. H., Price, C. J., & Leff, A. P. (2010). Identifying abnormal connectivity in patients using dynamic causal modeling of fMRI responses. Frontiers in Systems Neuroscience, 4, Stephan, K. E. (2004). On the role of general system theory for functional neuroimaging. Journal of Anatomy, 205, Stephan, K. E., Harrison, L. M., Penny, W. D., & Friston, K. J. (2004). Biophysical models of fMRI responses. Current Opinion in Neurobiology, 14, Stephan, K. E., Kasper, L., Harrison, L. M., Daunizeau, J., den, O. H. E., Breakspear, M., & Friston, K. J. (2008). Nonlinear dynamic causal models for fMRI. Neuroimage, 42, Stephan, K. E., Marshall, J. C., Penny, W. D., Friston, K. J., & Fink, G. R. (2007). Interhemispheric Integration of Visual Processing during Task-Driven Lateralization. Journal of Neuroscience, 27, Stephan, K. E., Penny, W. D., Daunizeau, J., Moran, R. J., & Friston, K. J. (2009). Bayesian Model Selection for Group Studies. Neuroimage, 46, 1004–1017. Stephan, K. E., Weiskopf, N., Drysdale, P. M., Robinson, P. A., & Friston, K. J. (2007). Comparing hemodynamic models with DCM. Neuroimage, 38, Stephan, K.E., Penny, W.D., Moran, R.J., den Ouden, H.E.M., Daunizeau, J., & Friston, K.J. (2010). Ten simple rules for dynamic causal modeling. NeuroImage, 49, 3099–3109.")
Similar presentations
 for fMRI>")


 Wellcome Trust Centre for Neuroimaging Institute of Neurology University College London SPM Course 2014.>")