Download presentation
Presentation is loading. Please wait.

1
9.2 Graphs of Polar Eqs

4
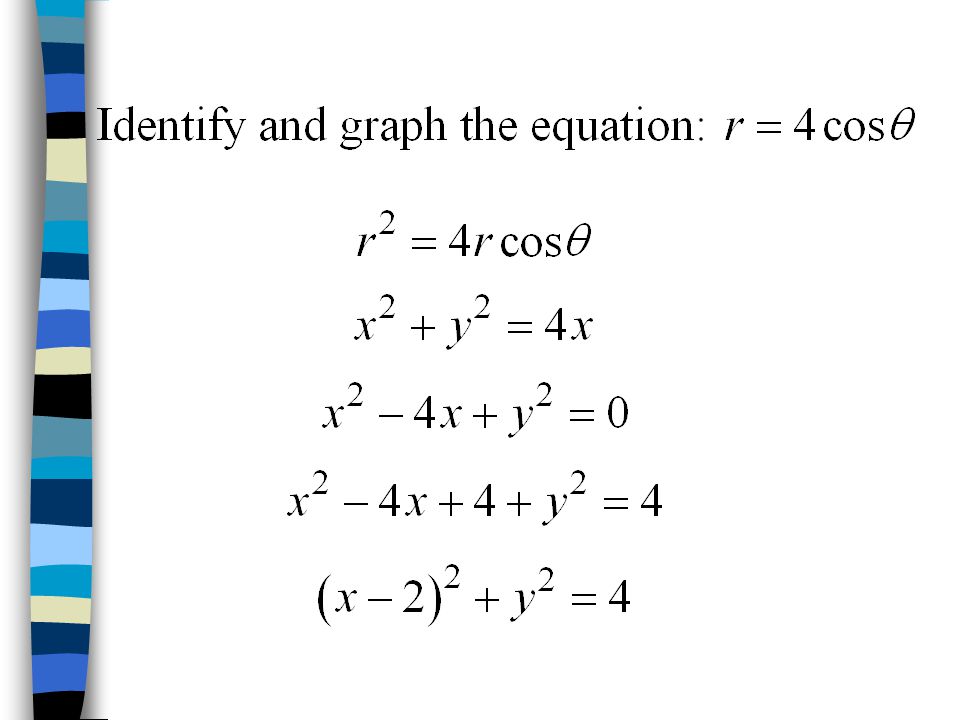
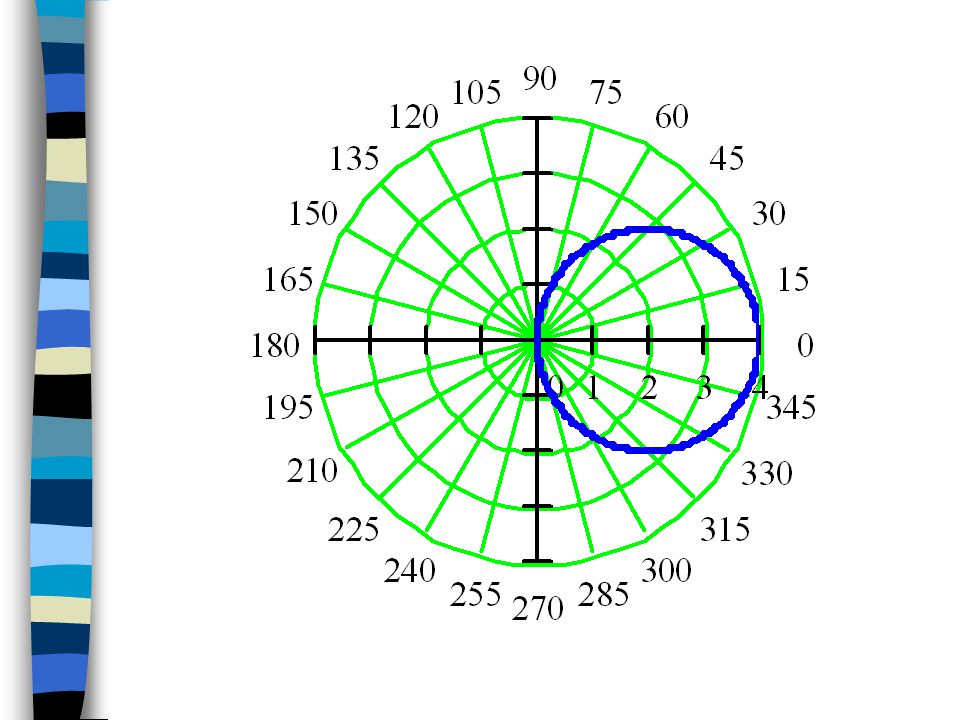
Circle: radius a; center at (a, 0) in rectangular coordinates. Circle: radius a; center at (-a, 0) in rectangular coordinates.
 in rectangular coordinates..")
5
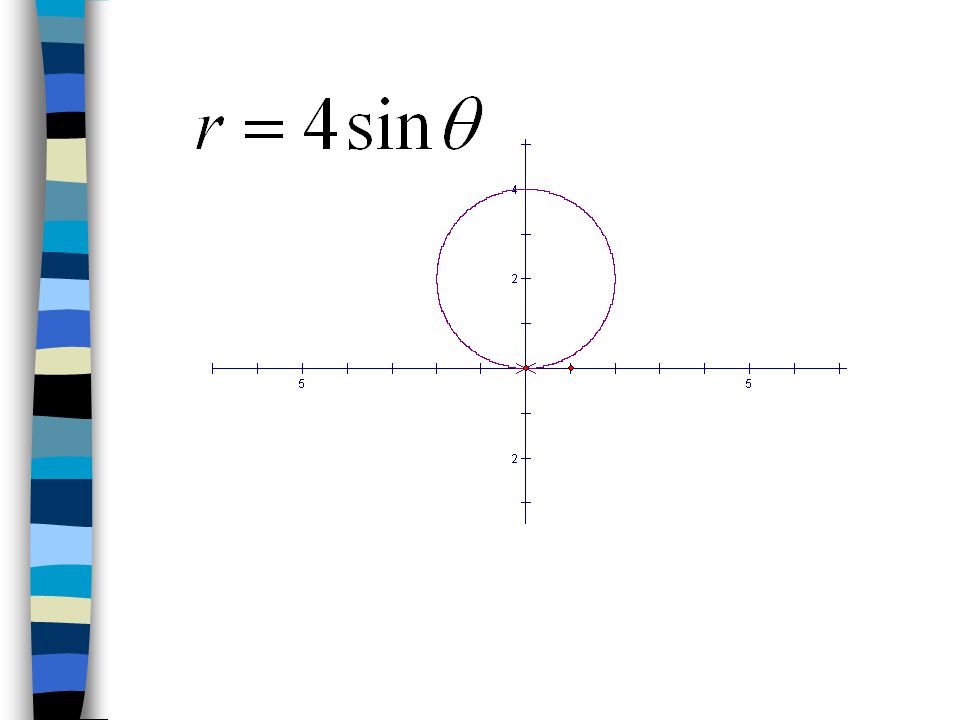
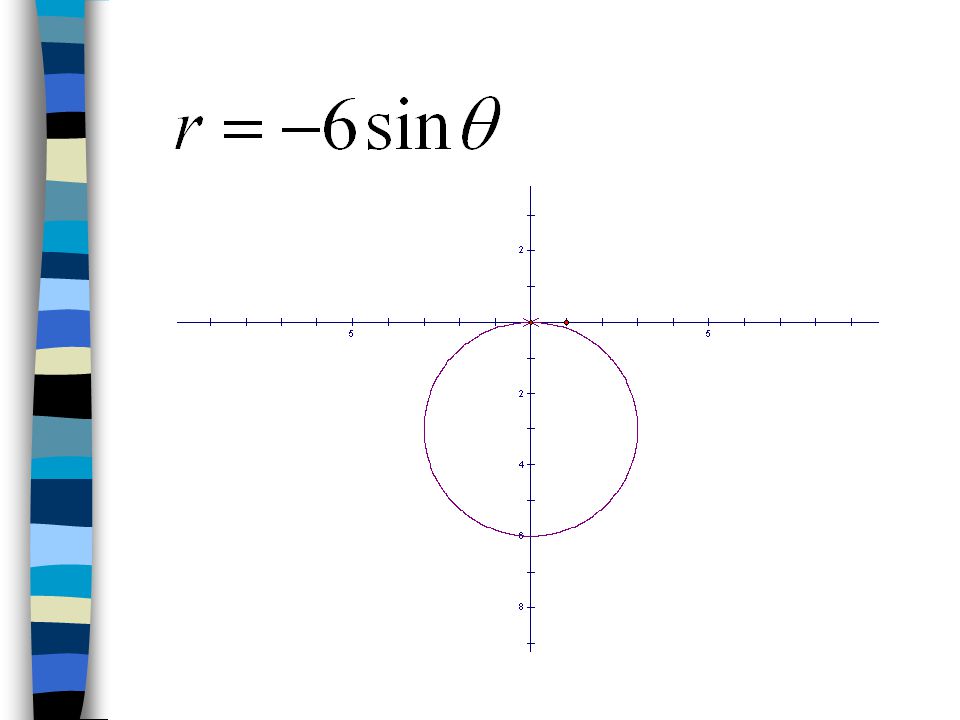
Circle: radius a; center at (0, a) in rectangular coordinates. Circle: radius a; center at (0, -a) in rectangular coordinates.
 in rectangular coordinates..")
8
In order to use your graphing calculator to graph Polar Equations, change your MODE to POLAR (instead of Function). Also, change your viewing window as follows… For DEGREES: min = 0 max = 360 step = 10 Xmin = -8 Xmax = 8 Xscl = 1 Ymin = -8 Ymax = 8 Yscl = 1 For RADIANS: min = 0 max = 2 step = /18 Xmin = -8 Xmax = 8 Xscl = 1 Ymin = -8 Ymax = 8 Yscl = 1

9
Now that you have your graphing calculator set up to graph Polar Equations, graph the following equations and see if you can identify the shape and how the numbers affect the graph itself… r = 2 + 2sin r = 2 + 2cos r = 1 + sin r = -2 + -2cos r = 3 + 3sin r = 3 + 3cos

10
Is the graph of a CARDIOID (heart) shape, symmetric to either the x axis (for cosine) or y axis (for sine) or
 shape, symmetric to either the x axis (for cosine) or y axis (for sine) or")
11
Now graph the following equations and see if you can identify the shape and how the numbers affect the graph itself… r = 2 + 3sin r = 1 + 2cos r = 1 + 4sin r = 3 + 2cos r = 2 + sin r = 4 + 2cos

12
Is the graph of a Limacon (pronounced “lee- ma-sahn”) shape, symmetric to either the x axis (for cosine) or y axis (for sine) or
 shape, symmetric to either the x axis (for cosine) or y axis (for sine) or")
13
Notice how the graph of a limacon changes depending on whether a > b or a < b a < b a > b

14
Now graph the following equations and see if you can identify the shape and how the numbers affect the graph itself… r = 3sin2 r = 2cos4 r = 4sin3 r = 5cos2 r = 3sin r = -3cos3

15
Is the graph of a ROSE shape, symmetric to either the x axis (for cosine) or y axis (for sine) or
 or y axis (for sine) or")
16
Notice how the ‘b’ value affects the graph: if b is even, then there are ‘2*b’ number of rose petals (loops); if ‘b’ is odd, there are ‘b’ number of petals and Below are the graphs of the roses for
; if ‘b’ is odd, there are ‘b’ number of petals and Below are the graphs of the roses for")
17
The next type of graph we are going to look at involves the following formats for the equation: and However, with the graphing calculator, we cannot Type the equations in this fashion. Instead, we take the square root of both sides of the Equation and type that equation into the calculator. For example: is typed in as

18
Now graph the following equations and see if you can identify the shape and how the numbers affect the graph itself…

19
Is the graph of a lemniscate (pronounced “lem-nah-scut”) shape, symmetric to either the x axis (for cosine) or the line y = x (for sine) or
 shape, symmetric to either the x axis (for cosine) or the line y = x (for sine) or")
20
The next type of graph we are going to look at involves the following format for the equation: However, with the graphing calculator, we will not be able to see much of the graph if we work with degrees, because r keeps increasing as the angle measure does. So switch to RADIAN MODE and be sure to modify the X and Y values in WINDOW to accommodate each graph.

21
Now graph the following equations and see if you can identify the shape and how the numbers affect the graph itself…

22
Is the graph of a Spiral of Archimedes (pronounced “Ar-cah-mee-dees”) shape.
 shape.")
Similar presentations
.>")


 Chapter 10 – Conic Sections and Polar Coordinates Section 10.6 – Graphing in Polar Coordinates Copyright © 2009 by Ron.>")


