Download presentation
Presentation is loading. Please wait.

1
Overview of Projects Fall 2002 Personality and Social Development Research Laboratory Marsha Weinraub, Director 6 th floor Weiss Hall Temple University

2
Three ongoing research projects NICHD Study of Early Child Care and Youth Development Barriers to Child Care Subsidy (with Anne Shlay at the Center for Public Policy) Applied work through CIRCL (Center for Improving Children’s Lives) –UCPC (Universities Children’s Policy Collaborative) –Governor’s Task Force on Early Child Care and Education
 Applied work through CIRCL (Center for Improving Children’s Lives) –UCPC (Universities Children’s Policy Collaborative) –Governor’s Task Force on Early Child Care and Education")
3
Project 1: NICHD Study of Early Child Care and Youth Development b Overview –Purpose –History, Investigators and Model –Participants and Overview of Procedures –Three Phases since 1991 b Findings: Prevalence and Quality of Child Care in the U.S. b Incredibly brief overview of other findings b Future directions

4
The Main Questions b What are today’s children’s experiences with early child care in the U.S.? b How does early child care affect children in the early years? b Does early child care experience continue to affect children as they move into preschool and elementary school?

5
Unique Features of the NICHD Study of Early Child Care b Prospective, longitudinal study b Wide range of child-care arrangements and family characteristics b Large sample diverse in terms of geography, ethnicity, education, income, and family composition b Multiple, broad-based assessments of children’s development b Direct observations of home and child-care experiences b Public access to data available to qualified/supervised investigators

6
NICHD investigators in Phase I b Mark Appelbaum - UC San Diego b Jay Belsky - Penn State University b Cathryn Booth - U of Washington b Robert Bradley - U of Arkansas b Celia Brownell - U of Pittsburgh b Peg Burchinal - U of North Carolina b Bettye Caldwell - Arkansas Children’s Hospital b Susan Campbell - U of Pittsburgh b Alison Clarke-Stewart - UC Irvine b Martha Cox - U of North Carolina b Sarah Friedman - NICHD b Kathy Hirsh-Pasek - Temple U. b Aletha Huston - U Texas at Austin b Bonnie Knoke - Research Triangle Institute b Nancy Marshall - Wellesley College b Kathleen McCartney - U of New Hampshire b Marion O’Brien - University of Kansas b Margaret Tresch Owen - UT Dallas b Deborah Phillips - National Academy of Sciences b Robert Pianta - U of Virginia b Susan Spieker - U of Washington b Deborah Lowe Vandell - U of Wisconsin b Marsha Weinraub - Temple U.

7
Families in the Study 1,364 eligible births occurring during 1991 1,364 eligible births occurring during 1991 Sampling designed to assure adequate representation of major socio- demographic niches Sampling designed to assure adequate representation of major socio- demographic niches Ten data collection sites Ten data collection sites Two sites in PA. Two sites in PA. 24 hospitals 24 hospitals Recruited in these locations

8
Who are the Families of the Study? Maternal Education at 1 Month Income-to-Needs at 1 Month

9
The Model Child Care Environment Home Environment Outcomes: Family/Child Child Demographics Family Char.

10
Data Collection Schedule Phase 1 and 2 Child age (in months)
")
11
Child Care Variables – Type of care (maternal care, relative care, in home care, child care home, center) – Age of entry to care – Amount of care (in hours per week) – Stability of care – Quality of care Regulables: group size, caregiver ed/training, safety Observations: ratings of the quality of interactions measures of the frequency of interactions
 – Age of entry to care – Amount of care (in hours per week) – Stability of care – Quality of care Regulables: group size, caregiver ed/training, safety Observations: ratings of the quality of interactions measures of the frequency of interactions")
12
Outcomes b Social b Emotional b Language b Intellectual b Behavior Problems and Adjustment b Health and Growth

13
Some selected findings Just the tip of the iceberg…

14
Child Care Usage? Child Care Usage? Age of Entry into 10 or More Hours of Care per Week 0 to 3 months51% 4 to 8 months18% 9 to 12 months 5% 13 to 24 months 9% 25 to 36 months 3% after 36 months14%

15
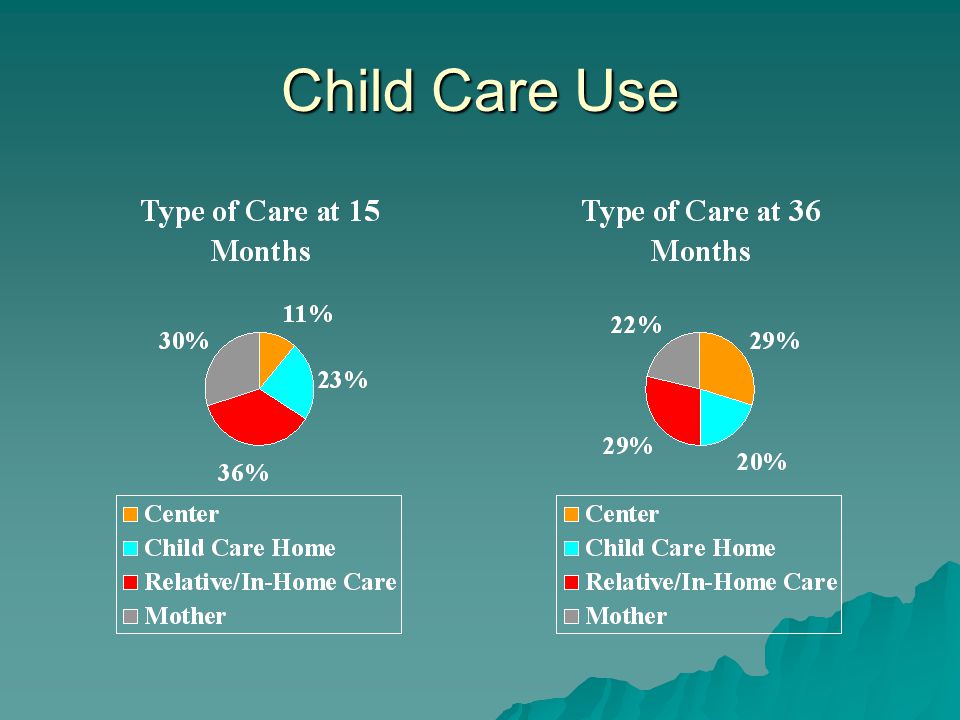
Child Care Use

17
Child Care Use at 54 Months

18
Type of Care at 54 Months

19
What child care characteristics were predictive of better child care quality?

20
OBSERVED CAREGIVING FROM AGES 6 TO 36 MONTHS WAS MOST POSITIVE WHEN… b Group sizes were smaller b Child-adult ratios were smaller (decreasing in importance at 36 months) b Caregivers had more child-centered beliefs about childrearing at all ages, and more education and experience from 15-36 months b Physical environments were safe, clean, and stimulating b Care was provided in an in-home arrangement rather than a child-care center (decreasing in importance at 36 months)
 b Caregivers had more child-centered beliefs about childrearing at all ages, and more education and experience from months b Physical environments were safe, clean, and stimulating b Care was provided in an in-home arrangement rather than a child-care center (decreasing in importance at 36 months)")
21
WHAT IS THE OVERALL QUALITY OF CHILD CARE FOR 1- TO 3-YEAR OLDS IN THE UNITED STATES? NICHDNICHD Extrap ObservedImputed U.S. Observed Caregiving (4-pt scale): (4-pt scale): Poor (< 2 pts) 6% 7% 8% Fair (2 to < 3 pts)51%53%53% Good (3 to < 3.5 pts)32%31%30% Excellent (> 3.5 pts)11% 9% 9%
: (4-pt scale): Poor (< 2 pts) 6% 7% 8% Fair (2 to < 3 pts)51%53%53% Good (3 to < 3.5 pts)32%31%30% Excellent (> 3.5 pts)11% 9% 9%.")
22
Selected results from 0 to 3 years: Number of centers meeting recommended guidelines 6mo. 15mo. 24mo. 36mo. Child-staff ratios36% 20% 26% 56% Small group sizes35% 25% 28% 63% Caregiver education56% 60% 65% 75% Caregiver training65% 69% 77% 80%

23
Does quality and quantity of care affect children’s development? Yes, and Yes! ( More information available on the web at www.rti.org )
.")
24
Selected outcomes Mother-child relationship Social competence, peer relations and behavioral problems Attention and cognitive development Language development School readiness

25
Future directions > Phase I data set (ages 1 through 3 years) currently available on web > Phase II data (4.5 years through first grade) analyses just about complete > Phase II data set to be available October 31, 2002 > Phase III data (3rd to 6th grades) in collection > Phase IV (8 th and 10 th grades) coming up soon!
 currently available on web > Phase II data (4.5 years through first grade) analyses just about complete > Phase II data set to be available October 31, 2002 > Phase III data (3rd to 6th grades) in collection > Phase IV (8 th and 10 th grades) coming up soon!")
26
Additional supplemental slides… Measuring Child care Effects of care on mother- child interaction and Child’s attachment security

27
What did we measure in the child care setting?

28
Measures of the Child Care Context Child Care Context Structural Regulables Structural Regulables Quantity Quantity Stability Stability Quality Quality Type Type Caregiver Characteristics Experience with Peers Caregiver Characteristics Experience with Peers Time of Measurement 6 1524 36 54 Construct

29
Observed Child-Staff Ratio Observed Group Size Age Mix Licensure Structural Characteristics

30
Caregiver Characteristics Education Specialized Training Experience Wages Professionalism Beliefs: Modernity Attitudes about care

31
Quality of Care ORCE (Observational Record of the Caregiving Environment) Child-Care HOME Profile
 Child-Care HOME Profile")
32
QUALITY OF CARE: THE OBSERVATIONAL RECORD OF THE CAREGIVING ENVIRONMENT (ORCE) b Behavioral scales: Frequency counts of specific caregiving acts with the child b Qualitative ratings: Ratings of the quality of the caregiver’s behavior in relation to the child b Four 44-minute cycles of observations b Trained, reliable observers b Observations took place over 2 days, within 2 weeks
 b Behavioral scales: Frequency counts of specific caregiving acts with the child b Qualitative ratings: Ratings of the quality of the caregiver’s behavior in relation to the child b Four 44-minute cycles of observations b Trained, reliable observers b Observations took place over 2 days, within 2 weeks")
33
Quality of Child Care: ORCE Shared positive affect Shared positive affect Positive physical contact Positive physical contact Responds to vocalization/child’s talk Responds to vocalization/child’s talk Speaks positively to child Speaks positively to child Asks questions of child Asks questions of child Other talk to child Other talk to child Stimulates cognitive development/teaches academic skill Facilitates behavior Mutual exchange Mutual exchange Negative/restricting actions (reversed) Negative/restricting actions (reversed) Speaks negatively to child (reversed) Speaks negatively to child (reversed) Child : watching, unoccupied Child : watching, unoccupied
 Negative/restricting actions (reversed) Speaks negatively to child (reversed) Speaks negatively to child (reversed) Child : watching, unoccupied Child : watching, unoccupied")
34
The ORCE Rating Scales Stimulation Stimulation Sensitivity/responsiveness Sensitivity/responsiveness Positive regard Positive regard Detachment/disengagement Detachment/disengagement Flat affect Flat affect Intrusiveness (at 36 months) Intrusiveness (at 36 months) Fosters exploration (at 36 months) Fosters exploration (at 36 months)
 Intrusiveness (at 36 months) Fosters exploration (at 36 months) Fosters exploration (at 36 months)")
35
ORCE RATINGS OF POSITIVE CAREGIVING Ratings were completed at the end of each 44-minute cycle b Sensitivity/responsiveness to nondistressed communication b Stimulation of development b Positive regard b Detachment/disengagement b Flat affect b Intrusiveness (at 36 months) b Fosters exploration (at 36 months )
 b Fosters exploration (at 36 months )")
36
Quality of Home Environment: Mother-child Interaction

37
Does Child Care affect the Mother-Child Relationship? b We measured the mother-child relationship in two ways b Quality of maternal caregiving bChild’s attachment to mother

38
Home Environment Measures Home/Family Context Household Members Household Members Family Structure Family Structure Quality of Family Environment Quality of Family Environment Quality of Mother-child Interaction Quality of Mother-child Interaction Quality of Father-child Interaction Quality of Father-child Interaction Parent Characteristics Parent Characteristics Time of Measurement 1 6 15 24 36 54 1st

39
Quality of Home Environment: HOME (Caldwell & Bradley) Positive involvement Lack of negativity
 Positive involvement Lack of negativity")
40
How we measured the quality of maternal caregiving b Qualitative ratings of mothers’ sensitivity during a 15 minute play procedure b At 6, 15, 24, and 36 months b Coded by reliable observers from videotapes

41
Quality of Home Environment: Mother-child Interaction Ratings from 15 minute video taped interactions: Ratings from 15 minute video taped interactions: Sensitivity to nondistress Detachment Intrusiveness Cognitive stimulation Positive regard Negative regard Child positive engagement

42
How we coded the quality of maternal caregiving b Maternal behavior – sensitivity to nondistress/supportive presence – intrusiveness – stimulation of cognitive development – positive regard – negative regard/hostility – flatness b Child behavior – positive affect (agency) – negativity – engagement of mother – affection for mother
 – negativity – engagement of mother – affection for mother")
43
How we measured the child’s attachment to the mother b Strange Situation laboratory procedure b Secure Attachment: Child re-establishes positive contact with mother following separation b Insecure Attachment: Avoidance of mother or inability to receive comfort from mother

44
What predicted attachment security at 15 months? b Family/child factors – Secure attachment more likely when mothers were better adjusted – Secure attachment more likely when mothers were more sensitive b Child Care factors – No main effect of child care – Interaction: When mothers were less sensitive, and there were more hours of child care, or care that is low-quality, or more than one arrangement=> fewer secure attachments

45
Main findings over the years: Families are using nonmaternal care of various sorts in large, and children are entering into care at an early age. Child care does NOT, in and of itself, affect the child’s attachment to the mother. Parenting has stronger effects on child outcomes than child care experience. By age 54 months, nearly all families are using nonmaternal care, and most, center care. More care in hours per week is associated with –More school readiness –More behavior problems (within normal range)
.")
46
Most exciting for the field… Public availability of the data set Phase I and Phase II now publicly available. Phase III ongoing, but will be available. Phase IV will be funded.

47
Project 2: Barriers to Child Care Subsidy Three studies with Henry Tran and Michelle Harmon Funded by Administration for Children and Families, HHS. Study 1: Fewer than half the low income mothers in Philadelphia were receiving the subsidies to which they were entitled. Study 2: What do parents value in child care? Study 3: So what: is subsidized care any better?

48
Project 3: Participation in the Universities Children’s Policy Collaborative (Research Team for the Early Childhood Task Force)
")
49
Project 3: Universities Children’s Policy Collaborative (UCPC) Penn State University Prevention Research Center – Mark Greenberg Prevention Research Center – Mark Greenberg Early Childhood Training Institute – Rick Fiene Early Childhood Training Institute – Rick Fiene Temple University Center For Public Policy Center For Public Policy Anne Shlay, Marsha Weinraub, Kathy Hirsh- Pasek Anne Shlay, Marsha Weinraub, Kathy Hirsh- Pasek University of Pittsburgh Office of Child Development Office of Child Development Chris Groark, Bob McCall – Co-Directors Chris Groark, Bob McCall – Co-Directors Robert Nelkin – Director of Policy Initiatives Robert Nelkin – Director of Policy Initiatives
 Penn State University Prevention Research Center – Mark Greenberg Prevention Research Center – Mark Greenberg Early Childhood Training Institute – Rick Fiene Early Childhood Training Institute – Rick Fiene Temple University Center For Public Policy Center For Public Policy Anne Shlay, Marsha Weinraub, Kathy Hirsh- Pasek Anne Shlay, Marsha Weinraub, Kathy Hirsh- Pasek University of Pittsburgh Office of Child Development Office of Child Development Chris Groark, Bob McCall – Co-Directors Chris Groark, Bob McCall – Co-Directors Robert Nelkin – Director of Policy Initiatives Robert Nelkin – Director of Policy Initiatives")
50
Projects for the Governor’s Task Force Review of Science-Based Best Practices and Programs in Early Childhood 2002 Pennsylvania Surveys –PA Families with Young Children –PA Education and Child Care Providers Centers Homes –Observations of Classroom Quality in PA –Higher Education Programs in PA

51
. Findings of the 2002 Survey of PA families Two-thirds of Pennsylvania families have their children in a child care arrangement or educational program on a regular weekly basis. The majority of infants under one year of age are cared for by someone other than a parent at least part-time each week. 43% of children under the age of 6 years are in a nonparental arrangement at least 20 hours a week, and 25% for at least 35 hours per week. Similarities across metropolitan, small cities, and rural areas suggest that child care concerns are pervasive across the State.

52
A Preschool Crisis? More than half of Pennsylvania’s 3- and 4- year old children receive no regular educational programming outside the home that would prepare them for school entry. Low-income families and less educated parents are less likely to use such programs than other families. Although 75% of 3 and 4 year-old children were in some type of regular non-parental arrangement, Fewer than half (44%) spend regular time each week in a center-based program that would help them prepare for school entry.
 spend regular time each week in a center-based program that would help them prepare for school entry..")
53
More on preschool… Twenty-five percent of 3 and 4 year-olds are in the exclusive care of their parents 12% of children between 3 and 4 years of age are enrolled in child care centers 19% in preschools 5% in Head Start programs, and 8% in pre-kindergarten or kindergarten programs.

54
Figure 1: Hours per Week that Children Spend in their Care/Education Arrangement Not in care (31%) 1 - 9 hours (15%) 10 - 19 hours (11%) 20 - 34 hours (17%) 35 - 49 hours (21%) 50+ hours (5%)
 hours (15%) hours (11%) hours (17%) hours (21%) 50+ hours (5%)")
55
Figure 2: Age Differences in the Use of Different Care/Education Arrangements Type of Arrangement Program/Center care Out-of-home family child care Non-parental in-home care No non-parental in-home care 60 50 40 30 20 10 0 Child’s age under 1 1 to 2 yrs 2 to 3 yrs 3 to 5 yrs 5 to 6 years Percent of total sample

56
Some High School/ High School Graduate Some college College Graduate/ Post-Graduate Non-parental in-home care Out-of home family child care Program/Center care Parent as family care provider No non-parental care 37% 18% 22% 20% 4% 26% 13% 29% 26% 7% 32% 12% 17% 37% 3% Figure 6: Type of Care/Education Arrangement by Respondent’s Education

57
0 20 40 60 80 Percentages (%) Family members Religious groups Health provider Childcare provider Parenting support group Books/ Magazines Internet Other Type of support Figure 8: Sources of Support Parents Have Used in Past 12 Months
 Family members Religious groups Health provider Childcare provider Parenting support group Books/ Magazines Internet Other Type of support Figure 8: Sources of Support Parents Have Used in Past 12 Months")
58
A lot of responsibility (16.4%) Some responsibility (56.3%) A little responsibility (1.8%) No role/ responsibility (22.3%) Refused (0.1%) Don't know (2.6%) Figure 9: How Much of a Role Should Government Play in Helping Children to Become Reading Ready?
 Some responsibility (56.3%) A little responsibility (1.8%) No role/ responsibility (22.3%) Refused (0.1%) Don t know (2.6%) Figure 9: How Much of a Role Should Government Play in Helping Children to Become Reading Ready")
59
Lab’s future directions Continuing with Phase I and II and III analyses of NICHD data Barriers to child care subsidies continuing UCPC collaboration very fruitful Hope to continue basic research in early personality and social development –Attachment –Parent-child relations

Similar presentations


 Tamara Halle, Nicole Forry, Elizabeth Hair & Kate Perper.>")


