Download presentation
Presentation is loading. Please wait.

1
A New Method for Testing Soil pH Frank Sikora and Paula Howe Division of Regulatory Services IPM Scout Training School March 3, 2010

2
10 cm 3 soil 10 mL Sikora buffer Lime Recommendations with soil-water pH and Sikora buffer pH soil-water pHSikora buffer pH 10 mL water

3
Salt NaCl Na + Cl - KCl K+K+ Cl -

4
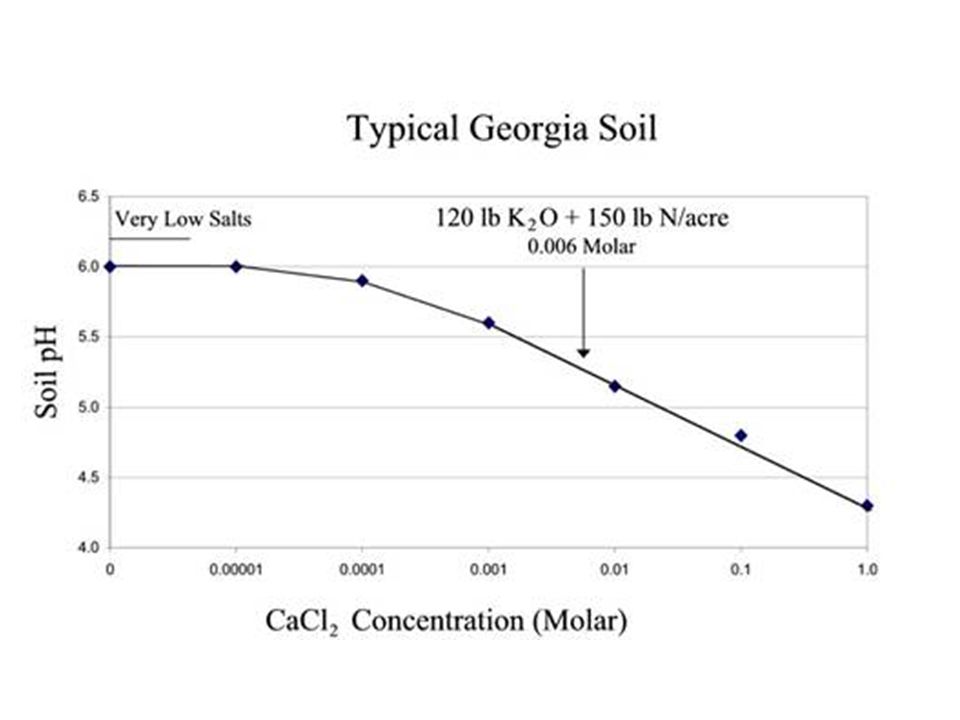
Salt (Ca 2+, Mg 2+, K +, NO 3 - ) Salt (K +, Cl -, NO 3 - )
 Salt (K +, Cl -, NO 3 - )")
5
salt

6
H+H+ K+K+ pHH+H+

10
Average pH for 11 Southeastern KY counties 20052006200720082009

11
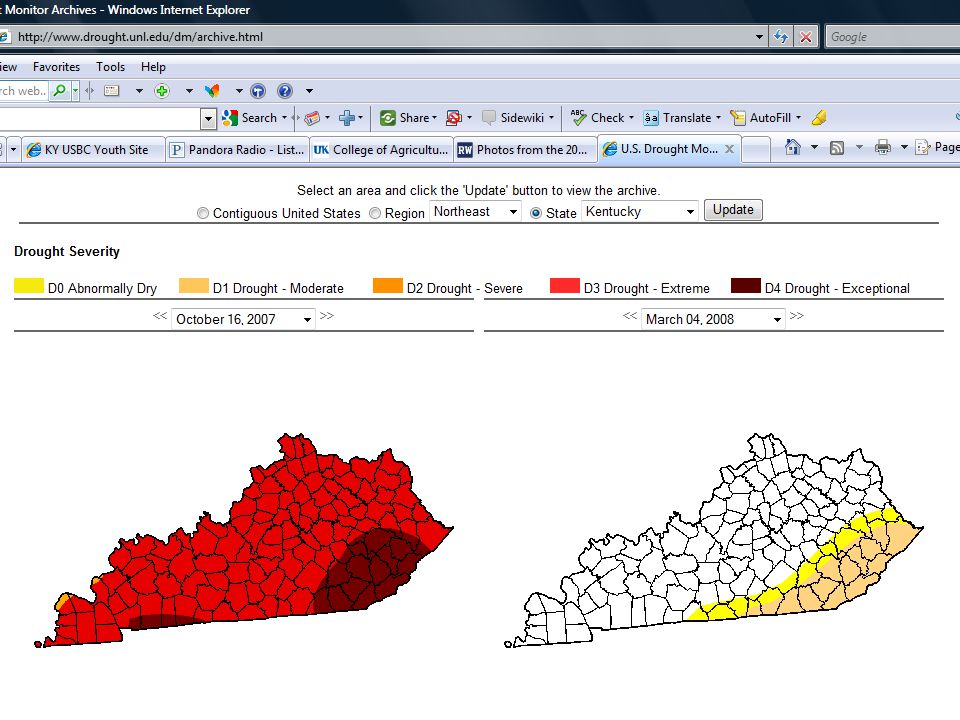
D1 D0 D1 D3 D0 D3 Average pH for 11 Southeastern KY counties

12
Average pH vs Drought Index for 11 Southeastern KY counties

13
10 cm 3 soil 10 mL Sikora buffer Lime Recommendations with 1 M KCl soil pH and Sikora buffer pH 1 M KCl soil pHSikora buffer pH 10 mL 1 M KCl

14
Advantages 1. Solves problem with low pH in fall 2. Improves accuracy of lime recommendation

15
Lime response curve

16
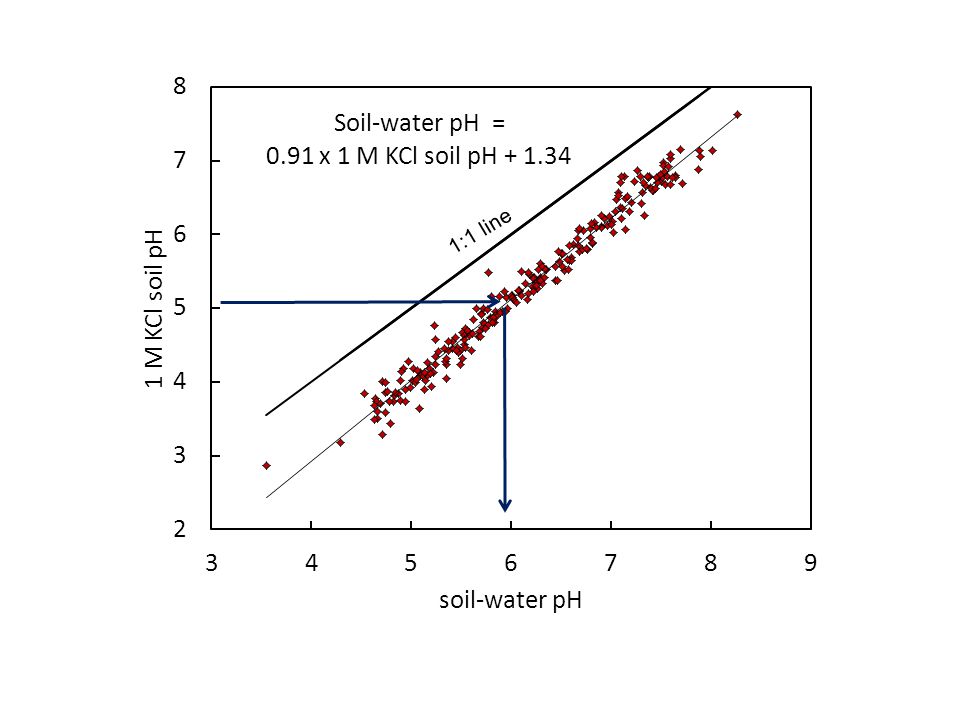
Buffer pH 1 M KCl soil pH

19
buffer pH soil- water pH5.55.75.96.16.36.56.76.9 4.5.4.674.00 3.332.67 2.00 4.7.4.674.00 3.332.67 2.00 4.9.4.674.00 3.332.67 2.00 5.1.4.674.003.33 2.672.00 1.33 5.3.4.674.003.332.67 2.00 1.33 5.5.4.003.33 2.67 2.001.33 5.7.4.003.332.67 2.00 1.33 5.9.3.332.672.00 1.33 0.67 6.1.2.00 1.33 0.67 Kentucky LR table based on soil-water pH and Sikora buffer pH

20
buffer pH 1 M KCl soil pH soil- water pH5.55.75.96.16.36.56.76.9 3.474.5.4.754.253.753.253.002.502.001.75 3.694.7.4.754.253.753.253.002.502.001.50 3.914.9.5.004.253.753.252.752.502.001.50 4.135.1.5.004.003.753.252.752.252.001.50 4.355.3.5.004.003.503.002.502.251.751.25 4.575.5.5.004.003.503.002.502.001.751.25 4.795.7.5.004.003.252.752.252.001.501.00 5.015.9.3.753.002.502.001.501.251.00 5.236.1.2.752.001.501.251.000.50 New LR table based on 1 M KCl soil pH and Sikora II buffer pH

21
Questions?

22
extra

23
pH 8 7 6 5 4 0123456 cmol/kg OH - 0123456 cmol/kg H + 1 M KCl soil pH SMP Typic Fragiudalf silt loam CEC = 7 cmol/kg

24
Empirical correlations Mechanistic approach Lime required Buffer pH Lime added Soil pH 1 M KCl soil pH Buffer pH Lime response curve

25
Lime Recommendations with soil pH and soil-buffer pH Soil-water pH Soil-buffer pH 5.6 6.8

27
Should the same amount of lime be recommended for the two soils below? Soil-water pH Soil-buffer pH 5.6 6.8 4.5 6.8 Soil 1Soil 2

28
Double-buffer method for Lime Recommendations Soil pH Soil-buffer pH 1 5.2 5.4 Soil-buffer pH 2 6.4 These two used to assess pH buffer capacity of soil

29
pH 8 7 6 5 4 0123456 cmol/kg OH - 0123456 cmol/kg H + SMP SMP with initial pH of 6 soil- water pH

30
pH 8 7 6 5 4 0123456 cmol/kg OH - 0123456 cmol/kg H + Sikora = SMP 1 M KCl soil pH = 4.3 Soil-buffer pH = 6.4

31
Target pH = 5.5 Added alkalinity (cmol/kg)
")
32
Lime response curve from 1 M KCl soil pH and Sikora buffer pH Titration of soil with KOH in 1 M KCl Titration of soil with KOH in water

33
1:1 line

34
Fig. 4 1:1 line c) Correction factor for long-term field neutralization LR = Alkalinity to pH 5.5 x Correction Factor LR using 1 M KCl soil pH and Sikora buffer pH (cmol/kg) Current KY LR ---------------------------- 1 M KCl soil pH and Sikora buffer pH LR
 Correction factor for long-term field neutralization LR = Alkalinity to pH 5.5 x Correction Factor LR using 1 M KCl soil pH and Sikora buffer pH (cmol/kg) Current KY LR M KCl soil pH and Sikora buffer pH LR.")
35
Correction factor Current KY LR SMP double buffer LR

36
Data from Thompson, Kissel, Cabrera, and Sonon (2010)
")
37
Lime Recommendations with 1 M KCl soil pH and soil-buffer pH 1 M KCl Soil pH Soil-buffer pH 4.6 6.8 5.5 soil-water pH =

38
1 M KCl soil pH and Sikora buffer pH for Lime Recommendations Advantages 2. Accounts for pH buffer capacity of soil 1. Solves problem with low pH in fall 3. Background electrolyte good for quick and stable pH reading

39
1 M KCl soil pH = 4.0 Soil-buffer pH = 7.0 Target pH = 5.5

40
buffer pH soil- water pH5.55.75.96.16.36.56.76.90 4.5.4.674.00 3.332.67 2.00 4.7.4.674.00 3.332.67 2.00 4.9.4.674.00 3.332.67 2.00 5.1.4.674.003.33 2.672.00 1.33 5.3.4.674.003.332.67 2.00 1.33 5.5.4.003.33 2.67 2.001.33 5.7.4.003.332.67 2.00 1.33 5.9.3.332.672.00 1.33 0.67 6.1.2.00 1.33 0.67 Current LR table based on soil-water pH and Sikora buffer pH

41
Buffer pH response to acid

42
pH 8 7 6 5 4 0123456 cmol/kg H + SMP Buffer pH

43
pH 8 7 6 5 4 0123456 cmol/kg OH - 0123456 cmol/kg H + SMP “Lime response curve”

44
Cut out slides with double buffer explanation

45
pH 8 7 6 5 4 0123456 cmol/kg OH - 0123456 cmol/kg H + SMP SMP with initial pH of 6 Lime requirement for target pH of 6.5

46
pH 8 7 6 5 4 0123456 cmol/kg OH - 0123456 cmol/kg H + SMP SMP with initial pH of 6 Lime requirement for target pH of 6.5 ? ? water pH salt pH

47
Advantages 1) Mechanistic approach for soils of varying buffer capacity 1 M KCl soil pH and Sikora buffer pH for Lime Recommendations 2) Solve problem with lower than expected soil pH during dry falls
 Mechanistic approach for soils of varying buffer capacity 1 M KCl soil pH and Sikora buffer pH for Lime Recommendations 2) Solve problem with lower than expected soil pH during dry falls")
48
1 M KCl soil pH = 4.3 Soil-buffer pH = 6.2 Lime response curve (2 cmol/kg alkalinity = 1 ton/acre CaCO 3 )
")
49
20052006200720082009 Number of samples Average pH for 11 Southeastern KY counties

Similar presentations


 Ch. 15 & 16 - Acids & Bases.>")


 –Addition of fertilizer.>")


 = 4.5 x 10 -4.>")


 If (H + ) = 1 x 10 -3 mol/L (H + ) = 0.001 mol/L pH = - log (1 x 10 -3 ) pH = - (-3)>")