Download presentation
Presentation is loading. Please wait.

1
Lecture 19 Therapeutic Ratio

2
Tumor control probability (TCP) curves:
Calculation of TCP and factors affecting shape and slope of TCP curves Influence of tumor repopulation/regeneration on TCP: Normal tissue complication probability (NTCP) curves Influence of normal tissue regeneration on responses: Response of subclinical disease; Causes of treatment failure; Factors determining tissue tolerance; Normal tissue volume effects (Dose-volume histogram analysis) Effect of adjuvant or combined treatments on therapeutic ratio
 curves. Influence of normal tissue regeneration on responses: Response of subclinical disease; Causes of treatment failure; Factors determining tissue tolerance; Normal tissue volume effects (Dose-volume histogram. analysis) Effect of adjuvant or combined treatments on therapeutic ratio.")
3
Tumor Control Probability (TCP) curves
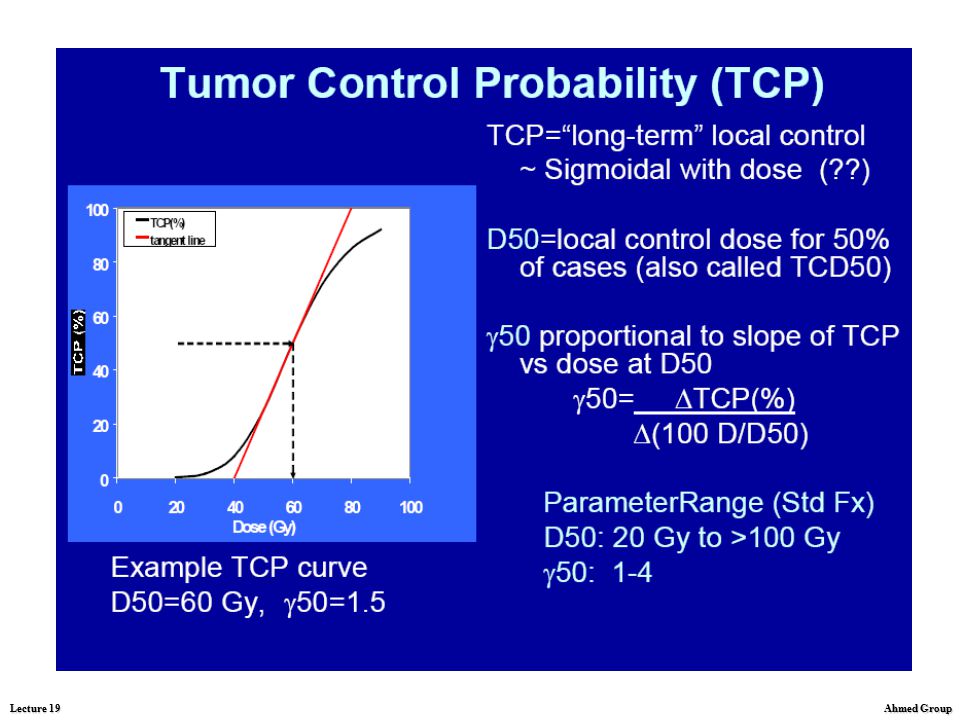
The relationship between total dose and response (e.g. tumor control or normal tissue injury) is threshold-sigmoid. Above a certain threshold tumor control and complication rates increase steeply
 is threshold-sigmoid. Above a certain threshold. tumor control and. complication rates. increase steeply.")
4
Tumor Control Probability (TCP) curves
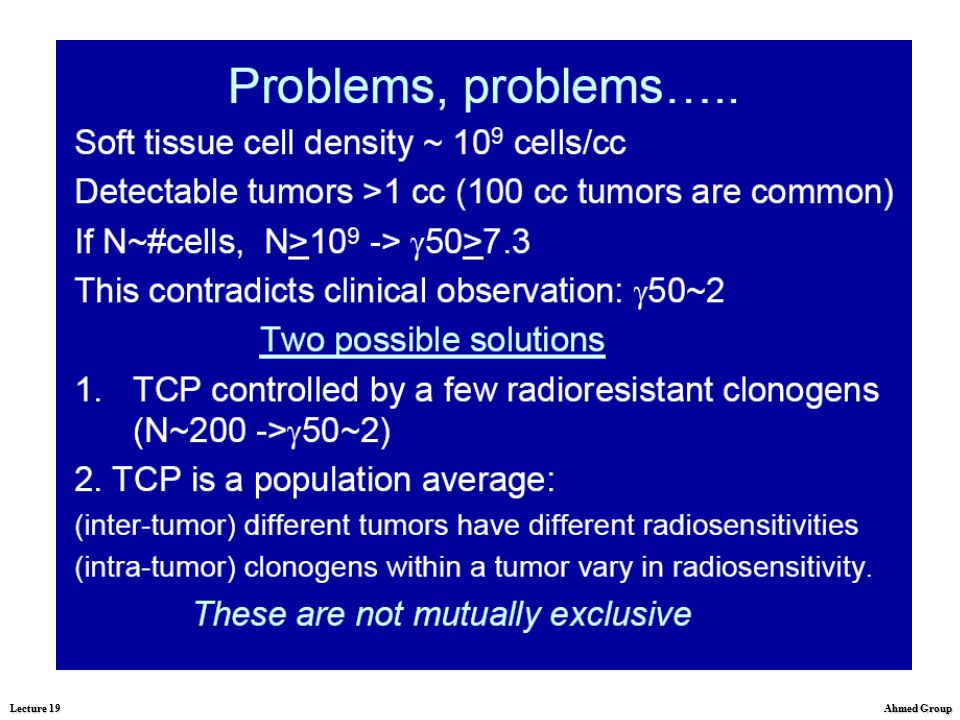
Calculations of TCP The threshold reflects the necessity for reducing survival of tumor clonogens or target cells per functional subunit to less than 1. For tumor control, this may require a reduction in clonogenic cell survival by factors of 109 to 1012. The steepness of the curves in Fig. is greatest between about 10% and 85% being maximal at 37% which corresponds to an average survival of one clonogen per tumor.

5
Tumor Control Probability (TCP) curves
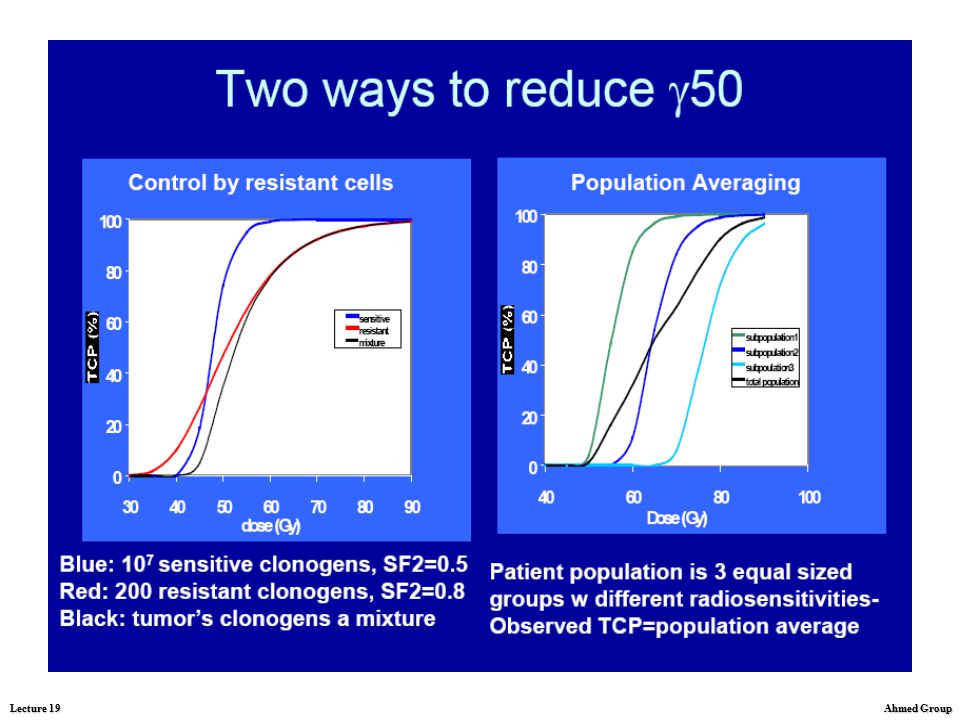
Calculations of TCP When tumor control rates lie between about 10% and 85%, a useful practical description of the slope of the TCP curves is the percentage point change in TCP for a 1% change in tumor dose, the γ-value. The γ-value is determined by clonogen radiosensitivity, the curve being steeper the more sensitive the tumor cells.

6
Tumor Control Probability (TCP) curves
Factors affecting shape and slope of TCP curves The fundamental goal in radiation oncology is to deliver a sufficiently high dose of radiation to sterilize the tumor cells with minimal damage to the surrounding normal tissues, with the ultimate result being complete eradication of the tumor with sufficient normal tissue remaining to ensure viability and function. Problems: interaction of radiation in matter, including cells, tissues and organs, is a nonspecific, random process, with no specificity to tumor cells; radiation delivered from the sources outside the body is absorbed by normal tissues in its path to the tumor, and the damage to the normal cells occurs.

7
Tumor Control Probability (TCP) curves
Factors affecting shape and slope of TCP curves The γ-values derived from the literature average less than 2%, compared with an expected average value of at least 5% based on reasonable estimates of tumor cell radiosensitivity This reflects the enormous heterogeneity of tumor-related and treatment-related factors which may affect the dose required for tumor control. Tumor-related factors include: variations in clonogen content within a given stage of a specific site and histology of the tumor, variations in intrinsic tumor clonogen sensitivity, variability in radiosensitivity related to heterogeneity of oxygenation, variation in the rates of growth of tumors during radiation therapy, which causes variability in the “effective” number of clonogens during sterilization

8
Tumor Control Probability (TCP) curves
Factors affecting shape and slope of TCP curves Treatment-related factors which influence the results of retrospective analyses include: heterogeneity of dose calibration, specification, and distribution (including geographic miss), variations in overall treatment duration, inconsistency of criteria for tumor control, - other factors in the methods of analysis
, variations in overall treatment duration, inconsistency of criteria for tumor control, - other factors in the methods of analysis.")
14
Tumor control probability (TCP) curves:
Calculation of TCP and factors affecting shape and slope of TCP curves Influence of tumor repopulation/regeneration on TCP: Normal tissue complication probability (NTCP) curves Influence of normal tissue regeneration on responses: Response of subclinical disease; Causes of treatment failure; Factors determining tissue tolerance; Normal tissue volume effects (Dose-volume histogram analysis) Effect of adjuvant or combined treatments on therapeutic ratio
 curves. Influence of normal tissue regeneration on responses: Response of subclinical disease; Causes of treatment failure; Factors determining tissue tolerance; Normal tissue volume effects (Dose-volume histogram. analysis) Effect of adjuvant or combined treatments on therapeutic ratio.")
15
Normal tissue complication probability (NTCP) curves
Curves for normal tissue complications are less well-defined than tumor control curves because treatment philosophy is to avoid a high incidence of injury. However, it is likely they are steeper than for tumor control, reflecting less heterogeneity in the biology of normal tissues than that of tumors. Thus, in practice, the curve for tumor control is always likely to be shallower than, and may actually cross that of complications.

16
Normal tissue complication probability
(NTCP) curves
 curves.")
17
Influence of normal tissue regeneration
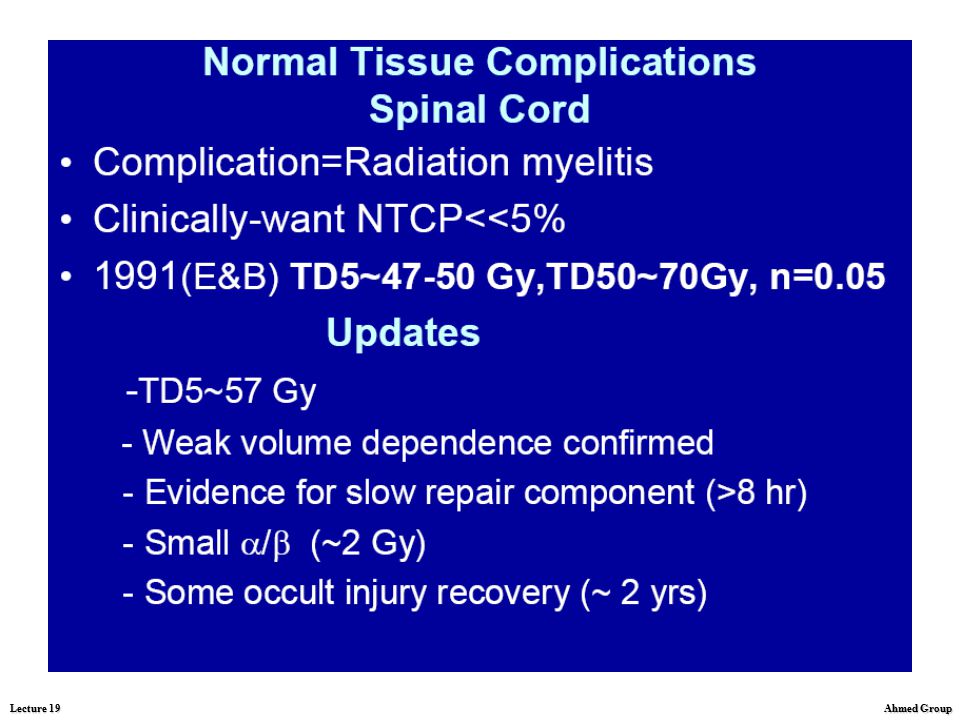
on responses. Normal tissue tolerance. As in the tumor, more cells are killed in the normal tissue as the dose is increased and the probability of damage occuring increases. However, all normal tissues have a limit as to the amount of radiation they can receive and still remain functional; this is defined as Radiation tolerance The amount of radiation used to treat a specific malignant tumor is limited by the tolerance of the surrounding normal tissue, not by the tumor.

18
Influence of normal tissue regeneration
on responses. Tissue tolerance. Many different fractionation and protraction schedules and total doses were used in early years of radiation therapy. In an attempt to correlate these various time-dose relationships with clinical results, Strandqvist reviewed 280 cases of carcinoma for 5 years.

19
Influence of normal tissue regeneration
on responses. Tissue tolerance.

20
Influence of normal tissue regeneration
on responses. Tissue tolerance.

21
Influence of normal tissue regeneration
on responses. Tissue tolerance.

22
IMRT is a technique of radiation delivery
developed to improve target dose conformity and normal tissue sparing. The impact of IMRT delivery time on local tumor control will be discussed on the following slides.

23
Biological indices for IMRT evaluation
and optimization

39
Tumor control probability (TCP) curves:
Calculation of TCP and factors affecting shape and slope of TCP curves Influence of tumor repopulation/regeneration on TCP: Normal tissue complication probability (NTCP) curves Influence of normal tissue regeneration on responses: Response of subclinical disease; Causes of treatment failure; Factors determining tissue tolerance; Normal tissue volume effects (Dose-volume histogram analysis) Effect of adjuvant or combined treatments on therapeutic ratio
 curves. Influence of normal tissue regeneration on responses: Response of subclinical disease; Causes of treatment failure; Factors determining tissue tolerance; Normal tissue volume effects (Dose-volume histogram. analysis) Effect of adjuvant or combined treatments on therapeutic ratio.")
40
Response of subclinical disease

53
Influence of normal tissue regeneration on
responses: Response of subclinical disease The concept of elective radiation therapy for subclinical regional metastatic disease as an adjuvant to definitive treatment of the primary site evolved over time. In the 1960s, Fletcher pointed out that doses of Gy in 2 Gy fractions achieve high rates of control of surgically undisturbed node metastases in head and neck and breast cancer. It has become a generally accepted tenet of radiation therapy that doses of this order are necessary for sterilization of subclinical foci of common epithelial tumors. However, until now, little attention has been paid to defining more completely the dose- response relationship for control of subclinical metastases. The dose-response of subclinical metastases is shown on the next slide.

54
Influence of normal tissue regeneration on
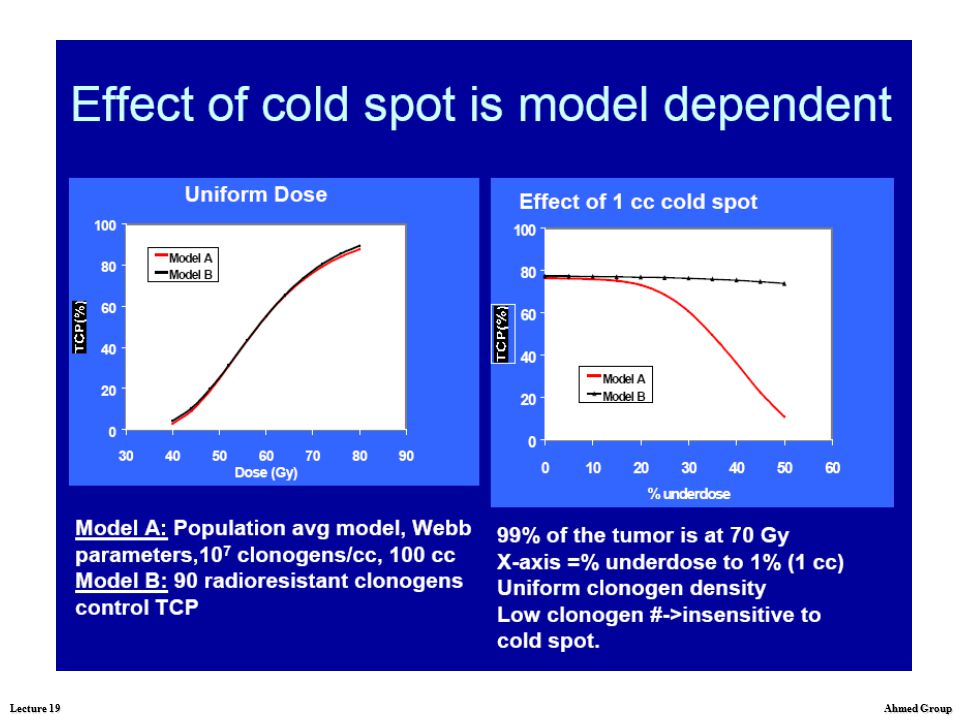
responses: Response of subclinical disease Subclinical disease control probability model results consistently show, for a wide range of radiobiological parameters, that TCP models applied to regions of suspected subclinical disease probably overestimate the detrimental effect of volumes of depressed dose (“cold spots”). Nevertheless, any cold spot with dose less than about Gy degrades the expected level of subclinical disease control; Increasing dose to greater than about Gy shows a greatly diminished return on disease control per unit dose for regions of suspected subclinical disease compared to gross disease;
. Nevertheless, any cold spot with dose less than about Gy degrades the expected level of subclinical disease control; Increasing dose to greater than about Gy shows a greatly diminished return on disease control per unit dose for regions of suspected subclinical disease compared to gross disease;")
55
Influence of normal tissue regeneration on
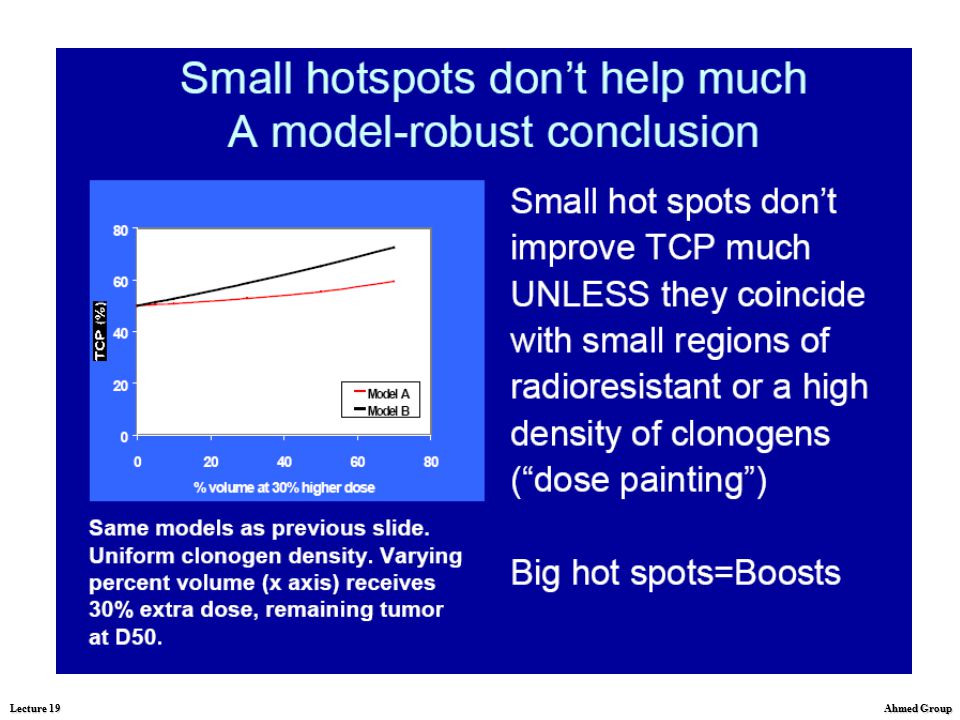
responses: Response of subclinical disease Comparison of treatment plans which include tradeoffs between the quality of radiation dose distributed to the gross disease and the quality of the radiation dose distribution to regions of suspected subclinical disease cannot be reliably ranked solely using TCP models developed for gross disease. Cold spots are expected to affect local control less for sites of suspected subclinical disease compared to gross disease for two reasons: there is some probability that the cold spot will not contain any metastatic focii, even if focii are present elsewhere, and also many micrometastatic focii will have very small numbers of clonogens, which are controlled even with relatively low doses.

56
Tolerance Dose “Tolerance dose” is an elastic value which varies with the nature of the complication, prognosis, wishes of the patient, and usually other considerations specific to each clinical situation. “Tolerance dose” is not a fixed value. For example, in treating a patient with early cancer of the head and neck, a dose yielding any incidence of myelitis is beyond tolerance, whereas in certain unusual situations, a high probability of myelitis may be tolerated, e.g. by a patient with a solitary focus of tumour compressing the lumbar cord. “Tolerance dose” has no place in experimental animal radiobiology, and should be reserved for its very flexible clinical application. In experimental condition, it is possible to define a threshold sigmoid dose response curve and refer to doses which produce a certain incidence of an effect, e.g. the ED20 or ED50 are doses which yield a 20% or 50% incidence of the effect under study.

57
Tolerance Dose Dose control and complication curves in curable and noncurable tumors treated with radiotherapy. The percentages of tumor control and normal tissue damage are sigmoidal. In a radiocurable tumor, such as Hodgkin's disease, the dose required to control a tumor is less than the normal tissue tolerance. This results in a favorable therapeutic ratio. The dosage required to control an unfavorable tumor, such as pancreatic carcinoma, is approximately that of the normal tissue tolerance, resulting in an unfavorable therapeutic ratio.

58
The goal of radiotherapy, then, although dependent on cellular and tissue response in both the tumor and the normal tissue, is ultimately dependent on normal tissue response if complications are to be avoided (which may result in a cure no better than, and possibly worse than, the disease.

59
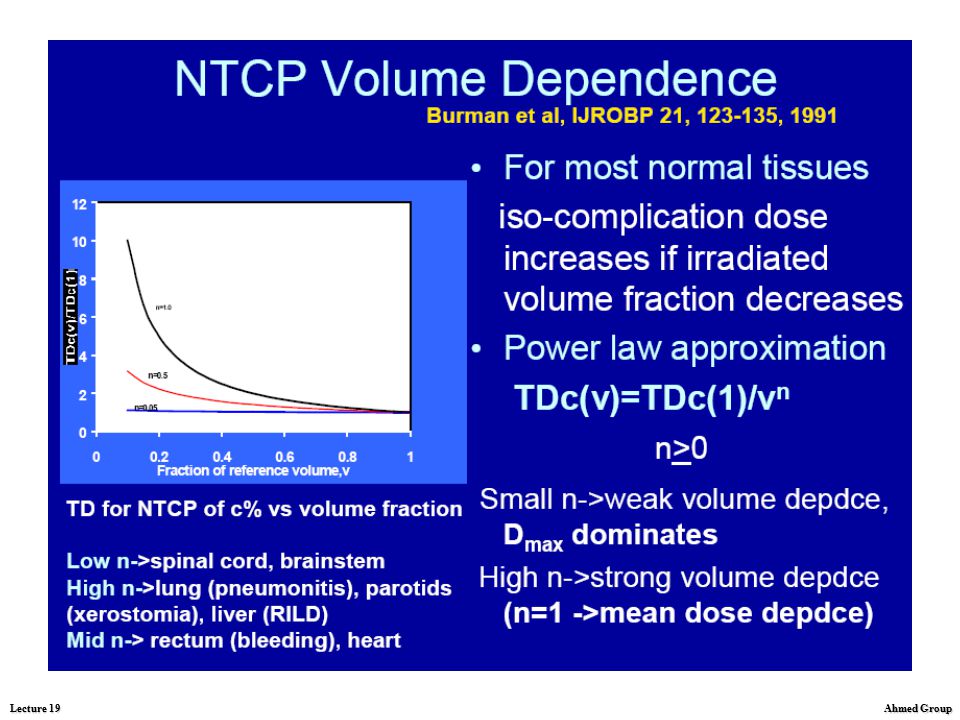
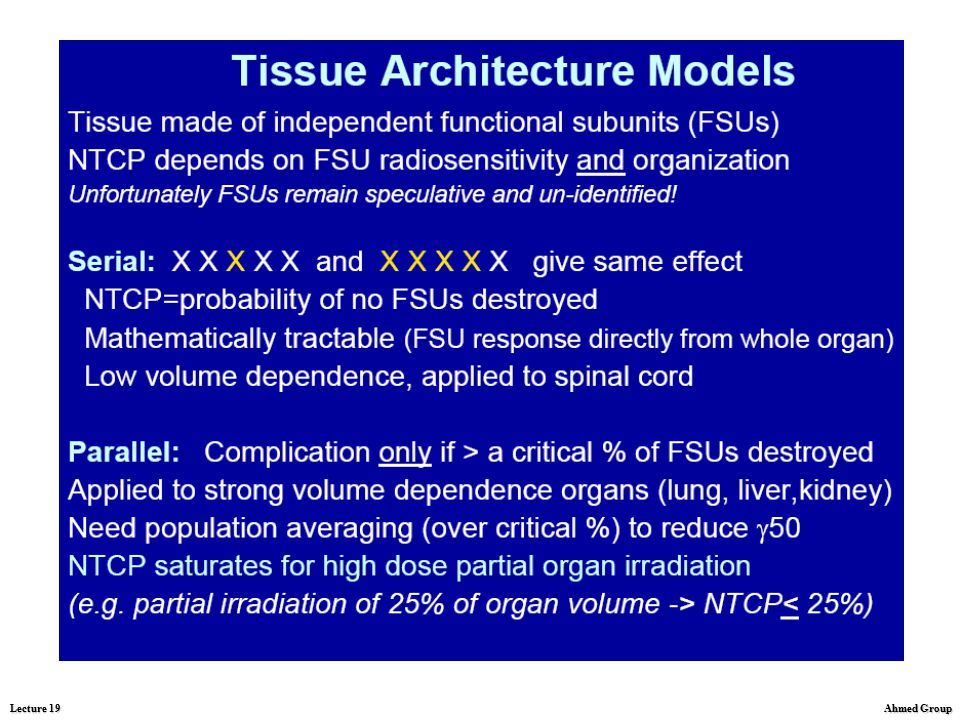
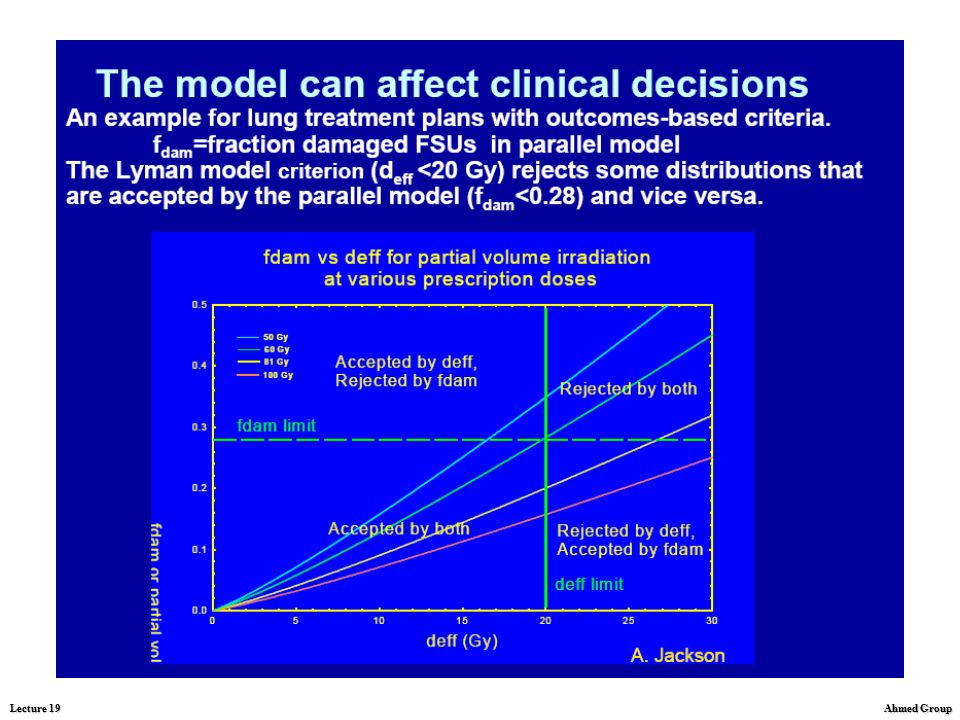
Normal tissue volume effects
The relationship between the volume treated and the tolerance of normal tissues, called the volume effect, is a powerful factor in determining tumor control probability. There is currently much interest in understanding and modelling the volume effect because of its central importance especially in 3D planning. The volume effect is a rapidly evolving topic.

60
Dose-volume histograms
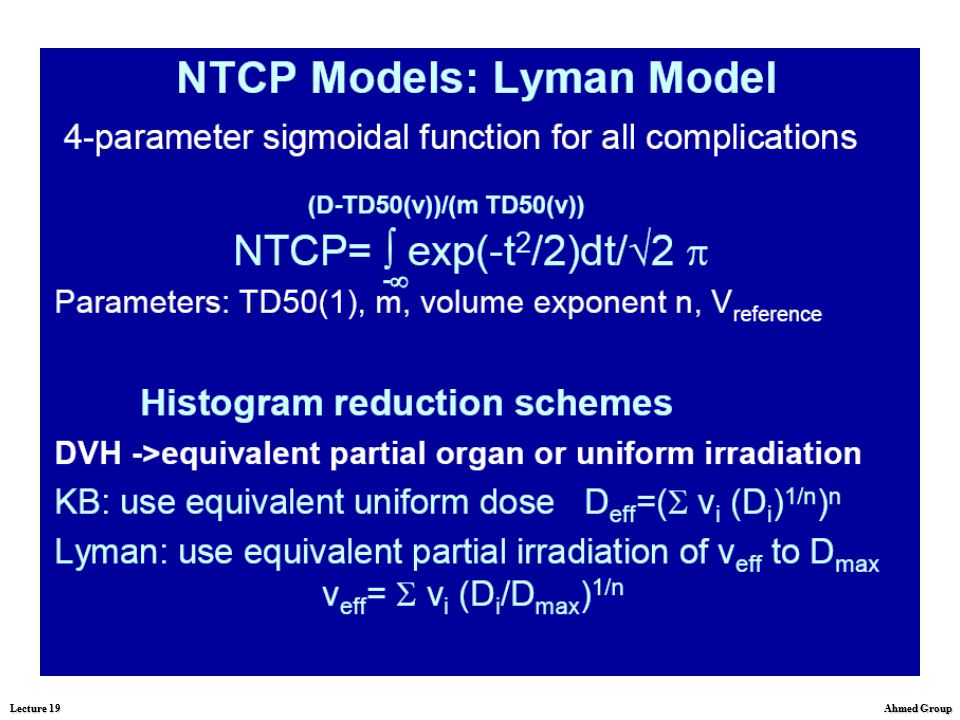
Current methods for calculating the normal tissue complication probability use various models for reducing the dose-volume histogram of the organ of interest to an equivalent dose-volume step function. These methods reduce the spatial information about dose distribution. For example two distinct hot spots can yield a DVH identical to a single hot spot of equal volume. Furthermore the dose limits physicians recommend are usually of the type "no more than x gray, to no more than y percentile of the organ".

61
Dose-volume histograms
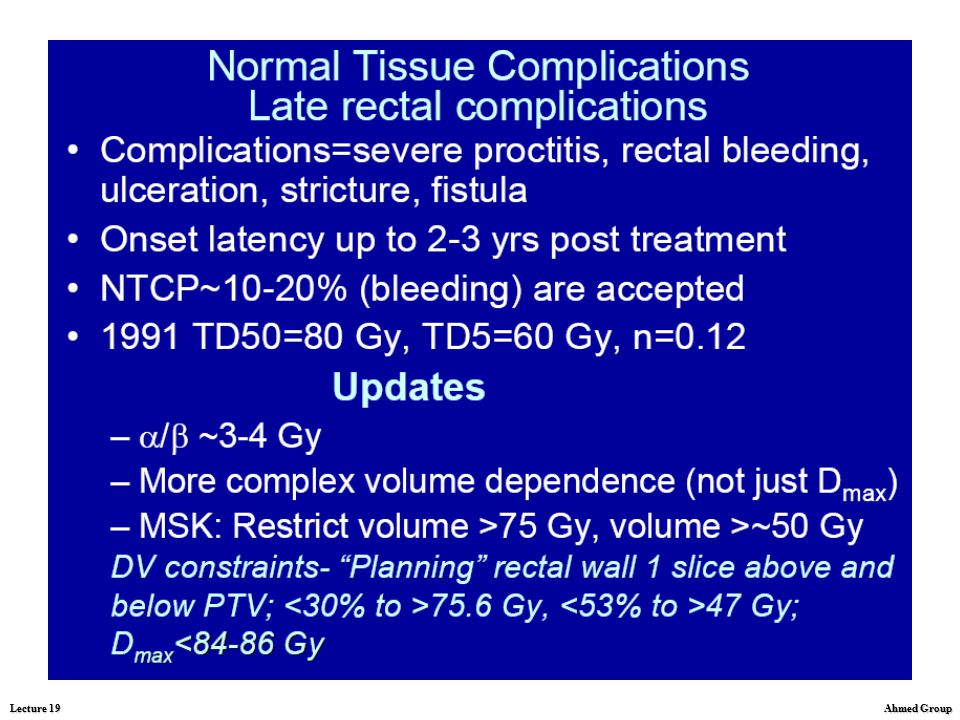
If we treat the prostate to a normal size dose, 70 Gy or 7,000 rads, what is going to be our dose to the rectum with this type of technology? And as you can see from here, we use a thing called a dose volume histogram. Well, what volume of the rectum will get a dose above a certain area? As you can see here, the dose above 75 Gy is only 3.3% of the rectum. But what if we escalate even higher to 90 Gy, how much of the rectum will be radiated? Knowing from the literature that we can probably treat almost 20% of the rectum to greater than 75 Gy? And you can see from this slide that only 13.8% of the rectum received greater than 75 Gy.

62
Dose-volume histograms
What if we escalate the dose to 90 gray, what would be the amount of rectum that we would treat, that would get greater than 75 Gy, or 7,500 rads? And as you can see here, with this type of conformal radiation intensity modulated radiation therapy, only 13.8% of the rectum would get that much dose. So this is a technology that would allow us to deliver higher doses of radiation.

63
Dose-volume histograms, examples
Dose–volume histograms for (a) prostate only, (b) intraprostatic tumour nodule (IPTN) boost and (c) dominant IPTN boost techniques.
 prostate only, (b) intraprostatic tumour nodule (IPTN) boost and (c) dominant IPTN boost techniques.")
64
Tumor control probability (TCP) curves:
Calculation of TCP and factors affecting shape and slope of TCP curves Influence of tumor repopulation/regeneration on TCP: Normal tissue complication probability (NTCP) curves Influence of normal tissue regeneration on responses: Response of subclinical disease; Causes of treatment failure; Factors determining tissue tolerance; Normal tissue volume effects (Dose-volume histogram analysis) Effect of adjuvant or combined treatments on therapeutic ratio
 curves. Influence of normal tissue regeneration on responses: Response of subclinical disease; Causes of treatment failure; Factors determining tissue tolerance; Normal tissue volume effects (Dose-volume histogram. analysis) Effect of adjuvant or combined treatments on therapeutic ratio.")
65
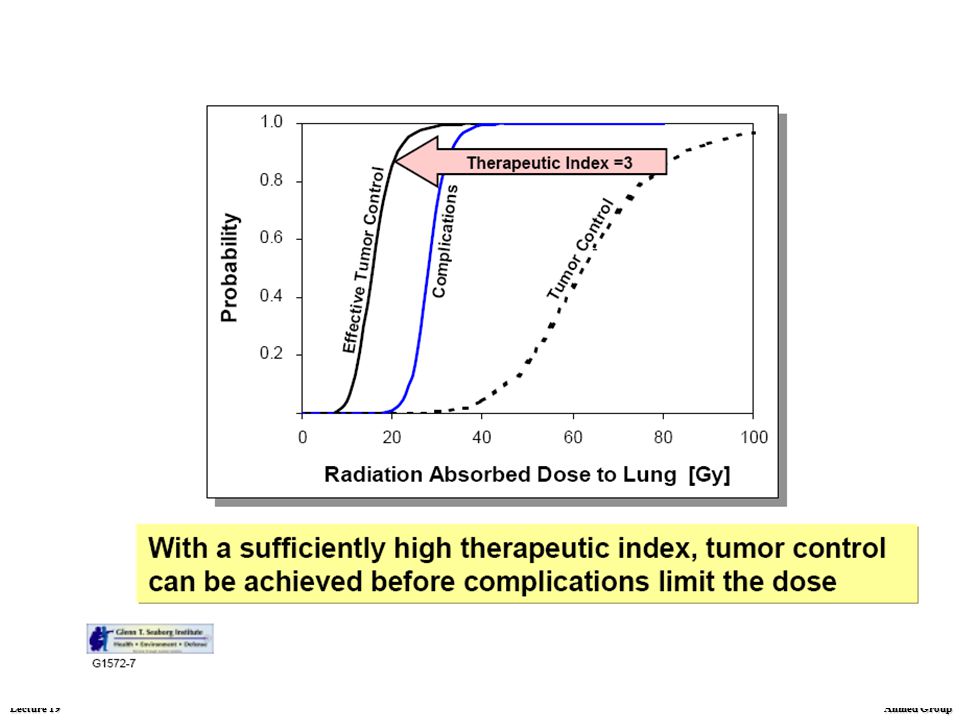
Therapeutic ratio Although both the probability of tumor control
and normal tissue damage are dose dependent, it is the difference in dose for the two situations that determines treatment outcome. This is termed the therapeutic ratio. Hypothetical dose-response relationships for the probability of tumor control and normal tissue damage are shown.

66
Therapeutic ratio The ideal situation is when
the dose-response curve for damage in the critical normal tissue sits well to the right to higher total doses) than that for tumor control. In this case, the dose that gives a 90% probability of tumor cure may give less than 10% probability of normal tissue damage. Unfortunately, in most cases the two dose-response curves lie close to each other.
 than that. for tumor control. In this case, the dose that gives a 90% probability of tumor cure may. give less than 10% probability. of normal tissue damage. Unfortunately, in most cases. the two dose-response curves. lie close to each other.")
67
Dose response and therapeutic ratio
Various levels of radiation yield different tumor-control probabilities, depending on the size and anatomic extent of the lesion. The total number of surviving cells is proportional to the initial number and biologic characteristics of clonogenic cells and the total cell kill achieved with a specified dose of radiation. Dose-response relationships for local control of homogeneous tumor groups have been empirically determined. The higher the doses of radiation delivered, the more likely is tumor control. The dose of radiation that can be delivered to a tumor is limited by the probability of serious normal tissue complications. Therefore, the choice of a tumor dose is based on the relative probability of tumor control and normal tissue complications. The potential therapeutic gain can be estimated for an average group of patients on the basis of tumor size, histologic type, and the normal tissues that will be included in the treatment fields.

68
Effects of adjuvant or combined treatments on therapeutic ratio
The radiation oncologist today is looking for an avenue to increase tumor control. One possible pathway to take is the dose escalation. Dose escalation would be the deposition of even higher doses of radiation therapy into the target to hope for the probability of increased tumor control. With new delivery systems in radiation oncology, a lot of people feel there is promise to dose escalation in controlling tumors. The other avenue that we can possibly take is the interaction of radiation therapy with biological agents such as gene therapy, or other adjuvants.

69
Effects of adjuvant or combined treatments on therapeutic ratio
A more common use of RT is in combination with surgery and/or chemotherapy. When combined with surgery, RT may be given prior to (preoperative), following (postoperative), or during (intraoperative) surgery. Although common in the past, preoperative RT is less used today except in large borderline resectable tumors, for example, rectal cancer and soft tissue sarcomas. In contrast, postoperative RT is used in many tumor sites including tumors of the central nervous system, head and neck, breast, lung, genitourinary, and gastrointestinal tract. In patients with resectable disease, postoperative RT is preferred because it allows treatment to be tailored to the pathology findings, and higher doses are possible. Moreover, there is reduced potential for interference in normal wound healing. Indications for postoperative RT include close/positive margins, residual disease, and lymph node involvement. Potential disadvantages of postoperative RT include delaying therapy until wound healing is complete and reduced vascularity of tissues following surgery.
, following (postoperative), or during (intraoperative) surgery. Although common in the past, preoperative RT is less used today except in large borderline resectable tumors, for example, rectal cancer and soft tissue sarcomas. In contrast, postoperative RT is used in many tumor sites including tumors of the central nervous system, head and neck, breast, lung, genitourinary, and gastrointestinal tract. In patients with resectable disease, postoperative RT is preferred because it allows treatment to be tailored to the pathology findings, and higher doses are possible. Moreover, there is reduced potential for interference in normal wound healing. Indications for postoperative RT include close/positive margins, residual disease, and lymph node involvement. Potential disadvantages of postoperative RT include delaying therapy until wound healing is complete and reduced vascularity of tissues following surgery.")
70
Effects of adjuvant or combined treatments on therapeutic ratio
Intra-operative RT is the delivery of a single large fraction during surgery with either electrons or low energy photons. This is accomplished with either a dedicated treatment machine in the operating room or by transporting the patient to the RT department during surgery. An important benefit is that normal tissues, for example small bowel, can be displaced out of the treatment field. A disadvantage is that the total treatment is delivered in a single fraction which obviates the benefit of fractionation. Promising results have been reported in retroperitoneal soft tissue sarcoma. Brachytherapy has also been used at the time of surgery. It is imperative, however, to delay loading for several days to allow for adequate wound healing.

71
Effects of adjuvant or combined treatments on therapeutic ratio
When combined with chemotherapy, chemotherapy may be administered prior to (neo-adjuvant), during (concomitant) or following RT (maintenance). Chemo-radiotherapy approaches have been shown to improve local control and eradicate micro-metastatic disease. Neo-adjuvant chemotherapy has been used in a number of sites including early stage non-Hodgkin's lymphoma and small cell lung cancer. A potential advantage is that bulky disease sites can be cyto-reduced allowing for smaller treatment volumes. However, increasing evidence suggests that concomitant chemo-radiotherapy is preferable in a variety of disease sites. Concomitant chemo-radiotherapy is used in locally advanced cancer of the lung, head and neck, esophagus, bladder, and cervix. Possible interactions between chemotherapeutic drugs and radiation are summarized on the next slide.
, during (concomitant) or following RT (maintenance). Chemo-radiotherapy approaches have been shown to improve local control and eradicate micro-metastatic disease. Neo-adjuvant chemotherapy has been used in a number of sites including early stage non-Hodgkin s lymphoma and small cell. lung cancer. A potential advantage is that bulky disease sites can be cyto-reduced allowing for smaller treatment volumes. However, increasing evidence suggests that concomitant chemo-radiotherapy is preferable in a variety of disease sites. Concomitant chemo-radiotherapy is used in locally advanced cancer of the lung, head and neck, esophagus, bladder, and cervix. Possible interactions between chemotherapeutic drugs and radiation are summarized on the next slide.")
72
Effects of adjuvant or combined treatments on therapeutic ratio
Interaction of radiotherapy and chemotherapy - Decreased tumor cell repopulation following fractionated radiation due to effects of chemotherapy - Increased tumor cell recruitment from G0 into a therapy-responsive cell cycle phase - Increased tumor cell oxygenation following radiation with improved drug or radiation activity - Improved drug delivery with shrinkage of tumor - Early eradication of tumor cells preventing emergence of drug and/or radiation resistance - Eradication of cells resistant to one treatment modality by the other treatment - Cell cycle synchronization - Inhibition of repair of sublethal radiation damage or inhibition of recovery from potentially lethal radiation damage

Similar presentations


. What is cancer? Failure of the mechanisms that control growth and proliferation of the cells Uncontrolled (often rapid) growth.>")


: The optimal indication for operable tumors in inoperable patients D.Katsochi 1, S.Kosmidis 1, A.Fotopoulou.>")


