Download presentation
Presentation is loading. Please wait.

1
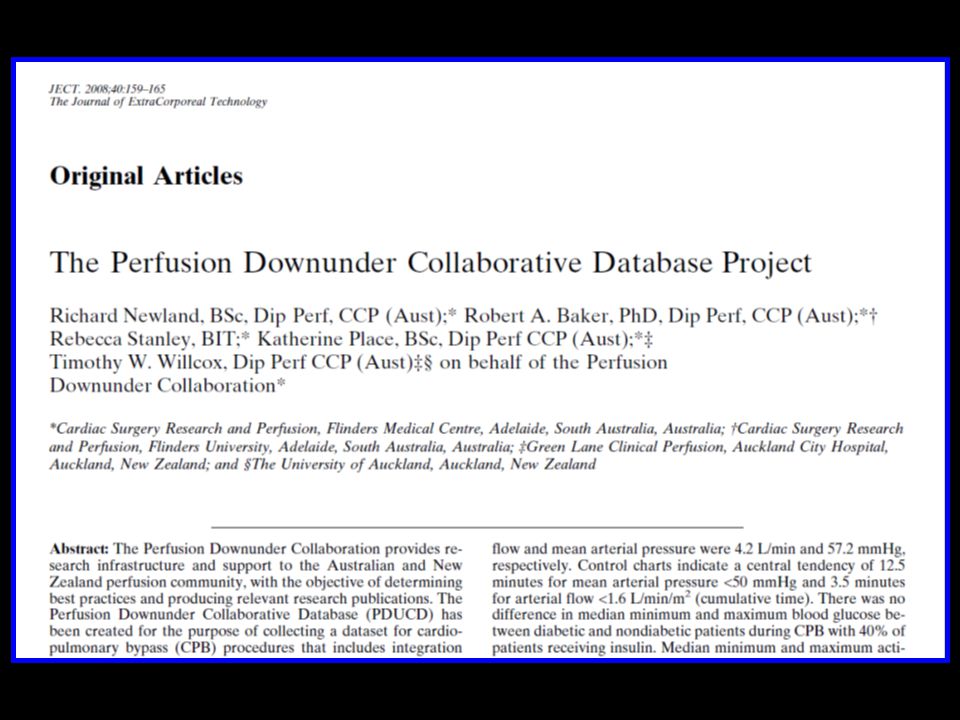
The Perfusion Downunder Collaboration: Leveraging Our Data Rob Baker* & Richard Newland On behalf of the Perfusion Downunder Collaboration *Director Cardiac Surgery Research and Perfusion Flinders Medical Centre and Flinders University, Bedford Park, South Australia. Perfusion Downunder Collaboration

2
COI’s / Disclosures Travel and Research support in the last 12 months –Medtronic –Cellplex Pty Ltd –Terumo Corporation

4
Perfusion Downunder Collaboration A collaborative network of perfusion and interested researchers, who share the commitment to cooperation and collaboration in the pursuit of excellence in perfusion.

5
Who is the PDUC?

6
PDUC Mission Statement To foster and grow high quality research in the perfusion sciences by the establishment and maintenance of a prospective data set on cardiac surgical procedures performed in centres throughout Australia and New Zealand.

7
Perfusion Downunder Collaboration Understand and quantify our practice Quality improvement Research

10
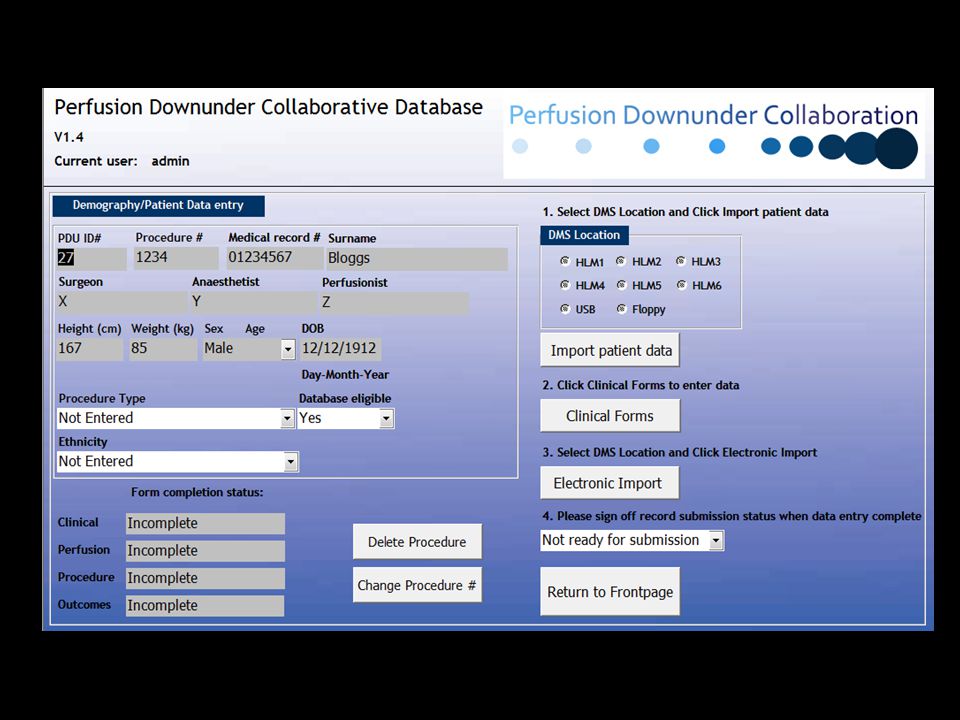
HLM software (DMS or JOCAP) PDU Database PDU Transfer Database De-identified Central PDU Database PDU Collaborative Database
 PDU Database PDU Transfer Database De-identified Central PDU Database PDU Collaborative Database")
11
2007 - Current: Recruitment & Data

12
Dataset (n=7769) Total records imported (April 2011) Adult isolated CABG/ Valve/ Valve + CABG (n=7364) (n=5465) Jan 2007 - Feb 2011 294 after censor date 111 missing date of surgery 111 missing age 22 age <18
 Total records imported (April 2011) Adult isolated CABG/ Valve/ Valve + CABG (n=7364) (n=5465) Jan Feb after censor date 111 missing date of surgery 111 missing age 22 age <18")
13
Dataset Demography –Age, Sex, Weight etc Clinical –Urgency, Clinical history etc Perfusion and quality indicators –Bypass time, management, monitoring etc –Electronic data variables (continuous and calculated) Procedure –Number of grafts, valve replacement etc Outcomes –Length of stay, complications etc
 Procedure –Number of grafts, valve replacement etc Outcomes –Length of stay, complications etc")
14
Risk factors and Demographics PDUC 2007-08 ASCTS 2007- 08* PDUC 2008-09 ASCTS 2008-09 PDUC 2009-10 ASCTS 2009- 10* PDUC 2010-11 PDUC Total Number of patients11912629128626921530274014585465 Risk Factors%%%% Current Smoker1614111514 1514 Diabetes2829 30273028 Hypertension6871647268736867 Cerebrovascular disease9131013101410 Family history of heart disease 35403436 Hypercholesterolaemia63 656263 Previous cardiac intervention 17191721192118 Congestive heart failure25 162113221516 MI before surgery^3420272025202628 Male7475**747074727374 Age > 60687271727172 71 Euroscore5.96.46.16.46.2 * Based on the ASCTS Cardiac surgery in Victorian public hospitals 2009–10 public report (data reported from Victorian hospitals only). **approximate ^ MI – myocardial infarction, <21 days (ASCTS) or <90days (PDUC)
 or <90days (PDUC).")
15
Risk Factors: Core Procedures

16
Euroscore: Core Procedures 2007-2011

17
Postoperative outcomes PDUC 2007-08 PDUC 2008-09 PDUC 2009-10 PDUC 2010-11 PDUC Total %%% Stroke1.61.11.81.71.6 New renal failure2.622.12.52.3 Myocardial infarction2.21.71.811.6 Reoperation7.64.65.57.16.1 Ventilation > 24 hrs11.313.815.7 14.2 30 day mortality2.73.41.42.4

18
We are interested in what is not in other databases (ie Perfusion variables) and relating practices to outcomes:
 and relating practices to outcomes:")
19
Components of the Circuit Venous Reservoir Type Pump Type

20
Biopassive circuit coating Coated circuit use Circuit coating:type Oxygenator coating

21
Monitoring Blood gas monitoring Cerebral oximetry BIS monitoring

22
Clinical incidents Accidents reported to PIRS: 56.5% Near misses reported to PIRS: 37% Incidents Near misses PIRS reports

23
23 (Cummulative %) Exposure to RBC transfusion
 Exposure to RBC transfusion")
24
Blood management utilisation OverallBy site

25
ICU blood loss (n=2890, 384 cases missing data)(introduced nov 2007. n=2259, 393 cases missing data) 1 st 4 hoursTotal
 1 st 4 hoursTotal.")
26
Continuous and Electronic data Quality indicators –haemoglobin <70 g/dl –blood glucose > 10 mmol –arterial temperature >37C for >2 min –arterial pressure 5 minutes –cardiac index 5 minutes –venous saturation 5 minutes –pCO 2 45 mmHg –pO 2 <100 mmHg Multi-insitutional Level

27
Art P 5 min

28
CI 5 min

30
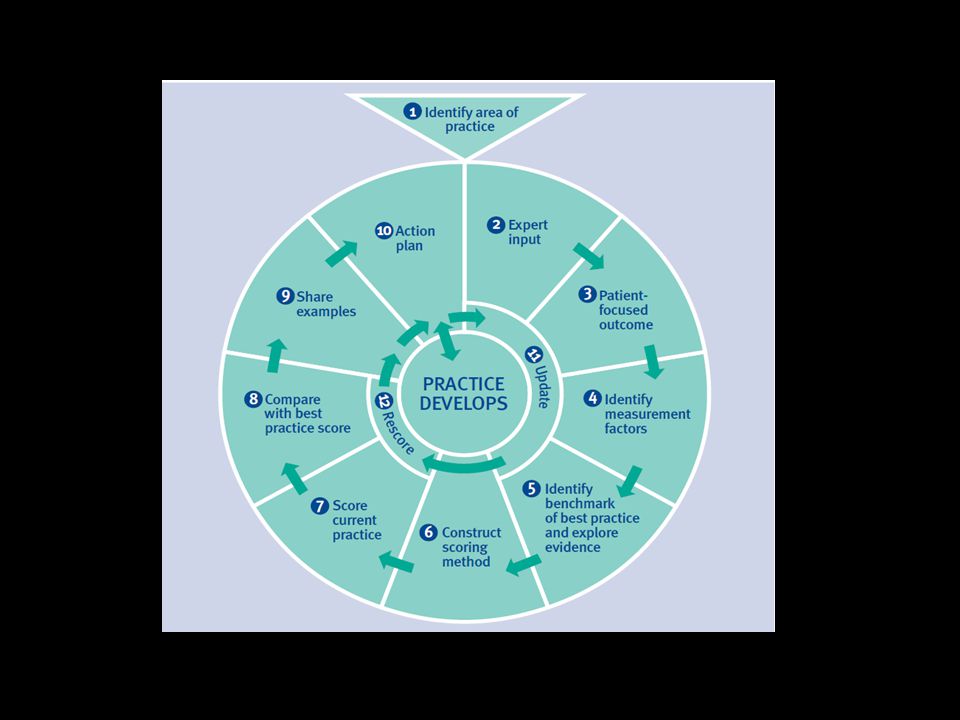
Defining benchmarking? “Concept of using a structured method of quality measurement and improvement” “Process of measuring performance using one or more specific indicators to compare activity with others”

31
Methods - Benchmarks Quality Indicators –Chosen Evidence / guidelines Consensus –arterial outlet temperature > 37 o C –blood glucose 10 mmol/l –pCO 2 45 mmHg Achievable Benchmarks of Care –Weissman et al 1999 J Eval Clin Pract 5;269-281

32
Avoidance of Hyperthermia Limiting arterial line temperature to 37C might be useful for avoiding cerebral hyperthermia. (Class 1a, Level B) “Coupled temperature” ports for all oxygenators should be checked for accuracy and calibrated.
 Coupled temperature ports for all oxygenators should be checked for accuracy and calibrated..")
33
but

34
pH Management The clinical team should manage adult patients undergoing moderate hypothermic CPB with alphastat pH management. (Class I, Level A)
.")
35
Calculate adjusted performance fraction (APF) APF = (x + 1)/(d + 2) Rank centres in order of performance for a specific quality indicator Create subset comprising top 10% best-performing centres, add centres until a subset represents at least 10% of the entire dataset is established Calculate benchmark based on subset as follows: Total number of patients in subset receiving recommended intervention Total number of patients in subset Weissman et al 1999 J Eval Clin Pract 5;269-281 Calculating benchmarks with paired-mean method
 APF = (x + 1)/(d + 2) Rank centres in order of performance for a specific quality indicator Create subset comprising top 10% best-performing centres, add centres until a subset represents at least 10% of the entire dataset is established Calculate benchmark based on subset as follows: Total number of patients in subset receiving recommended intervention Total number of patients in subset Weissman et al 1999 J Eval Clin Pract 5; Calculating benchmarks with paired-mean method")
36
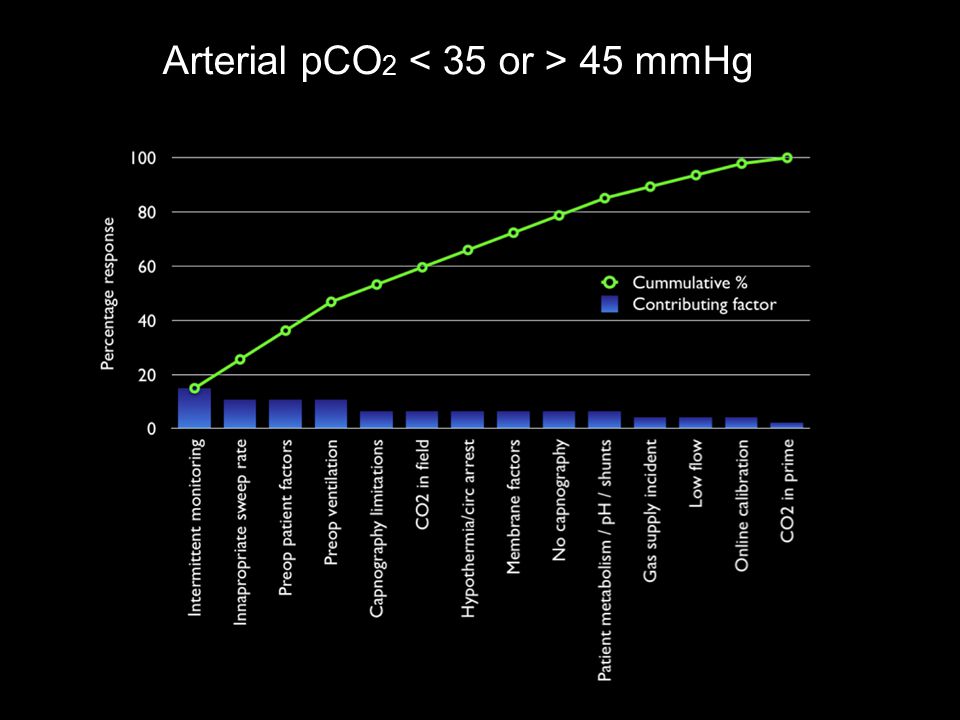
20.3% Arterial pCO 2 45 mmHg

39
Arterial outlet temperature > 37 o C 6.2% Percentage of Patients

40
Factors

41
Arterial outlet temperature > 37 o C

42
Cummulative site performance

44
Next steps - making the transition from measurement to improvement Identified areas of practice to benchmark based on established guidelines Quantified our practice as a baseline for improvement Identified modifiable factors as a focus for QI initiatives Define / Measure / Analyse / Improve / Control

45
Next steps - making the transition from measurement to improvement Identified areas of practice to benchmark based on established guidelines Quantified our practice as a baseline for improvement Identified modifiable factors as a focus for QI initiatives Define / Measure / Analyse Share information on current practices

46
Next steps - making the transition from measurement to improvement Disseminate information to teams Develop improvement initiatives Audit practice (using PDUCD) Improve / Control Audit and compare group practice data Feedback data for periodic discussion Local PDUC
 Improve / Control Audit and compare group practice data Feedback data for periodic discussion Local PDUC")
47
Thankyou

Similar presentations


 Trial>")


>")


