Download presentation
Presentation is loading. Please wait.

1
Sumeet Subherwal, Richard G. Bach, Anita Y. Chen, Brian F. Gage, Sunil V. Rao, Tracy Y. Wang, W. Brian Gibler, E. Magnus Ohman, Matthew T. Roe, Eric D. Peterson, Karen P. Alexander The CRUSADE Bleeding Score to Assess Baseline Risk of Major Bleeding in Non–ST- Segment Elevation Myocardial Infarction

2
Sumeet Subherwal, MD, 1 Richard G. Bach, MD, 1 Anita Y. Chen, MS, 1 Brian F. Gage, MD, MSc, 1 Sunil V. Rao, MD, 1 Tracy Y. Wang, MS, 1 W. Brian Gibler, MD, 2 E. Magnus Ohman, MD, 2 Matthew T. Roe, MD, MHS, 2 Eric D. Peterson, MD, MPH, 3 Karen P. Alexander, MD, 4 1 No relationships to disclose 2 Research grants from Bristol-Myers Squibb/Sanofi Pharmaceuticals Partnership and Schering Corporation 3 Research grants from Bristol-Myers Squibb, Bristol-Myers Squibb/Sanofi Pharmaceuticals Partnership; Bristol-Myers Squibb/Merck and Bristol-Myers Squibb/Merck 4 Research grants from CV Therapeutics, Honoraria from Schering Plough and Pfizer Author Disclosure

3
n Treatment with antithrombotics and catheter-based interventions reduces ischemic events in patients with non–ST-segment elevation myocardial infarction (NSTEMI) but at an increased risk of major bleeding n Major bleeding is associated with worse clinical outcomes n Given the impact of both safety (bleeding) and efficacy (ischemia) on patient outcomes, global risk stratification may enhance patient management n Treatment with antithrombotics and catheter-based interventions reduces ischemic events in patients with non–ST-segment elevation myocardial infarction (NSTEMI) but at an increased risk of major bleeding n Major bleeding is associated with worse clinical outcomes n Given the impact of both safety (bleeding) and efficacy (ischemia) on patient outcomes, global risk stratification may enhance patient management Background
 but at an increased risk of major bleeding n Major bleeding is associated with worse clinical outcomes n Given the impact of both safety (bleeding) and efficacy (ischemia) on patient outcomes, global risk stratification may enhance patient management n Treatment with antithrombotics and catheter-based interventions reduces ischemic events in patients with non–ST-segment elevation myocardial infarction (NSTEMI) but at an increased risk of major bleeding n Major bleeding is associated with worse clinical outcomes n Given the impact of both safety (bleeding) and efficacy (ischemia) on patient outcomes, global risk stratification may enhance patient management Background")
4
n Validated risk stratification tools predict baseline risk of ischemic events l TIMI, PURSUIT, GRACE ACS Risk Score n Current estimation of baseline risk of bleeding in NSTEMI is difficult because existing risk stratification tools: l include treatment variables (i.e. antithrombotics or invasive procedures) l derived from highly selected patient populations n Validated risk stratification tools predict baseline risk of ischemic events l TIMI, PURSUIT, GRACE ACS Risk Score n Current estimation of baseline risk of bleeding in NSTEMI is difficult because existing risk stratification tools: l include treatment variables (i.e. antithrombotics or invasive procedures) l derived from highly selected patient populations Background
 l derived from highly selected patient populations n Validated risk stratification tools predict baseline risk of ischemic events l TIMI, PURSUIT, GRACE ACS Risk Score n Current estimation of baseline risk of bleeding in NSTEMI is difficult because existing risk stratification tools: l include treatment variables (i.e. antithrombotics or invasive procedures) l derived from highly selected patient populations Background.")
5
To develop and validate a risk prediction tool for estimation of baseline risk of in-hospital major bleeding in patients with NSTEMI. Purpose

6
n CRUSADE Quality Improvement Initiative l February 15, 2003 to December 31, 2006 l n=89,134 NSTEMI patients at 485 US hospitals Excluded unstable angina, home warfarin, transfer out, deaths within 48 hours n In-hospital Major Bleeding l Absolute HCT drop of ≥ 12% (Baseline HCT - Nadir HCT ≥ 12%) l Intracranial hemorrhage l Witnessed retroperitoneal bleed l RBC transfusion when Baseline HCT ≥ 28% l RBC transfusion when Baseline HCT < 28% with witnessed bleed n Major bleeding censored at time of CABG n CRUSADE Quality Improvement Initiative l February 15, 2003 to December 31, 2006 l n=89,134 NSTEMI patients at 485 US hospitals Excluded unstable angina, home warfarin, transfer out, deaths within 48 hours n In-hospital Major Bleeding l Absolute HCT drop of ≥ 12% (Baseline HCT - Nadir HCT ≥ 12%) l Intracranial hemorrhage l Witnessed retroperitoneal bleed l RBC transfusion when Baseline HCT ≥ 28% l RBC transfusion when Baseline HCT < 28% with witnessed bleed n Major bleeding censored at time of CABG Methods
 l Intracranial hemorrhage l Witnessed retroperitoneal bleed l RBC transfusion when Baseline HCT ≥ 28% l RBC transfusion when Baseline HCT < 28% with witnessed bleed n Major bleeding censored at time of CABG n CRUSADE Quality Improvement Initiative l February 15, 2003 to December 31, 2006 l n=89,134 NSTEMI patients at 485 US hospitals Excluded unstable angina, home warfarin, transfer out, deaths within 48 hours n In-hospital Major Bleeding l Absolute HCT drop of ≥ 12% (Baseline HCT - Nadir HCT ≥ 12%) l Intracranial hemorrhage l Witnessed retroperitoneal bleed l RBC transfusion when Baseline HCT ≥ 28% l RBC transfusion when Baseline HCT < 28% with witnessed bleed n Major bleeding censored at time of CABG Methods")
7
n Randomly assigned into derivation (n=71,277, 80% of total N) and validation cohorts (n=17,857, 20% of total N) n Explored univariate relationships between potential predictors and the outcome of major bleeding n Incorporated variables with a clinically important and statistically significant univariate association with major bleeding into a multivariable model l Logistic generalized estimating equations (GEE) method accounted for in-hospital clustering n The predictive performance of the model was assessed by calculating c-statistics and comparing observed vs. predicted probability plots n Randomly assigned into derivation (n=71,277, 80% of total N) and validation cohorts (n=17,857, 20% of total N) n Explored univariate relationships between potential predictors and the outcome of major bleeding n Incorporated variables with a clinically important and statistically significant univariate association with major bleeding into a multivariable model l Logistic generalized estimating equations (GEE) method accounted for in-hospital clustering n The predictive performance of the model was assessed by calculating c-statistics and comparing observed vs. predicted probability plots Statistical Analysis
 and validation cohorts (n=17,857, 20% of total N) n Explored univariate relationships between potential predictors and the outcome of major bleeding n Incorporated variables with a clinically important and statistically significant univariate association with major bleeding into a multivariable model l Logistic generalized estimating equations (GEE) method accounted for in-hospital clustering n The predictive performance of the model was assessed by calculating c-statistics and comparing observed vs. predicted probability plots Statistical Analysis.")
8
Variable Derivation Cohort (N = 71,277) Validation Cohort (N = 17,857) Age (years)*67.0 (56.0, 79.0) Male60.2%60.3% Family history of CAD33.9% History of hypertension70.5%70.6% Diabetes mellitus32.7%32.5% Prior vascular disease†18.4%18.1% Current/recent smoker28.4%27.8% Hyperlipidemia52.0%51.7% Prior myocardial infarction28.1%27.9% Prior CABG18.2%18.5% Baseline HCT (%)*40.7 (36.5, 44.2)40.7 (36.6, 44.1) CrCl (mL/min)*‡70.3 (43,8, 101.9)70.8 (44.0, 102.0) In-Hospital Events Death > 48 hrs 2.7%2.6% Major bleeding9.4%9.6% *Median (25 th, 75 th percentile) †Prior vascular disease defined as h/o stroke or peripheral arterial disease ‡ Creatinine clearance as estimated by Cockcroft-Gault Formula Baseline Characteristics
 Validation Cohort (N = 17,857) Age (years)*67.0 (56.0, 79.0) Male60.2%60.3% Family history of CAD33.9% History of hypertension70.5%70.6% Diabetes mellitus32.7%32.5% Prior vascular disease†18.4%18.1% Current/recent smoker28.4%27.8% Hyperlipidemia52.0%51.7% Prior myocardial infarction28.1%27.9% Prior CABG18.2%18.5% Baseline HCT (%)*40.7 (36.5, 44.2)40.7 (36.6, 44.1) CrCl (mL/min)*‡70.3 (43,8, 101.9)70.8 (44.0, 102.0) In-Hospital Events Death > 48 hrs 2.7%2.6% Major bleeding9.4%9.6% *Median (25 th, 75 th percentile) †Prior vascular disease defined as h/o stroke or peripheral arterial disease ‡ Creatinine clearance as estimated by Cockcroft-Gault Formula Baseline Characteristics")
9
Prior vascular disease defined as h/o stroke or peripheral arterial disease Note: Heart rate is truncated @ 90 mL/min Variable 22 Derivation Cohort OR 95% CI Validation Cohort OR 95% CI Baseline HCT <36% (vs. ≥ 36%)434.62.282.11-2.462.171.92-2.44 CrCl (per 10 mL/min decrease)433.21.121.10-1.131.111.09-1.13 Heart rate (per 10 bpm increase)159.21.081.07-1.101.091.07-1.12 Female77.81.311.23-1.391.331.19-1.50 Signs of heart failure37.71.231.15-1.311.131.01-1.28 Prior vascular disease30.41.191.12-1.271.100.98-1.24 Diabetes mellitus26.61.161.10-1.231.251.12-1.40 SBP ≤ 110 mm Hg (vs. 110-180)12.61.261.16-1.361.271.10-1.47 SBP ≥ 180 mm Hg (vs. 110-180)1.241.14-1.351.181.02-1.37 c-Statistic0.720.71 Multivariable Predictors of Bleeding
 CrCl (per 10 mL/min decrease) Heart rate (per 10 bpm increase) Female Signs of heart failure Prior vascular disease Diabetes mellitus SBP ≤ 110 mm Hg (vs ) SBP ≥ 180 mm Hg (vs ) c-Statistic Multivariable Predictors of Bleeding.")
10
CRUSADE Bleeding Score n The CRUSADE Bleeding Score was developed by assigning a weighted integer to each independent predictor based on the predictor’s coefficient in the reduced regression model n The CRUSADE Bleeding Score equals the sum of the weighted integers for the independent predictors l Range 1-100 points n The CRUSADE Bleeding Score was developed by assigning a weighted integer to each independent predictor based on the predictor’s coefficient in the reduced regression model n The CRUSADE Bleeding Score equals the sum of the weighted integers for the independent predictors l Range 1-100 points

11
Score Nomogram CRUSADE Bleeding Score Nomogram Note: Heart rate is truncated @ 90 mL/min; Prior Vascular disease is defined as prior PAD or strokePredictorRangeScore Baseline Hematocrit (%) < 31 31-33.9 34-36.9 37-39.9 ≥ 40 9732097320 Creatinine Clearance (mL/min) ≤ 15 >15-30 >30-60 >60-90 >90-120 >120 39 35 28 17 7 0 Heart rate (bpm) ≤ 70 71-80 81-90 91-100 101-110 111-120 ≥ 121 0 1 3 6 8 10 11 Sex Male Female 0808 Signs of CHF at presentation No Yes 0707 Prior Vascular Disease No Yes 0606 Diabetes Mellitus No Yes 0606 Systolic blood pressure (mm Hg) ≤ 90 91-100 101-120 121-180 181-200 ≥ 201 10 8 5 1 3 5
 < ≥ Creatinine Clearance (mL/min) ≤ 15 >15-30 >30-60 >60-90 > > Heart rate (bpm) ≤ ≥ Sex Male Female 0808 Signs of CHF at presentation No Yes 0707 Prior Vascular Disease No Yes 0606 Diabetes Mellitus No Yes 0606 Systolic blood pressure (mm Hg) ≤ ≥")
12
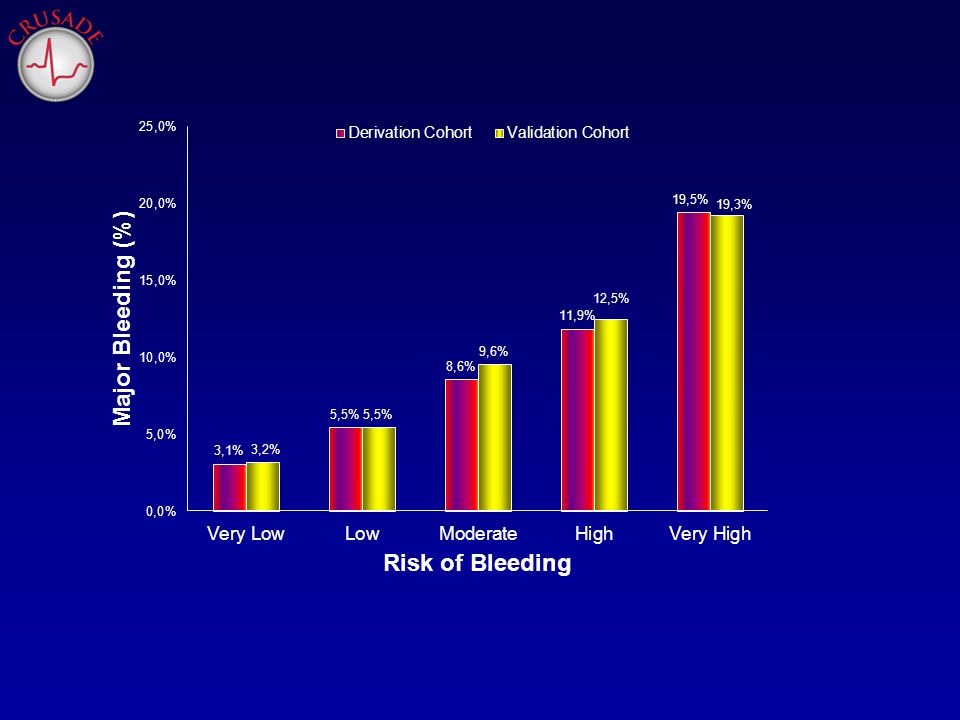
Risk of Major Bleeding Across the Spectrum of CRUSADE Bleeding Score p<0.001 for trend; Derivation: C=0.71 Validation: C=0.70

13
Risk Quintiles n Patients were categorized into quintiles of risk groups based on their CRUSADE Bleeding Score RiskNMin ScoreMax ScoreBleeding Very low19,4861203.1% Low12,54521305.5% Moderate11,53031408.6% High10,961415011.9% Very High15,210519119.5%

14
Subgroup Analysis Performance of the Bleeding Score was tested across four treatment subgroups in the derivation cohort defined by in- hospital antithrombotics and invasive care: Performance of the Bleeding Score was tested across four treatment subgroups in the derivation cohort defined by in- hospital antithrombotics and invasive care: 1.≥2 Antithrombotic medications (anti-platelet [aspirin or clopidogrel], anti-coagulant, or GP IIb/IIIa inhibitors) (n=50,969) 2.<2 Antithrombotic medications (anti-platelet, anti-coagulant, or GP IIb/IIIa inhibitors) (n=5,931) 3.Cardiac catheterization (n=52,048) 4.No cardiac catheterization (n=6,407) Performance of the Bleeding Score was tested across four treatment subgroups in the derivation cohort defined by in- hospital antithrombotics and invasive care: Performance of the Bleeding Score was tested across four treatment subgroups in the derivation cohort defined by in- hospital antithrombotics and invasive care: 1.≥2 Antithrombotic medications (anti-platelet [aspirin or clopidogrel], anti-coagulant, or GP IIb/IIIa inhibitors) (n=50,969) 2.<2 Antithrombotic medications (anti-platelet, anti-coagulant, or GP IIb/IIIa inhibitors) (n=5,931) 3.Cardiac catheterization (n=52,048) 4.No cardiac catheterization (n=6,407)
![Subgroup Analysis Performance of the Bleeding Score was tested across four treatment subgroups in the derivation cohort defined by in- hospital antithrombotics and invasive care: Performance of the Bleeding Score was tested across four treatment subgroups in the derivation cohort defined by in- hospital antithrombotics and invasive care: 1.≥2 Antithrombotic medications (anti-platelet [aspirin or clopidogrel], anti-coagulant, or GP IIb/IIIa inhibitors) (n=50,969) 2.<2 Antithrombotic medications (anti-platelet, anti-coagulant, or GP IIb/IIIa inhibitors) (n=5,931) 3.Cardiac catheterization (n=52,048) 4.No cardiac catheterization (n=6,407) Performance of the Bleeding Score was tested across four treatment subgroups in the derivation cohort defined by in- hospital antithrombotics and invasive care: Performance of the Bleeding Score was tested across four treatment subgroups in the derivation cohort defined by in- hospital antithrombotics and invasive care: 1.≥2 Antithrombotic medications (anti-platelet [aspirin or clopidogrel], anti-coagulant, or GP IIb/IIIa inhibitors) (n=50,969) 2.<2 Antithrombotic medications (anti-platelet, anti-coagulant, or GP IIb/IIIa inhibitors) (n=5,931) 3.Cardiac catheterization (n=52,048) 4.No cardiac catheterization (n=6,407)](http://images.slideplayer.com/12/3512199/slides/slide_14.jpg "Subgroup Analysis Performance of the Bleeding Score was tested across four treatment subgroups in the derivation cohort defined by in- hospital antithrombotics and invasive care: Performance of the Bleeding Score was tested across four treatment subgroups in the derivation cohort defined by in- hospital antithrombotics and invasive care: 1.≥2 Antithrombotic medications (anti-platelet [aspirin or clopidogrel], anti-coagulant, or GP IIb/IIIa inhibitors) (n=50,969) 2.<2 Antithrombotic medications (anti-platelet, anti-coagulant, or GP IIb/IIIa inhibitors) (n=5,931) 3.Cardiac catheterization (n=52,048) 4.No cardiac catheterization (n=6,407) Performance of the Bleeding Score was tested across four treatment subgroups in the derivation cohort defined by in- hospital antithrombotics and invasive care: Performance of the Bleeding Score was tested across four treatment subgroups in the derivation cohort defined by in- hospital antithrombotics and invasive care: 1.≥2 Antithrombotic medications (anti-platelet [aspirin or clopidogrel], anti-coagulant, or GP IIb/IIIa inhibitors) (n=50,969) 2.<2 Antithrombotic medications (anti-platelet, anti-coagulant, or GP IIb/IIIa inhibitors) (n=5,931) 3.Cardiac catheterization (n=52,048) 4.No cardiac catheterization (n=6,407)")
15
1.9 3.1 2.6 5.5 5.3 8.4 6.7 12.0 19.9 13.5 p<0.001 testing for trend Rate of Major Bleeding in <2 Antithrombotics vs. 2 or more Antithrombotics Note: Anti-thrombotic defined as (anti-platelet [aspirin or clopidgorel], anti-coagulant, or GP IIb/IIIa inhibitors) Risk Of Bleeding 0 5 10 15 20 25 Major Bleeding (%) Very LowLowModerateHighVery High <2 Antithrombotics2 or more Antithrombotics
 Risk Of Bleeding Major Bleeding (%) Very LowLowModerateHighVery High <2 Antithrombotics2 or more Antithrombotics.")
16
2.6 3.1 4.6 5.5 7.2 13.3 23.1 15.1 6.6 8.7 Rate of Major Bleeding in Catheterization vs. No Catheterization p<0.001 testing for trend Risk Of Bleeding 0 5 10 15 20 25 Major Bleeding )%) Very LowLowModerateHighVery High No CatheterizationCatheterization
%) Very LowLowModerateHighVery High No CatheterizationCatheterization.")
17
Limitations Only baseline factors were considered in development of the CRUSADE Bleeding Score Only baseline factors were considered in development of the CRUSADE Bleeding Score C-index would have been higher if we included post admission treatments and their contribution to risk C-index would have been higher if we included post admission treatments and their contribution to risk History of prior bleeding or bleeding diathesis was not collected History of prior bleeding or bleeding diathesis was not collected Did not capture bleeding events: Did not capture bleeding events: Excluded patients that died within 48 hours Excluded patients that died within 48 hours Censored bleeding at the time of CABG Censored bleeding at the time of CABG Only baseline factors were considered in development of the CRUSADE Bleeding Score Only baseline factors were considered in development of the CRUSADE Bleeding Score C-index would have been higher if we included post admission treatments and their contribution to risk C-index would have been higher if we included post admission treatments and their contribution to risk History of prior bleeding or bleeding diathesis was not collected History of prior bleeding or bleeding diathesis was not collected Did not capture bleeding events: Did not capture bleeding events: Excluded patients that died within 48 hours Excluded patients that died within 48 hours Censored bleeding at the time of CABG Censored bleeding at the time of CABG

19
Conclusion The CRUSADE Bleeding Score combines 8 predictors of major bleeding into a simple validated prediction tool that estimates baseline risk of in-hospital major bleeding in patients with NSTEMI The CRUSADE Bleeding Score combines 8 predictors of major bleeding into a simple validated prediction tool that estimates baseline risk of in-hospital major bleeding in patients with NSTEMI Preserved discrimination across treatment subgroups Preserved discrimination across treatment subgroups Complements ischemic risk prediction tools to better enable clinicians to consider all the potential adverse outcomes in patients with NSTEMI prior to initiation of therapy Complements ischemic risk prediction tools to better enable clinicians to consider all the potential adverse outcomes in patients with NSTEMI prior to initiation of therapy The CRUSADE Bleeding Score combines 8 predictors of major bleeding into a simple validated prediction tool that estimates baseline risk of in-hospital major bleeding in patients with NSTEMI The CRUSADE Bleeding Score combines 8 predictors of major bleeding into a simple validated prediction tool that estimates baseline risk of in-hospital major bleeding in patients with NSTEMI Preserved discrimination across treatment subgroups Preserved discrimination across treatment subgroups Complements ischemic risk prediction tools to better enable clinicians to consider all the potential adverse outcomes in patients with NSTEMI prior to initiation of therapy Complements ischemic risk prediction tools to better enable clinicians to consider all the potential adverse outcomes in patients with NSTEMI prior to initiation of therapy

Similar presentations


 Initial Report 1st Quarter 2007 Results Report prepared by: www. ncdr.com.>")


 The LIPID Study Group N Engl J Med 1998;339:1349-57.>")


