Download presentation
Presentation is loading. Please wait.

1
T o p o g r a p h i c S u r v e y i n g

2
Introduction Topographic surveys are used to record the information necessary to draw a topographic map. Topo maps are a two dimensional representation of three dimensional objects The task is to determine the relief of the earth’s surface and locate critical points on it.

3
Introduction-cont. Topographic maps not only record elevation, they also include the important surface features. The surface features that could be included are: Slope Hills Streams Lakes Trees Soil type Man-made objects Etc. Man-made objects could be: a) Buildings b) Water structures c) Utilities d) Roads e) Etc. Not all features should be included on all maps. The features that are included on the map are determined by the purpose of the map.
 Buildings. b) Water structures. c) Utilities. d) Roads. e) Etc. Not all features should be included on all maps. The features that are included on the map are determined by the purpose of the map.")
4
Map Standards Scale is defined as the relationship between the distance on the map and the distance on the ground. a) Usually expressed as a fraction or ratio. b) 1/10,000 or 1:10,000 A scale of 1:10,000 means that one unit on the map equals 10,000 of the same units on the ground.
 Usually expressed as a fraction or ratio. b) 1/10,000 or 1:10,000. A scale of 1:10,000 means that one unit on the map equals 10,000 of the same units on the ground.")
5
Map Standards-cont. The first number always represents the map and the second number the ground. a) The larger the second number is, the smaller the scale of the map. b) Example: a map of an area 100 miles by 100 miles drawn at a scale of 1:63,360 (1 inch = 1 mile) would be eight feet square. c) If the same area was drawn with a scale of 1:316,800 (1 in = 5 miles) the map would be less that 2 ft by 2 ft. d) If the 1:63,360 scale is used but the area is reduced to 20 miles by 20 miles the size of the map would be less than 2 ft by 2 ft.
 The larger the second number is, the smaller the scale of the map. b) Example: a map of an area 100 miles by 100 miles drawn at a scale of 1:63,360 (1 inch = 1 mile) would be eight feet square. c) If the same area was drawn with a scale of 1:316,800 (1 in = 5 miles) the map would be less that 2 ft by 2 ft. d) If the 1:63,360 scale is used but the area is reduced to 20 miles by 20 miles the size of the map would be less than 2 ft by 2 ft.")
6
Map Standards--cont. The scale of the map is determined by the size of the area and the desired detail. If the area is large, it is a common practice to use one map with a large scale to show the entire area and other maps with much lower scale to show the details of certain areas. Companies and government agencies may have a standard scale for all of their maps. USGS and Forest service commonly use a scale of 1:24,000 With this scale, each map represents 7.5 minutes of latitude and 7.5 minutes of longitude. These maps are called 7.5 minute quadrangles.

7
Map Symbols Symbols are used for many features on a map to reduce the amount of words. Several standards have been adopted.

8
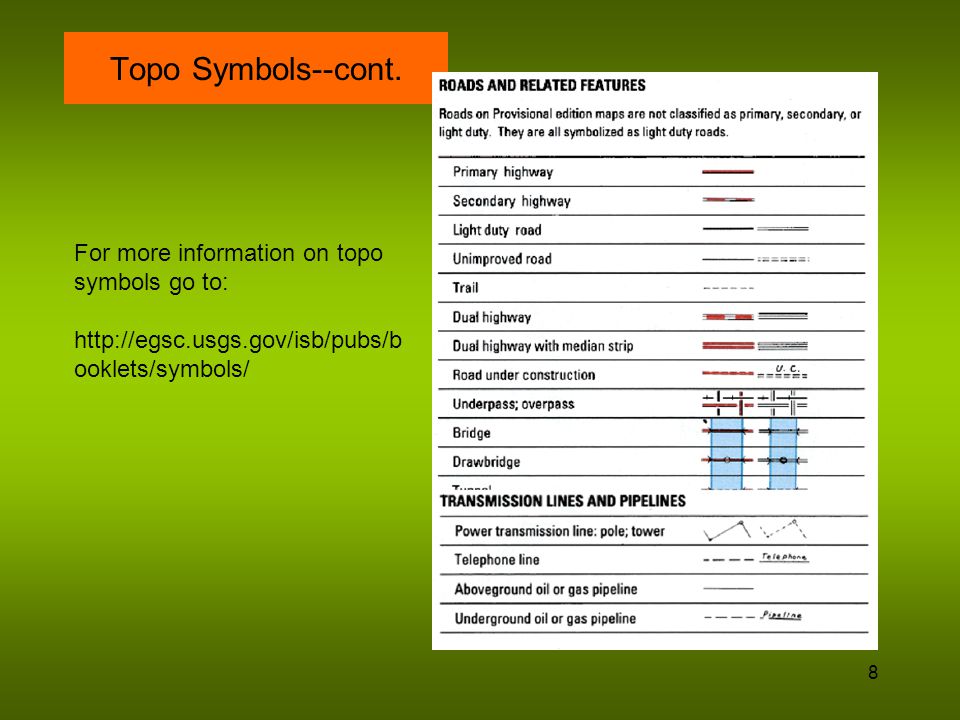
Topo Symbols--cont. For more information on topo symbols go to:
9
Accuracy Topo maps are usually not considered to be extremely accurate. Their primary function is for planning purposes. Not intended to show every small depression or hill. Most measurements can be taken with an accuracy less that the least count of the instrument.

10
Accuracy--cont. Standards Elevations: nearest 0.1 feet
Exceptions are features such as foundations, bridges, sidewalks, etc. that might be used for a benchmark. These should be to feet. Distances: nearest 0.1 feet Horizontal angles: nearest degree Vertical angles for stadia: least count of instrument

11
Sources of Error & Mistakes In Topographic Surveys
Errors Instrument errors Reading errors Inadequate control points Exceeding instrument sight distance Poor selection of stations Mistakes Unsatisfactory equipment Failure to set equipment correctly Too few, or too many stations Omission of topographic details. Elementary Surveying, Wolf & Brinker

12
Map Features Contour Lines Major topographical features
Contour lines are lines of constant elevation. Major topographical features 1. Stream beds 2. Hill tops 3. Ridge lines 4. Edge of cliffs 5. Shore lines Etc.

13
Map Features-cont. The edge, centerline and intersection of roads, dams etc. The beginning or ending points of bridges, culverts and other major road structures. All known socio-graphic features. a) City limits b) County lines c) Housing districts boundary lines
 City limits. b) County lines. c) Housing districts boundary lines.")
14
Map Features--cont. Utility lines Easements Spot elevations
1. Underground pipe 2. Underground electrical 3. Over head electrical 4. Sewers 5. Storm drains 6. Etc. Easements Spot elevations Any additions features which will enhance the readers ability to read and use the map for its intended purpose.

15
Contour Lines

16
Definition A contour line is a line that passes through points having the same elevation.* A contour line is represented in nature by a shore line. *Surveying, 10ed, Moffit & Bossler

17
Elevation from Contours
Elevations of points between contours can be determined by interpolation.

18
Slope from Contours Rise = 200 - 150 = 50 ft
The percent slope can also be determined from the contour lines on a topo map. Determine the slope between the two points on the map. Rise = = 50 ft Run = in x 1,000 ft/in What would be the slope if the map scale is 1:10,000?

19
Eleven (11) characteristics of contour lines
Contour lines are continuous. Contour lines are relatively parallel unless one of two conditions exists. A series of V-shape indicates a valley and the V’s point to higher elevation. A series U shape indicates a ridge. The U shapes will point to lower elevation. Evenly spaced lines indicate an area of uniform slope.

20
Contour Line Characteristics-cont.
A series of closed contours with increasing elevation indicates a hill and a series of closed contours with decreasing elevation indicates a depression. Closed contours may be identified with a +, hill, or -, depression. Closed contours may include hachure marks. Hachures are short lines perpendicular to the contour line. They point to lower elevation.

21
Contour Line Characteristics-cont.
The distance between contour lines indicates the steepness of the slope. The greater the distance between two contours the less the slope. The opposite is also true. Contours are perpendicular to the maximum slope. A different type of line should be used for contours of major elevations. For example at 100, 50 and 10 foot intervals. Common practice is to identify the major elevations lines, or every fifth line, with a bolder, wider, line.

22
1. Contours are Continuous
Some contour lines may close within the map, but others will not. When they do not close they will start at a boundary line and end at a boundary line.

23
1. Continuous Contours-cont.
Is the topo map correct? No Contour 1040 is very unlikely This would only occur if there were a long vertical wall.

24
2. Contour lines are parallel
Two exceptions: They will meet at a vertical cliff They will overlap at a cave or overhang. 3. When contour lines overlap, the lower elevation contour should be dashed for the duration of the overlap.

25
3. Valleys and higher elevation
A series of V-shapes indicates a valley and the V’s point to higher elevation.

26
4. U shapes and ridge A series of U shapes indicates a ridge. The U shapes will point to lower elevation.

27
5. Contour Spacing Evenly spaced contours indicate an area of uniform slope. Unevenly spaced contours indicates an area with variable slope.

28
6. Hills and Depressions A series of closed contours with increasing elevation indicates a hill. Hills may be identified with a “+” with the elevations

29
6. Hills and Depressions--cont.
A series of closed contours with decreasing elevation indicates a depression. Depressions may be identified with a “-”.

30
8. Hachures Hachures are short lines which are perpendicular to the contour line. Used to indicate a hill or a depression. Not used on modern maps.

31
9. Contour Spacing Contours spaced close together indicate a higher % slope. Contours spaced wider apart indicate lower % slope.

32
9. Contour Spacing--cont.
Contours are perpendicular to maximum slope. Different types of lines should be used for contours of major elevations. Common practice is to identify the major elevations lines, or every fifth line, with a bolder, wider, line.

33
9. Contour Spacing-Intervals
Another decision that must be made is the contour interval. The “best” interval depends on the use of the data.

34
Contour Intervals--cont.
Types of topo map Nature of terrain Recommended interval (feet) Large Scale Flat 0.5 or 1 Rolling 1 or 2 Hilly 2 or 5 Intermediate scale 1, 2 or 5 5 or 10 Small scale 2, 5 or 10 10 or 20 20 or 50 Mountainous 50, 100 or 200
 Large Scale. Flat. 0.5 or 1. Rolling. 1 or 2. Hilly. 2 or 5. Intermediate scale. 1, 2 or 5. 5 or 10. Small scale. 2, 5 or or or 50. Mountainous. 50, 100 or 200.")
35
Data Collection

36
Two Issues On Data Collection
When collecting topo data there are two important issues: Ensuring sufficient data is collected to define the object. Ensuring two types of information is gathered for each station: Location Elevation

37
Defining an Object It is important to remember that topographic surveys are three dimensional. To accurately represent an object on a topo map data must be collected to define the shape, location and changes in elevation for an object.

38
Defining An Object-Hills and Depressions
How many stations are required to define the shape of a hill or depression? 17 ? 20 ?

39
Defining An Object-Ditches
Another situations that requires some thought is how many stations are required to define the cross section of a ditch and length of a ditch. Trapezoidal cross section = minimum of 6 Entire ditch = ?? 19

40
Station Information Both location and elevation data must be collected for each station. The two common locating methods are: Triangulation Trilateration Triangulation establishes locations by using angles or a combination of angles and distances. Trilateration establishes locations by using three (3) distances.
 distances.")
41
Station Information-cont.
These principles establish the two common topographical methods: Grid Angle and distance.

42
Triangulation Triangulation locates a point by using angles or angles and distances. Common methods are: One angle and the adjacent distance Two angles and one distance One angle and the opposite distance One distance and the right-angle offset distance (grid) Two angles from the point to be located to three control points.
 Two angles from the point to be located to three control points.")
43
1. Location by Angle and distance
In this method The location of stations A & B is known and the line A:B is the base line. The instrument is set up over either station A or B and the the angle and distance is measured to X.

44
Angle and Distance-cont.
The distance can be measured by chaining, stadia, EDM or odometer wheel depending upon the desired precision. The precision of the angle measurement should match the precision for distance. For example, if stadia measuring to 0.1 ft, is used for distance, the angle measurement precision should be at least minutes.

45
2. Two Angles & One Distance
In this method a base line is established and the distance A:B is measured. Angles are turned to the unknown point from two stations along the base line.

46
3. One Angle & The Opposite Distance
In this method the distance A:B is established on the base line. The distance A:C is measured. An instrument is set up at station B and the angle ABC is recorded.

47
4. One Distance & Right Angle Offset
This method is not practical for locating an existing station. It is useful for establishing a station. The distance A:B is established on the base line. An instrument is set up at station B and a 90 degree angle is turned towards point C. The desired distance for B:C is measured along the line established by the angle.

48
5. Two Angles From Three Control Points
This method is very popular for establishing a new station or determining the location of a station because it does not require measuring distances. Stations A, B & D are control points. Stations of known location and elevation. The instrument is set up on C. One station is used as the backsight and angles are turned to the other two control points.

49
Trilateration Trilateration uses three distances to locate or establish a station. In the illustration the line A:B is the base line and A:C and B:C are measured distances.

50
Station Identification
In the grid method, rows and columns are identified by letters and numbers. Angle and distance stations are labeled by letters or numbers or any combination that organizes them in an easy to understand sequence.

51
Determining Elevations
Once the stations have been established the elevations are recorded just as in differential or profile leveling. Height of instrument is established by backsight to a benchmark or control point. The elevation of each station is determined by recording the foresight readings.

52
Determining Elevations-cont.
If all of the foresights can not be read from one instrument position, then a turning point must be used. Survey must always be closed back to the starting benchmark or control point. The station notation varies with the type of topographic survey being conducted.

53
Selecting Method Selecting the “best” method for a topographic survey is more of an art than a science. Considerations are: Purpose of the survey Accuracy required Map scale Contour interval Size and type of area Cost Resources available Experience of the personnel

54
Grid Method In the grid method rows and columns are used to establish a grid over the area being surveyed and foresights are recorded at every grid point. Grid spacing is an important consideration and the “best” spacing depends on the variability of the site and the use of the data.

55
Grid Method-cont. It is a normal occurrence to have a few non standard grids. These must be carefully identified and and located.

56
Grid Method--cont. Because the grid method records information on a grid pattern it is possible to miss important sites. One method used to prevent this is called spot elevations. Spot elevations are used to collect information on important sites that are not on a grid point, for example a rock.

57
Grid Method--cont. In this example the large rock that would be ignored because it is not at a grid point. Stations around the rock would be marked to define the size and shape of the rock. The rock would be located by trilateration to several grid points.

58
Angle & Distance Method
The angle and distance method only identifies the stations that are identified as important for the survey. The greater the variability and complexity of the site, the larger the number of stations that must be established.

59
Angle & Distance Method-cont.
In this example a large lawn in front of the house could be surveyed with 15 or less sites because the area is relatively flat with very few features to locate.

60
Angle & Distance Method-cont.
If the purpose of the survey was to define this gulley, the angle and distance method would be best, but it would require a large number of stations. The number of stations would depend upon the precision of the survey.

61
Interpolation Drawing contour lines to produce a topographic map requires the ability to interpolated between points. Interpolation is required because contour lines are lines of constant elevation and the station elevations that are measured in the field seldom fall on the desired contour elevation. Interpolating is finding the proportional distance from the grid points to the contour line elevation.

62
Interpolation Interpolating can be done by estimation for low precision maps. It should be done by calculation and measurement for higher precision maps. A combination of methods can also be used, depending on the use of the map.

63
Interpolating by Estimation
Study the illustration. Logic or intuitive reasoning would conclude that when the grid points are at 102 feet elevation and 98 feet elevation, then a contour line of 100 feet elevation would be half way in between. Note: that a dashed line has been drawn between the two points. In topographic surveying it is assumed that the area between two measured stations is a plane.

64
Interpolating by Calculation
Proportional distance is calculated using an equation. For the previous example this would result in: The 100 foot contour line would be located 0.5 or half of the distance between the two stations.

65
Interpolation by Calculation & Estimation
The same equation is used for all grid distances and all contour lines. Example: Determine the location of the 96 foot contour line for the illustration.

66
Interpolation by Calculation and Measurement
Start by selecting an contour interval and two grid points. This example starts with the 110 foot interval. The first step is to calculate the position of the 110 foot contour between stations A1 and A2.

67
Interpolation by Calculation and measurement--cont.
The next step is to measure and mark the position of 0.6. Next, determine which direction the contour goes between the diagonal and the other three sides of the grid. Mark the next points.

68
Interpolation by Calculation and measurement--cont.
The 110 foot contour line passes between B1 and B2, therefore the next station is the diagonal. These steps are followed one grid line at a time until the contour closes, or reaches the edge of the map.

69
Interpolation by Calculation and measurement--cont.
Determining the proportion for line B1:B2.

70
Interpolation by Calculation and measurement--cont.
The grid lines and diagonals for each square are considered and the contour is extended.

71
Interpolation by Calculation and measurement--cont.
The next grid line is between B2 and C2.

72
Interpolation by Calculation and measurement--cont.
Each grid line and diagonal is considered and the contour line is extend between the appropriate points.

73
Interpolation by Calculation and measurement--cont.
When the contour points form a closed shape or have extended from one edge of the map to another, a smooth line is drawn connecting the points. The contour lines must be labeled.

74
Drawing Contour Lines Topographic maps are three dimensional.
When drawing contour lines all possible paths must be investigated. A simple grid will be used to demonstrate this point.

75
Drawing Contour Lines-cont.
There is no right or wrong starting point. Pick a contour interval, start at one edge and extend the contour across the map. This example starts with the 14 foot contour. In this example even numbered contours will be used.

76
Grid Example--cont. A3 is at 13 ft elevation and A4 is at 15 ft elevation, a 14 ft contour would be half way in between. The next step is to determine which diagonal and which grid line it passes through. A3 and B3 are both at 13 ft, therefore the 14 foot contour does not pass between them. B4 is at 14 ft, therefore the 14 ft contour interval would pass through station B4. Before marking station B4 the diagonals must be checked.

77
Grid Example--cont. The diagonals must be checked to determine if the 14 ft contour continues to station B4. B3 is at 13 ft, A4 is at 15 ft, a 14 ft elevation is present between these two points, therefore the contour line can be extended to station B4. Each pair of grid points are investigated and the contour is extended until it is complete.

78
Grid Example--cont. To extend the contour the next options must be checked. Station B3 is at 13 feet elevation and station B4 is at 14 feet elevation. The contour extends from the diagonal position to station B4.

79
Grid Example--Drawing Contour Lines
This contour is completed by connecting the points with a smooth line.

80
Grid Example--cont. The 12 foot interval is completed in the same way.
A2 is at 11 ft and A3 is at 13 ft, therefore the 12 foot contour is half way between A2 and A3. A2 and B2 are both at 11 ft, the contour doesn’t go between these two. A3 is 13 ft and B3 is 13 ft, it doesn’t go this way. B2 is 11 ft and B3 is 13 ft, a 12 ft elevation is half way between. This 12 ft interval will pass through this point, as long as the diagonals are ok.

81
Grid Example-cont. The next grid is more difficult because a 12 foot contour line will pass through both B2:C2 and B3:C3. In addition to go either way would violate the diagonals. The remaining points must be investigated to determine the best path.

82
Grid Example--cont. If the contour is extended through B2:C2 and completed to D3, the diagonal must also be violated at D2:C3 to continue on to D3. There should be a better interpretation.

83
Grid Example--cont. The contour should be completed by passing between B3:C3. This a better interpretation because: the contour is completed without violating the diagonal at C3:D4. The 12 foot contour parallels the 14 foot contour.

84
Grid Example--cont. The 10 foot interval is completed in the same way.
At this point there is a danger of considering the map complete, but you must always check for a possible hill or depression on the map. In this example there is 12 foot contour around C2.

85
Grid Example--cont. Putting in the 12 foot contour around C2 violates the diagonal between C2 and B3. This is acceptable because it should be clear that a valley exists from A2 through B2 through C3 and then to at least C2.

86
Angle and Distance Example

87
Angle & Distance--Drawing Map
The first step in producing a topographic map from angle and distance data is drawing a map of the boundaries. To draw the boundaries, the map scale must be selected.

88
Angle & Distance--Drawing Map
To determine the map scale the maximum distances must be determined. Study the data table and sketch. The lot is rectangular and the distance from station IP to station D is198.3 ft and from IP to B is = ft /50 = 9.19 inches A scale of 1” = 50’ will require paper that is 9.19 inches long.

89
Angle & Distance--Drawing Map
North is zero degrees To draw the map the IP is located in the approximate position and the data is used to locate each corner using the angle and the distance. Corner A is: 5.3 inches and -56.5o from North and IP. STA DIST ANGLE ELEV A 267.2 303.5 950.2

90
Angle & Distance--Drawing Map
Each boundary station is marked on the map using the same method. Station B is feet from the instrument position and at an angle of 42.1o. STA DIST ANGLE ELEV B 261.2 42.1 961.1

91
Angle & Distance--Drawing Map
Station C is feet from the instrument position and at an angle of STA DIST ANGLE ELEV C 228.3 126.7 954.9

92
Angle & Distance--Drawing Map
Station D is feet from the instrument position and at an angle of STA DIST ANGLE ELEV D 198.3 190.3 938.7

93
Angle & Distance--Drawing Map
Station E is feet from the instrument position and at an angle of STA DIST ANGLE ELEV E 275.1 216.2 933.5

94
Angle & Distance--Drawing Map
This completes the boundary of the lot. The next step is draw the boundary lines.

95
Angle & Distance--Drawing Map
The remaining stations are added to the map. Station F is feet from the instrument position and at an angle of 358.5o. STA DIST ANGLE ELEV F 130.6 358.5 948.3

96
Angle & Distance--Drawing Map
Station G is 65.8 feet from the instrument position and at an angle of 43.3o. STA DIST ANGLE ELEV G 65.8 43.3 946.5

97
Angle & Distance--Drawing Map
Station H is feet from the instrument position and at an angle of 163.4o. STA DIST ANGLE ELEV H 145.7 163.4 940.1

98
Questions

Similar presentations


>")


 of the Earth’s surface.>")


