Download presentation
Presentation is loading. Please wait.

1
Carlos G. Grijalva, MD MPH Department of Preventive Medicine Vanderbilt University School of Medicine Nashville, Tennessee

2
Pneumococcal diseases Importance of pneumonia PCV7 efficacy against pneumonia Study design considerations PCV7 uptake & secular trends Population-based changes after PCV7 introduction

3
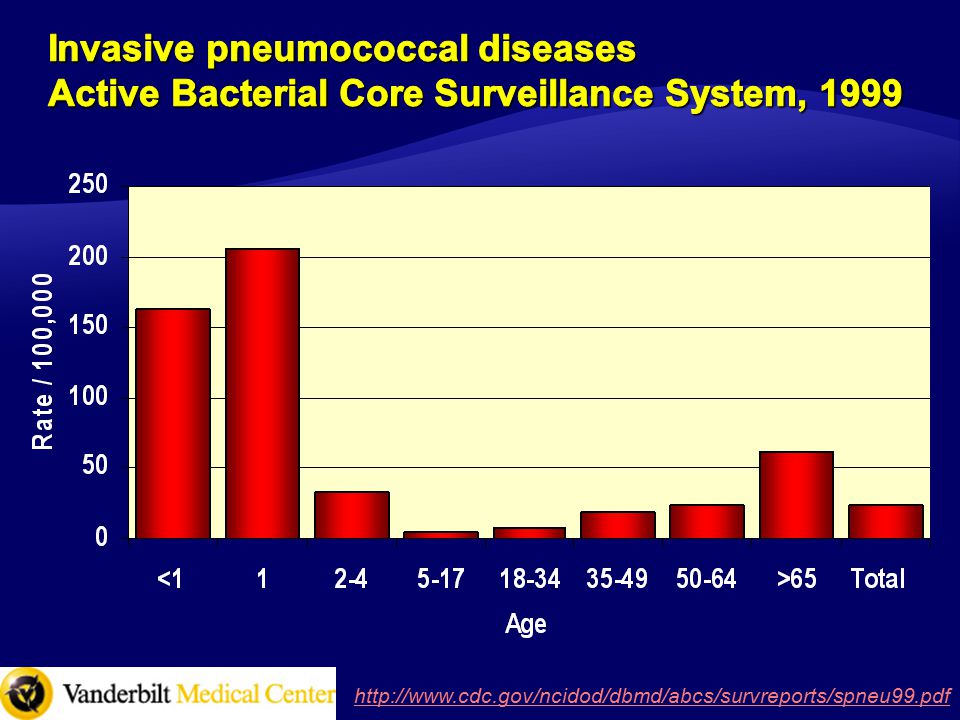
http://www.cdc.gov/ncidod/dbmd/abcs/survreports/spneu99.pdf
4
Study focus InvasivePneumococcal Disease (IPD) Meningitis Bacteremia Pneumonia Otitis media/Sinusitis More severe More common
 Meningitis Bacteremia Pneumonia Otitis media/Sinusitis More severe More common")
5
Property Polysaccharide Conjugate Immunogenicity children <2 years NO YES B cell dependent immune responseYES YES T cell dependent immune response NO YES Immune memory NO YES Booster effect NO YES Long term protection NO YES Reduction of carriage NO YES Herd immunity NO YES Adapted from Granoff DM. Vaccines. 2004

6
Active Bacterial Core Surveillance (ABCs) Report, Emerging Infections Program Network, Streptococcus pneumoniae, 1997-2009, Centers for Disease Control and Prevention. http://www.cdc.gov/ncidod/dbmd/abcs/survreports.htm. Accessed Sep 16th, 2010. http://www.cdc.gov/ncidod/dbmd/abcs/survreports.htm 6 PCV7

7
Bryce J, et al. Lancet. 2005;365:1147-1152 Pneumonia 19% Injuries 3% Other 10% Neonatal 37% HIV/AIDS 3% Diarrhea 17% Measles 4% Malaria 8% Preterm 28% Congenital 8% Asphyxia 23% Sepsis or pneumonia 26% Diarrhea 3% Tetanus 7% Other 7% Causes of neonatal deaths Pneumonia is the leading killer of children

8
Leading infectious cause of death 3% to 18% of all childhood hospitalizations Streptococcus pneumoniae is the leading bacterial cause of pneumonia 17–44% pneumonia admissions in children 13–34% pneumonia admissions in adults Marston BJ, et al. Arch Intern Med. 1997;157:1709-1718 Farha T, Thomson AH. Paediatr Respir Rev. 2005;6:76-82 Michelow I, et al. Pediatrics. 2004;113:701-707 Drummond P, et al. Arch Dis Child. 2000; 83:408-412 The British Thoracic Society and the Public Health Laboratory Service. Q J Med. 1987; 62:195-220

9
Black et al. PIDJ. 2002;21:810–15 Hansen et al. PIDJ. 2006;25:779–81 Control Rate / 1000 PCV7 Rate / 1000 Vaccine Efficacy (%) 95% CI Clinical pneumonia 55.953.44.3–3.5 to 11.5 Chest X-ray obtained 34.230.99.80.1 to 18.5 Positive chest X-ray 11.08.720.54.4 to 34.0 WHO consolidation 30.310.7 to 45.7
 95% CI Clinical pneumonia –3.5 to 11.5 Chest X-ray obtained to 18.5 Positive chest X-ray to 34.0 WHO consolidation to")
10
To estimate the impact of PCV7 Pneumonia hospitalization rates in children aged <2 years (target population) To evaluate indirect effects
 To evaluate indirect effects")
11
CDC. Biosurveillance 2000–2005 and National Immunization Survey Grijalva CG, et al. Expert Rev Vaccines. 2008;7:83–95

12
HCUP: Nationwide Inpatient Sample Sponsored by AHRQ Largest inpatient database publicly available ~20% of US hospital discharges Discharge level information De-identified data, diagnoses, procedures, no lab, no chest x- rays Complex sampling design

13
Monthly hospitalization rates (annualized): All-cause pneumonia Pneumococcal pneumonia Dehydration (control condition) Segmented regression analysis: ITS Log-transformed rates as outcomes Quantified vaccine effect by end of 2004 Grijalva CG, et al. Lancet. 2007;369:1179–1186

14
Quasi-experimental design Wagner AK, et al. J Clin Pharm Therap. 2002;27:299–309

15
Evaluate longitudinal effects of time- delimited interventions Account for seasonal and secular trends With a control group can assess non- specific changes

16
Intervention (2000)
")
17
Intervention (2000) Overestimation of Effect
 Overestimation of Effect")
18
Intervention (2000)
")
19
Intervention (2000) Underestimation of Effect
 Underestimation of Effect")
20
Grijalva CG, et al. Lancet. 2007;369:1179–1186

26
<22-45-1718-3940-64>64 -100 -80 -60 -40 -20 0 Percent (%) change Grijalva CG, et al. Expert Rev Vaccines. 2008 Feb;7(1):83-95
:")
27
20 <22-45-1718-3940-64>64 -100 -80 -60 -40 -20 0 Percent (%) change Grijalva CG, et al. Expert Rev Vaccines. 2008 Feb;7(1):83-95
:")
28
Age group Rate difference per 100,000 US population Annual pneumonia admissions prevented <2 years –505.9 8 million 41,287 18–39 years –27.4 90 million 24,743 Grijalva CG, et al. Lancet. 2007;369:1179–1186

29
Zhou F, et al. Arch Pediatr Adolesc Med. 2007;161:1162–1168

30
Grijalva et al, 2009 MMWR 58(1): 1-4 ↓22 % NC
: 1-4 ↓22 % NC")
31
Grijalva et al. Clin Infect Dis. 2010; 50(6):805-13
:805-13")
32
♦Major declines in all-cause and pneumococcal pneumonia after PCV7 program introduction ♦Sustained declines consistently observed in different studies/settings ♦Large national database (HCUP NIS) allowed detection and monitoring of direct and indirect effects
 allowed detection and monitoring of direct and indirect effects")
33
♦Marie R. Griffin, MD MPH ♦Professor of Medicine and Preventive Medicine. VUMC ♦J. Pekka Nuorti, MD DSc ♦Epidemiologist, CDC

Similar presentations


 William Schaffner, MD Professor of Preventive Medicine and Infectious Diseases.>")


 Katie Huber BIOL 62 Image: CDC.>")
