Download presentation
Presentation is loading. Please wait.

1
Economic Freedom: What It Is and Why It Matters DEAN STANSEL ASSOCIATE PROFESSOR OF ECONOMICS FLORIDA GULF COAST UNIVERSITY HTTP://WWW.DEANSTANSEL.COM

2
Personal Freedom Matters Too 2

3
3

4
4

5
Prison Population Grows 25X Faster than Population 5

6
Land of the Free? 2000 EFW Rankings 1-Hong Kong 2-United States 3-Switzerland 4-Singapore 5-New Zealand 6-United Kingdom 7-Canada 8-Netherlands 9-Ireland 10-Australia 6

7
Land of the Free? 2000 EFW RankingsCurrent Rankings1-Hong Kong 2-United States 2-Singapore 3-Switzerland3-New Zealand 4-Singapore4-Switzerland 5-New Zealand 5-United Arab Emirates 6-United Kingdom6-Mauritius 7-Canada7-Finland 8-Netherlands8-Bahrain 9-Ireland9-Canada 10-Australia10-Australia … 17-U.S. 7

8
1)What is “economic freedom”? 2)Where do we rank (US, KY & IN, and Louisville)? 3)Why are we so low? 4)Why does it matter? 8
Why are we so low. 4)Why does it matter. 8.")
9
“It is no crime to be ignorant of economics, which is, after all, a specialized discipline and one that most people consider to be a ‘dismal science.’ But it is totally irresponsible to have a loud and vociferous opinion on economic subjects while remaining in this state of ignorance.” -- Murray Rothbard, Austrian Economist 9

10
Economic Freedom Project What is it? An initiative to help publicize the findings of the Economic Freedom of the World Report and the Economic Freedom of North America Report and economic freedom in general. 10

11
What Is Economic Freedom? “Individuals have economic freedom when property they acquire without the use of force, fraud, or theft is protected from physical invasions by others and they are free to use, exchange, or give their property as long as their actions do not violate the identical rights of others. An index of economic freedom should measure the extent to which rightly acquired property is protected and individuals are engaged in voluntary transactions.” 11

12
5 Components of Economic Freedom of the World Index 1.Size of government 2.Legal structure and property rights 3.Sound money 4.Freedom to trade internationally 5.Regulation 12

13
How Do We Rank? U.S. is down to 17 th place from 8 th in 2008 and 2 nd in 2000. Kentucky has been 37 th four years in a row, down from 32 nd in 2005 and 23 rd in 1993. Indiana is 13 th, up from 17 th last year and 21 st in 2009, but down from 7 th in 1998. Available at: www.freetheworld.comwww.freetheworld.com 13

14
14

15
15

16
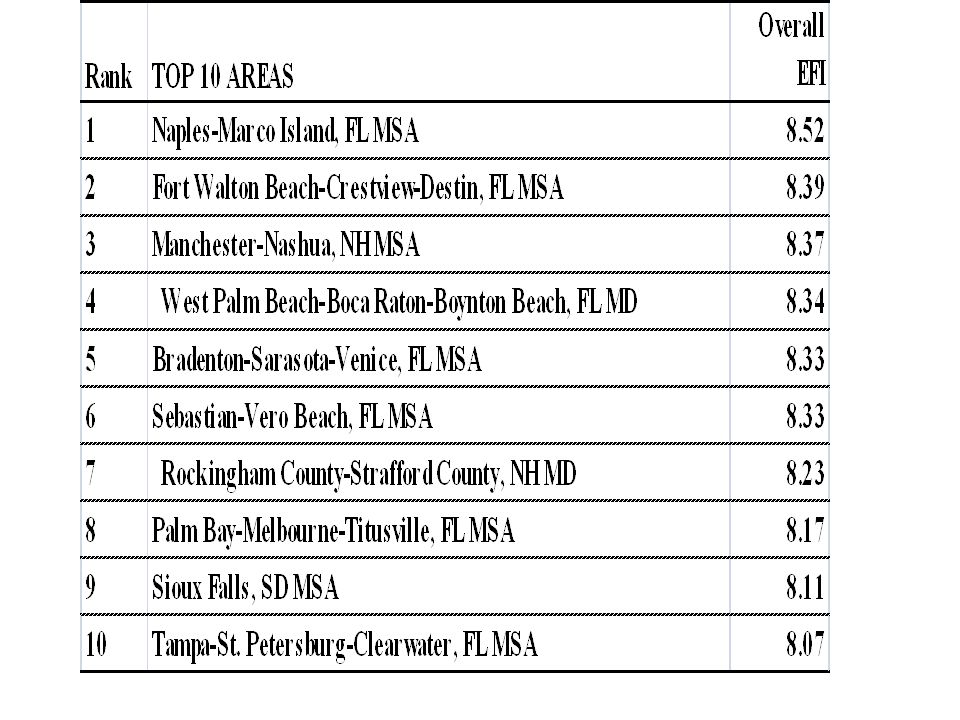
An Economic Freedom Index of U.S. Metropolitan Areas Dean Stansel Florida Gulf Coast University dstansel@fgcu.edu Journal of Regional Analysis and Policy, 43, 1 (2013): 3-20. http://www.jrap-journal.org/http://www.jrap-journal.org/ or http://t.co/xfKmP2VHjOhttp://t.co/xfKmP2VHjO
: or")
19
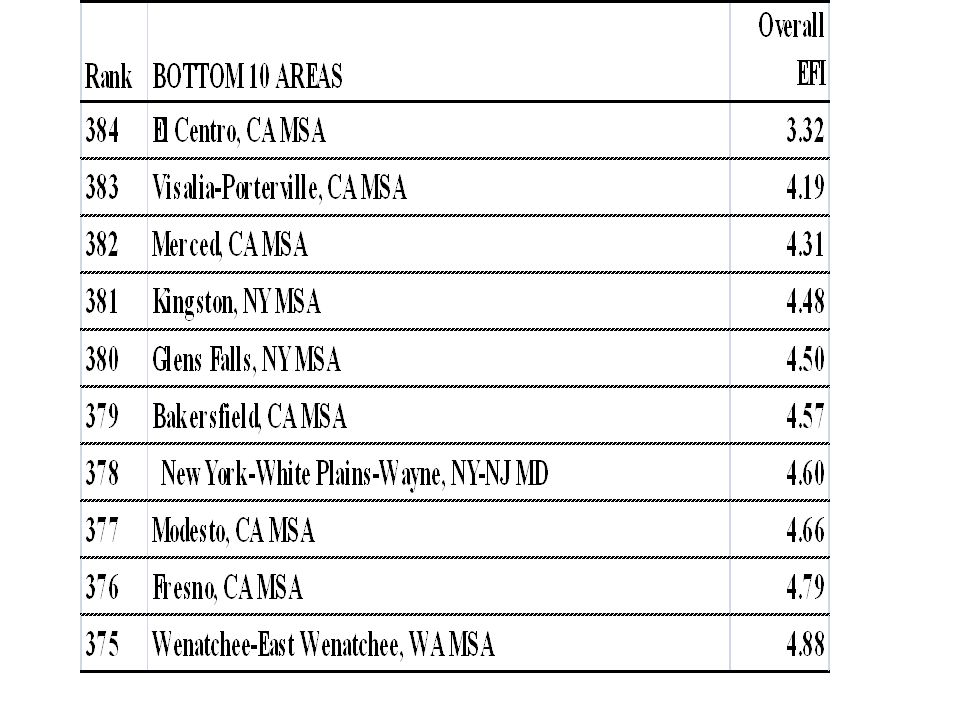
Summary of Results All of top 10 are in states with no tax on labor income (FL, NH, SD) 9 of bottom 10 are in California or New York (and 15 of bottom 20)
 9 of bottom 10 are in California or New York (and 15 of bottom 20)")
20
Economic Freedom in Louisville Louisville ranked 215 out of the 384 metropolitan areas in the U.S. It ranked 1st out of 5 metro areas in Kentucky, but behind all 14 areas in Indiana. 20

21
Rank AreaOverall EFI 215Louisville-Jefferson County, KY-IN MSA6.68 219Elizabethtown, KY MSA6.66 226Lexington-Fayette, KY MSA6.60 242Bowling Green, KY MSA6.47 260Owensboro, KY MSA6.38

22
Rank AreaOverall EFI 71Evansville, IN-KY MSA7.48 83Fort Wayne, IN MSA7.41 85Elkhart-Goshen, IN MSA7.40 91Indianapolis-Carmel, IN MSA7.34 97Lafayette, IN MSA7.27 98Muncie, IN MSA7.26 105South Bend-Mishawaka, IN-MI MSA7.21 115Bloomington, IN MSA7.15 125Anderson, IN MSA7.11 130Columbus, IN MSA7.08 141Terre Haute, IN MSA7.04 198Michigan City-La Porte, IN MSA6.77 204Gary, IN MD6.74 208Kokomo, IN MSA6.71

23
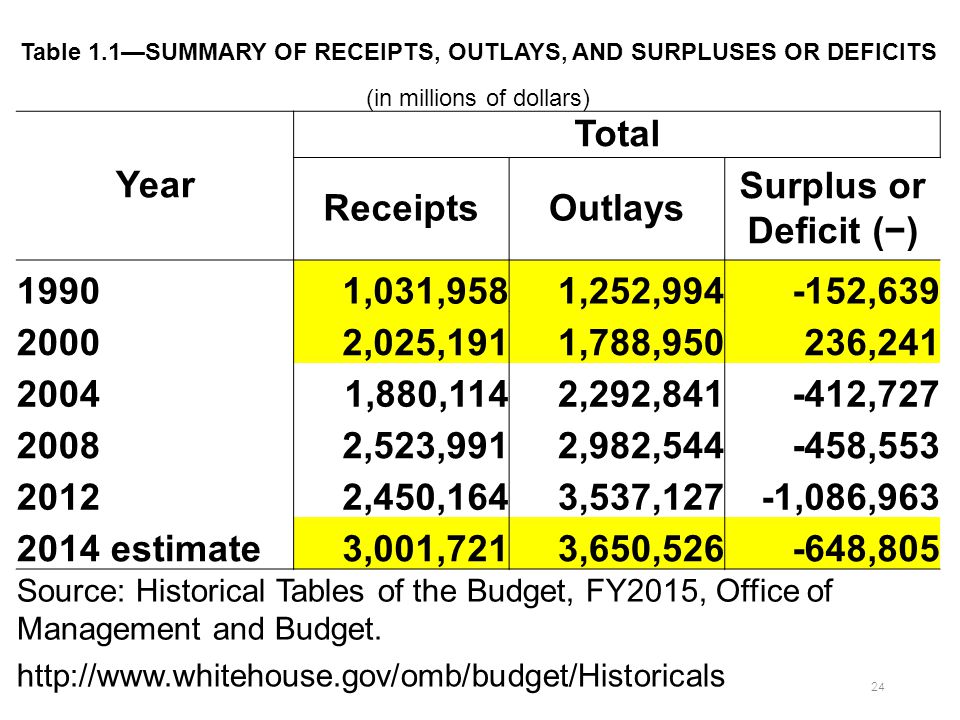
Why Has Economic Freedom Declined? Federal spending has doubled since 2000 and tripled since 1990. Personal income has only gone up by less than half since 2000. We have an over-spending problem, NOT an under-taxing problem.

24
24 Table 1.1—SUMMARY OF RECEIPTS, OUTLAYS, AND SURPLUSES OR DEFICITS (in millions of dollars) Year Total ReceiptsOutlays Surplus or Deficit (−) 19901,031,9581,252,994-152,639 20002,025,1911,788,950236,241 20041,880,1142,292,841-412,727 20082,523,9912,982,544-458,553 20122,450,1643,537,127-1,086,963 2014 estimate3,001,7213,650,526-648,805 Source: Historical Tables of the Budget, FY2015, Office of Management and Budget. http://www.whitehouse.gov/omb/budget/Historicals
25
Spending & Deficits at Post-WW2 High As a percent of GDP, federal spending hit a post-WW2 high of 25.2% in 2009. The federal deficit as a percent of GDP has also been at its highest level since WW2. It hit 10.1% in 2009. It has exceeded 5% five years in a row. Source: Historical Tables of the Budget, FY2014, Office of Management and Budget. http://www.whitehouse.gov/omb/budget/Historic als 25

26
Entitlement Spending Cato Institute found that welfare pays more than: the starting wage for a secretary in 39 states. the average first year wage for a teacher in 11 states. an entry-level computer programmer in the 3 most generous states.

27
Obamacare AKA, The Unaffordable Care Act Higher taxes Higher spending Regulatory uncertainty Unintended consequences 27

28
Debt as % of GDP at Post-WW2 High 28

29
Tax Freedom Day The Tax Foundation Was April 21 st this year. 3 days later than last year. 11 days later than in 2009. If we include deficits, which require higher future taxes, it was 15 days later (May 6) 29
 29.")
30
The President’s $1 Trillion Tax Hike 30

31
Expanding Tax Code 31

32
Cost of Tax Compliance $37 billion in 2012 preparing federal individual, business, and employment tax returns. 3.24 billion hours The equivalent of 369,858 years Source: McCaherty, “The Cost of Tax Compliance,” Tax Foundation, Sep. 2014. 32

33
According to the OECD “the United States has the most progressive income tax system among industrialized nations. … The richest 10 percent of households in the United States (those making $112,124 or more) contribute a greater share of taxes ( 45.1 percent of all income taxes) than their counterparts in any other industrialized nation.” The OECD average is 31.6 percent. The next highest is Italy at about 42%. Only a handful of others are above 35%. Source: http://mercatus.org/publication/progressivity-taxes-oecd-countries-mid-2000shttp://mercatus.org/publication/progressivity-taxes-oecd-countries-mid-2000s 33
 contribute a greater share of taxes ( 45.1 percent of all income taxes) than their counterparts in any other industrialized nation. The OECD average is 31.6 percent. The next highest is Italy at about 42%. Only a handful of others are above 35%. Source:")
34
Source: Dan Mitchell, Cato Institute, http://danieljmitchell.wordpress.com/http://danieljmitchell.wordpress.com/ 34

35
International Tax Competitiveness The U.S. ranks 32 nd out of the 34 OECD countries. Highest corporate tax rate Double taxation of capital gains and dividends 1 of only 6 with a “worldwide system of taxation”????? Source: Pomerleau & Lundeen, "2014 International Tax Competitiveness Index," Tax Foundation, September 15, 2014. 35

36
Regulatory Burden Is High and Rising The Federal Register contains 81,000 pages of regulations. It would take more than 2 years to read through all of it. 36

37
Cost of Federal Regulations $2 trillion in 2012 $9,991 per employee, all industries $19,564 per employee in the manufacturing industry $34,671 per employee in the manufacturing industry (small businesses, < 50 employees) Source: Crain & Crain, “The Cost of Federal Regulation to the U.S. Economy, Manufacturing & Small Business,” National Association of Manufacturers, Sep. 2014. 37

38
Sen. George McGovern (D-SD) “ I also wish that during the years I was in public office, I had had this firsthand experience about the difficulties business people face every day. That knowledge would have made me a better U.S. senator and a more understanding presidential contender. ” Source: George Mc Govern, “A Politician's Dream Is a Businessman's Nightmare,” Wall Street Journal, 6/1/92. 38
 I also wish that during the years I was in public office, I had had this firsthand experience about the difficulties business people face every day. That knowledge would have made me a better U.S. senator and a more understanding presidential contender. Source: George Mc Govern, A Politician s Dream Is a Businessman s Nightmare, Wall Street Journal, 6/1/")
39
Kentucky - Taxes According to the Tax Foundation, Kentucky’s 2011 tax burden of 9.48% ranks 23 rd highest out of 50 states. State & local income tax revenue per capita was 15 th highest. It ranks 27 th overall in state business tax climate, behind 5 of its 7 neighboring states (ahead of only Illinois & Ohio). 39
. 39.")
40
Kentucky - Business According to a New York Times analysis of targeted business incentives, Kentucky granted more than all but ten states. Kentucky had the 15 th most burdensome occupational licensing system on the Institute for Justice “License to Work” report (Table 7). $230 in fees, 336 days of class, & 2 exams 40
. $230 in fees, 336 days of class, & 2 exams 40.")
41
Kentucky - Business Kentucky ranked 39 th in the 2014 Rich States Poor States Economic Performance rankings. According to Chief Executive, Ohio ranks 25 th on the 2014 Best & Worst States for Business Rankings. 41

42
“And if I spend somebody else’s money on somebody else, I’m not concerned about how much it is, and I’m not concerned about what I get. And that’s government.” -- Milton Friedman 42

43
Economic Freedom Why does it matter? Areas with more economic freedom have higher: GDP, GDP growth, Income of the poorest 10%, Income share of the poorest 10%, political freedom, civil liberties, life satisfaction, literacy, life expectancy, and cleaner environments And, lower: unemployment, child labor, infant mortality rates, and corruption 43

44
Per Capita Income Is Much Higher in Nations with Higher Economic Freedom Sources: The Fraser ; The World Bank, World Development Indicators, 2013 Sources: The Fraser Institute; The World Bank, World Development Indicators, 2013 Most Free ……………. Least Free

45
45 Per Capita GDP Growth Is Positively Correlated with Economic Freedom in States

46
Unemployment Is Much Lower in Metro Areas with Higher Economic Freedom

47
“…no human wisdom or knowledge could ever be sufficient … for the proper performance of … the duty of superintending the industry of private people, and of directing it towards the employments most suitable to the interest of the society.” -- Adam Smith, The Wealth of Nations 47

48
Source: Dan Mitchell, Cato Institute, http://danieljmitchell.wordpress.com/http://danieljmitchell.wordpress.com/ 48

49
Source: Dan Mitchell, Cato Institute, http://danieljmitchell.wordpress.com/http://danieljmitchell.wordpress.com/ 49

50
50

51
Consumer Power in Health Care Lasik surgery Not covered by most health insurance plans Price has fallen dramatically over the years “Price” of other medical procedures has risen much faster than inflation 51

52
Government Intervention in Higher Education Federal student aid authorized under Title IV of the HEA topped $169 billion in the 2013–2014 academic year – an increase of 105 percent over the past decade. In 2014, the $33 billion Pell Grant program provided grants to 9 million college students, making it the largest share of the federal education budget. Since 1980, tuition and fees at public and private universities have grown at least twice as fast as the rate of inflation. The result has been that 60 percent of bachelor’s degree holders leave school with more than $26,000 in student loan debt, with cumulative student loan debt now exceeding $1 trillion. Source: Lindsey Burke, “4 Key Reforms That Could Make College More Affordable,” The Daily Signal, Sep. 15, 2014. 52

53
53

54
54

55
Prescription for Growth INCREASE ECONOMIC FREEDOM 1.Rein-in spending 2.Lower taxes 3.Reduce the regulatory burden 55

56
56

57
Tax Reform Itemized deductions shrunk the tax base by $1.2 trillion in 2011, 14% of AGI. Tax rates could be reduced by nearly one-fifth if those loopholes were eliminated. Source: Stansel & Randazzo, “Unmasking the Mortgage Interest Deduction,” Reason Foundation, 2013. 57

58
Mortgage Interest Deduction Largest loophole is the mortgage interest deduction Only about 25% of taxpayers claim it. Consumers on the margin b/w renting & buying are harmed due to higher housing prices. They are also much less likely to claim the MID if they DO buy b/c they tend to have lower income. 58

59
Regulatory Reform Regulatory Improvement Act Establish a Regulatory Improvement Commission identify regulations to repeal send them to Congress for an up or down vote as a total package with no amendments Similar to the Base Closure and Realignment Commission of the 1990’s 59

60
The Good News… 60

61
Government Shutdowns Last fall “non-essential” federal government employees were off the job for well over a week, and... Lee County (FL) Soil and Water District recently voted to shut itself down. 61
 Soil and Water District recently voted to shut itself down. 61.")
62
Reason Saves Cleveland Reason Foundation video hosted by Drew Carey with policy ideas on how to “fix” Cleveland http://reason.com/archives/2010/ 03/14/reason-saves-cleveland- with-dr/1 http://reason.com/archives/2010/ 03/14/reason-saves-cleveland- with-dr/1 62

63
“Capitalism has been the most effective ideology we have known in taking people out of extreme poverty.” -- Bono 63

64
Economic Freedom Project http://www.economicfreedom.org/ https://www.facebook.com/economicfre edom https://www.facebook.com/economicfre edom Fraser Institute http://www.fraserinstitute.org/ http://www.freetheworld.com/ Economic Freedom of the World Economic Freedom of North America Human Freedom Index of the World

65
Economic Freedom: What It Is and Why It Matters DEAN STANSEL ASSOCIATE PROFESSOR OF ECONOMICS FLORIDA GULF COAST UNIVERSITY HTTP://WWW.DEANSTANSEL.COM HTTPS://WWW.FACEBOOK.COM/DEAN.STANSEL.1 HTTPS://TWITTER.COM/DEANSTANSEL

Similar presentations