Download presentation
Presentation is loading. Please wait.

1
Pattern of Disease Occurrence Person-Place-Time Manish Chaudhary MPH(BPKIHS) manish264@gmail.com
")
2
Characteristics of Person Because personal characteristics may affect illness, organization and analysis of data by “person” may use inherent characteristics of people (for example, age, sex, race), biologic characteristics (immune status), acquired characteristics (marital status), activities (occupation, leisure activities, use of medications/tobacco/drugs), or the conditions under which they live (socioeconomic status, access to medical care). Age and sex are included in almost all data sets and are the two most commonly analyzed “person” characteristics. However, depending on the disease and the data available, analyses of other person variables are usually necessary. Usually epidemiologists begin the analysis of person data by looking at each variable separately. Sometimes, two variables such as age and sex can be examined simultaneously. Person data are usually displayed in tables or graphs.

3
Age. Age is probably the single most important “person” attribute, because almost every health-related event varies with age. A number of factors that also vary with age include: susceptibility, opportunity for exposure, latency or incubation period of the disease, and physiologic response When analyzing data by age, epidemiologists try to use age groups that are narrow enough to detect any age-related patterns that may be present in the data. For some diseases, particularly chronic diseases, 10-year age groups may be adequate. For other diseases, 10-year and even 5-year age groups conceal important variations in disease occurrence by age. Consider the graph of pertussis occurrence by standard 5-year age groups shown in Figure 1.13a. The highest rate is clearly among children 4 years old and younger. But is the rate equally high in all children within that age group, or do some children have higher rates than others?

4
Figure 1.13a Pertussis by 5-Year Age Groups Figure 1.13b Pertussis by <1, 4-Year, Then 5-Year Age Groups

5
Bimodal distribution

6
Sex. Males have higher rates of illness and death than do females for many diseases. For some diseases, this sex-related difference is because of genetic, hormonal, anatomic, or other inherent differences between the sexes. These inherent differences affect susceptibility or physiologic responses. For example, premenopausal women have a lower risk of heart disease than men of the same age. This difference has been attributed to higher estrogen levels in women. On the other hand, the sex-related differences in the occurrence of many diseases reflect differences in opportunity or levels of exposure. For example, Figure 1.14 shows the differences in lung cancer rates over time among men and women. The difference noted in earlier years has been attributed to the higher prevalence of smoking among men in the past. Unfortunately, prevalence of smoking among women now equals that among men, and lung cancer rates in women have bee climbing as a result.

7
Figure 1.14 Lung Cancer Rates in the United States, 1930–1999

8
Ethnic and racial groups Sometimes epidemiologists are interested in analyzing person data by biologic, cultural or social groupings such as race, nationality, religion, or social groups such as tribes and other geographically or socially isolated groups. Differences in racial, ethnic, or other group variables may reflect differences in susceptibility or exposure, or differences in other factors that influence the risk of disease, such as socioeconomic status and access to health care. In Figure 1.15, infant mortality rates for 2002 are shown by race and Hispanic origin of the mother.

10
Socioeconomic Status It is made up of many variables such as occupation, family income, educational achievement or census track, living conditions, and social class. Nevertheless, epidemiologists commonly use occupation, family income, and educational achievement, while recognizing that these variables do not measure socioeconomic status precisely

11
Socioeconomic Status The frequency of many adverse health conditions increases with decreasing socioeconomic status. For example, tuberculosis is more common among persons in lower socioeconomic strata. Infant mortality and time lost from work due to disability are both associated with lower income. These patterns may reflect more harmful exposures, lower resistance, and less access to health care. Or they may in part reflect an interdependent relationship that is impossible to untangle: Does low socioeconomic status contribute to disability, or does disability contribute to lower socioeconomic status, or both?

12
Socioeconomic Status A few adverse health conditions occur more frequently among persons of higher socioeconomic status. Gout was known as the “disease of kings” because of its association with consumption of rich foods. Other conditions associated with higher socioeconomic status include breast cancer, diabetes, chronic fatigue syndrome. Differences in exposure account for at least some if not most of the differences in the frequency of these conditions

15
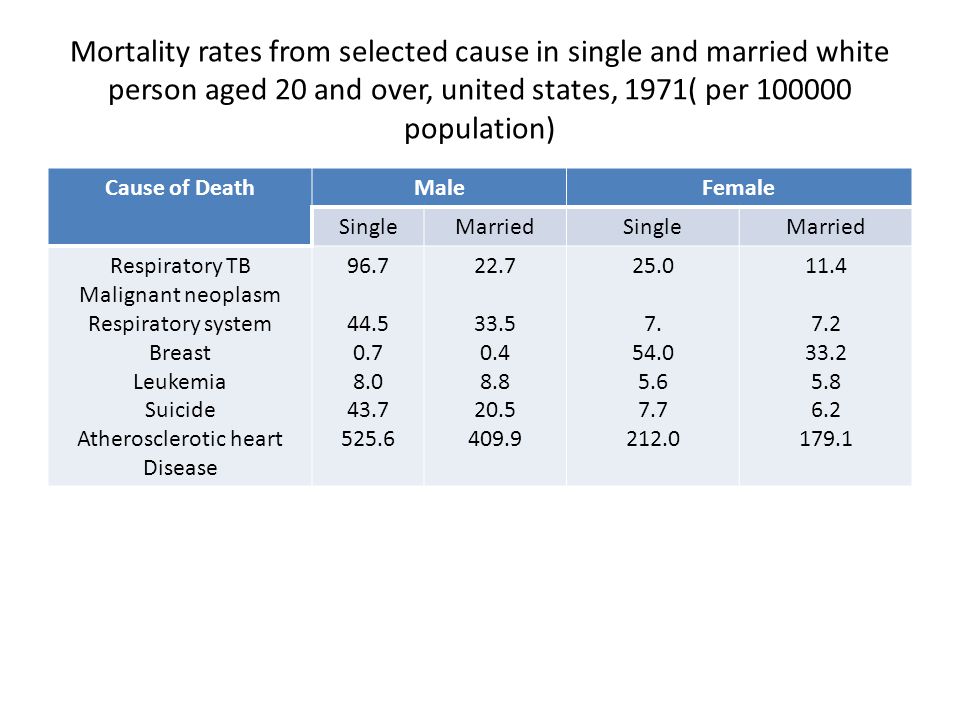
Marital Status The morbidity and mortality of many diseases have been shown to differ among single, married, widowed and divorced individuals.

16
Mortality rates from selected cause in single and married white person aged 20 and over, united states, 1971( per 100000 population) Cause of DeathMaleFemale SingleMarriedSingleMarried Respiratory TB Malignant neoplasm Respiratory system Breast Leukemia Suicide Atherosclerotic heart Disease 96.7 44.5 0.7 8.0 43.7 525.6 22.7 33.5 0.4 8.8 20.5 409.9 25.0 7. 54.0 5.6 7.7 212.0 11.4 7.2 33.2 5.8 6.2 179.1
17
Time distribution The disease rate may vary by the time of its occurrence i.e. by week, month, year etc. There are three kinds of time trends of disease occurrence: – Short terms fluctuations – Periodic fluctuations – Long term or secular trends

18
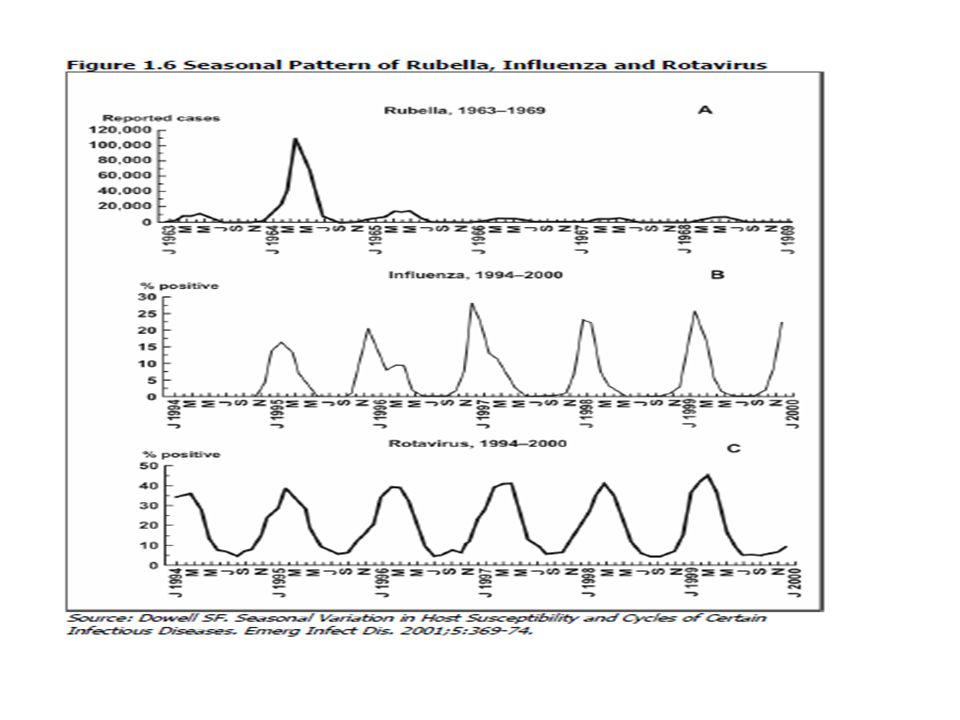
Short term fluctuations – Common source epidemics-well of contaminated water; food poisoning – Propagated epidemics- person to person, arthropod vector, animal reservoir – Slow modern epidemics- road accidents, blood cancer, hypertension Periodic fluctuations – Seasonal trend – Cyclic trend Long term or secular trends – Polio, malaria

21
Place distribution The geographic distribution of the disease varies because of variation in cultures, standard of living and external environments. The mortality, morbidity varies due to socioeconomic factors, dietary differences, cultures and behavior. International variations National variations Rural urban variations Local distributions

22
Place distribution International variation: The pattern of disease is not same everywhere e.g stomach cancer is more common in Japan but unusual in USA. National variation: Variation in disease occurrence exist within the country. E.g. worm disease, malaria etc vary within different parts of the country.

23
Place distribution Rural- urban variation: Chronic bronchitis, accidents, lung cancer, mental illness are usually more frequent in urban than rural areas. Skin diseases, soil transmitted helminthes may be more frequent in rural areas than in urban areas. Local distributions: Disease pattern also varies locally. It depends upon distribution of disease cause. Place of residence, birth place, place of employment, hospital unit etc. affect the occurrence of disease pattern. Local variations are best studied with the aid of spot maps or shaded maps. These maps show at a glance areas of high or low frequency, the boundaries and pattern of disease distribution. For example if the map shows clustering of cases, it may suggest a common source of infection( Cholera epidemic In London 1854)
.")
24
Thank You

Similar presentations


 Betty C. Jung, RN, MPH, CHES.>")


. Approximately.>")


 Betty C. Jung, RN, MPH, CHES.>")