Download presentation
Presentation is loading. Please wait.

1
Vibration Monitoring & Analysis

2
Vibration Monitoring What is Vibration ?
It is motion of mechanical parts back and forth from its position of rest /neutral position.

3
Vibration Monitoring What causes Vibration ? Induced Force &
Freedom for Movement

4
Harmful Effects of Excess vibration
Vibration Monitoring Harmful Effects of Excess vibration Increased load on BRGs: Reduced BRG Life Higher Forces on Mountings: Foundation Loosening and Damage of Support Structure Increased Stresses of M/c : Risk of fatigue components

5
Harmful Effects of Excess vibration
Vibration Monitoring Harmful Effects of Excess vibration Decreased Equipment efficiency. Reduced Output Quality. Increased Maintenance Cost due to more Component Failures and Unplanned Operations Unsafe Operating Environment

6
Vibration Monitoring Problem Identifications
Unbalance Misalignment Mechanical Looseness Antifriction / Sleeve Bearing Defects Gear Defects

7
Vibration Monitoring Problem Identifications
Belt Defects Impeller / Blade Defects Bent Shaft Electrical Problems Resonance

8
Vibration Monitoring Fundamental Realities All Machines vibrate.
An increase in vibration level is a sign of trouble & amplitude of Vibration depends on the extent of defect in the machinery components Each trouble will create vibration with different characteristics

9
VIBRATION FUNDAMENTALS
90 Upper Limit Neutral Position 180 TIME Lower Limit Period(T) (1 complete cycle) 270
 (1 complete cycle) 270.")
10
Characteristics of Vibration
Vibration characteristics are Amplitude Frequency Hz or CPM Phase Angle or clock face Displacement Velocity Acceleration

11
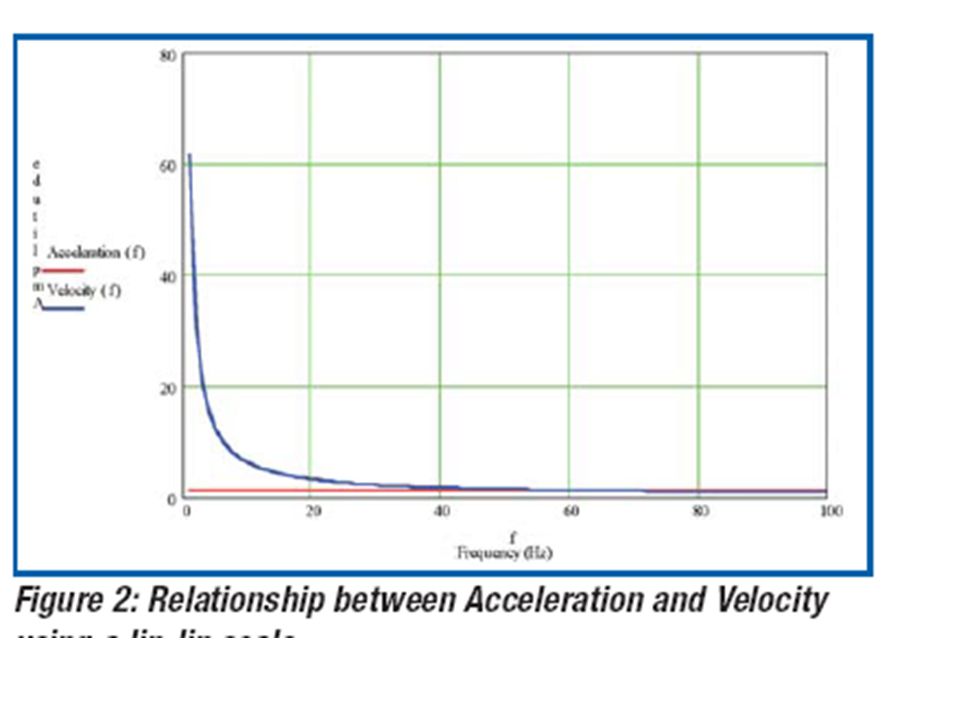
Parameter Selection Frequency sensitivity Displacement <600CPM
Velocity 600-60,000CPM Acceleration >60,000CPM Spike Energy/SEE Ultrasonic range

12
Frequency sensitivity

13
Vibration Monitoring Displacement Velocity Acceleration

14
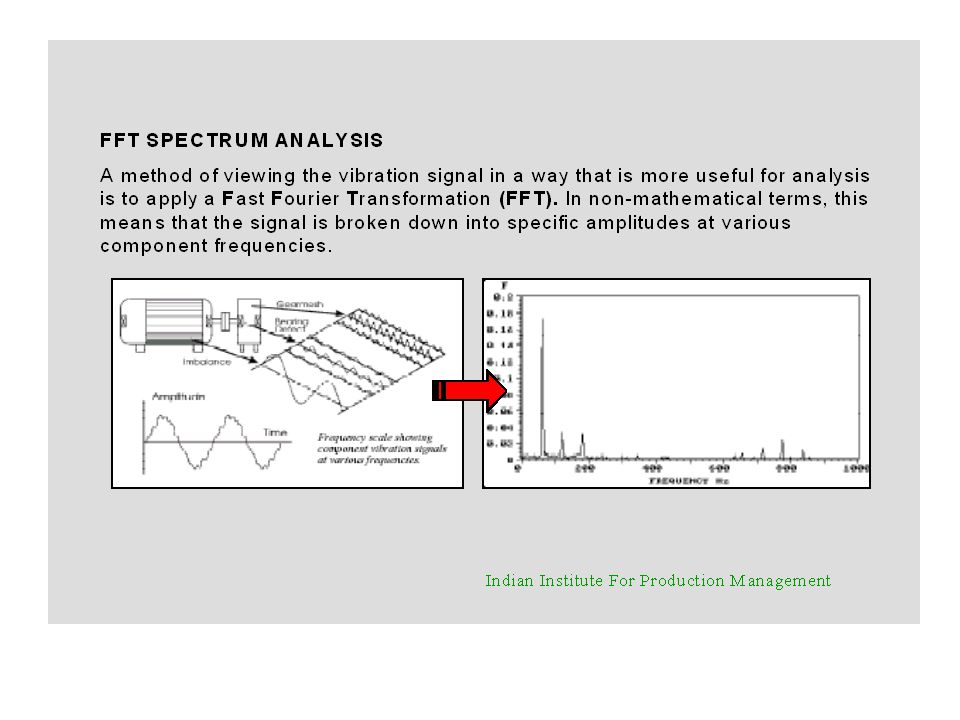
FFT FAST FOURIER TRANSFORM.
THE PROCESS OF TRANSFORMING TIME DOMAIN SIGNAL TO FREQUENCY DOMAIN. THE TIME DOMAIN SIGNAL MUST FIRST BE SAMPLED AND DIGITIZED.

16
Time Domain - overall data is the sum of all exciting and reacting forces
Imbalance Rolling Element Bearing Coupling chatter Gearmesh Time Resultant Complex Waveform

17
Enables precise evaluation of machinery condition and prediction
Spectrum Analysis Enables precise evaluation of machinery condition and prediction

18
Fmax, LINES, AVERAGES. Fmax REPRESENTS THE MAXIMUM FREQUENCY RANGE IN CPM OR HZ TO BE SCANNED BY THE INSTRUMENT. Fmax SHOULD NOT BE SET TOO HIGH SO THAT THE RESOLUTION AND ACCURACY SUFFERS OR IT SHOULD NOT BE TOO LOW SO THAT WE MISS SOME IMPORTANT HIGH FREQUENCIES.

19
GUIDELINES FOR SETTING Fmax.
FOR MACHINES HAVING ANTI-FRICTION BEARINGS:- Fmax = 60 x RPM FOR MACHINES HAVING SLEEVE BEARINGS:- Fmax = 20 x RPM FOR GEAR BOXES:- Fmax = 3.25 x GMF

20
LINES OF RESOLUTION THE RESOLUTION IS THE NUMBER OF LINES
OR CELLS WHICH ARE USED TO CALCULATE AND DISPLAY THE FREQUENCY SPECTRUM. THE BANDWIDTH CAN BE CALCULATED BY DIVIDING Fmax BY THE LINES OF RESOLUTION. THE GREATER THE NUMBER OF LINES , THE BETTER IS THE ACCURACY.

21
FREQUENCY RESOLUTION = Fmax total lines of resolution
Bandwidth = total lines of resolution total lines of resolution lines or bins or cells of resolution Amplitude Fmax Frequency

22
Spectrum Data Collection Time
FFT Calculation Time = Time to calculate FFT from Time Waveform [assuming no overlap processing] (60) ( #FFT Lines) (#Averages) FFT Calculation Time = Frequency Span Where: #FFT = Number of FFT Lines or Bins in Spectrum # Averages = Number of Averages Frequency Span measured in CPM
 ( #FFT Lines) (#Averages) FFT Calculation Time = Frequency Span. Where: #FFT = Number of FFT Lines or Bins in Spectrum. # Averages = Number of Averages. Frequency Span measured in CPM.")
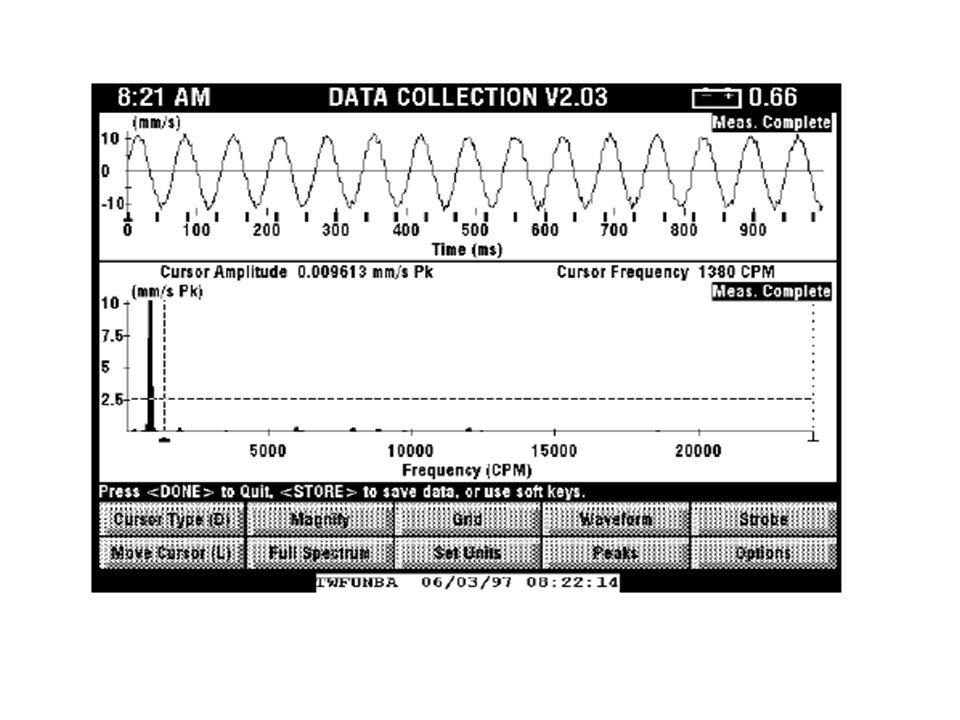
23
FFT SPECTRUM

24
OVERALL VIBRATION Total summation of all the vibration,with no regard to any particular frequency.

25
OVERALL VIBRATION Overall vibration is the total vibration energy measured within a frequency range. Measuring the “overall” vibration of a machine or component, a rotor in relation to a machine, or the structure of a machine, and comparing the overall measurement to its normal value (norm) indicates the current health of the machine. A higher than normal overall vibration reading indicates that “something” is causing the machine or component to vibrate more.
 indicates the current health of the machine. A higher than normal overall vibration reading indicates that something is causing the machine or component to vibrate more.")
26
Overall Vibration Total summation of all the vibration,with no
regard to any particular frequency. OA = OA=Overall level of Vibration Spectrum , Ai = Amplitude of each FFT line n = No. of FFT Lines of resolution , NBF= Noise Bandwidth for Window chosen 2 2 2 A A ………………………+An NBF

27
NOTE: Don’t be concerned about the math, the condition monitoring instrument calculates the value. What’s important to remember is when comparing overall vibration signals, it is imperative that both signals be measured on the same frequency range and with the same scale factors.

28
What is Phase? The position of a vibrating part at a given instant with reference to a fixed point or another vibrating part. The part of a vibration cycle through which one part or object has moved relative to another part. The unit of phase is degree where one complete cycle of vibration is 360 degrees.

29
Phase is a measurement, not a processing method
Phase is a measurement, not a processing method. Phase measures the angular difference between a known mark on a rotating shaft and the shaft’s vibration signal. This relationship provides valuable information on vibration amplitude levels,shaft orbit, and shaft position and is very useful for balancing and analysis purposes.

30
Vibration Phase

31
Additional Illustration on Phase

32
PHASE AN ILLUSTRATION 32 Micron 30 Micron 10 degrees 10 degrees
Shaft centre line moves up and down in a planer fashion

33
PHASE AN ILLUSTRATION 32 Micron 30 Micron 190 degrees 10 degrees
Shaft center line moves up and down in a rocking fashion

34
MACHINE TRAIN MISALIGNMENT
TURBINE G/B HP COMP LP COMP AXIAL PHASE (degrees) Note: All phase readings corrected for pickup direction
 Note: All phase readings corrected for pickup direction.")
35
Comparing Overall Levels Across Mounting Interfaces

36
Phase application C B A A 5 Microns, 10 degrees
B 7 Microns, 12 degrees C 25 Microns, 175 degrees Bolt at C is loose

37
Vibration Analysis of Common Problems

38
Vibration Analysis Unbalance
Amplitude proportional to the amount of unbalance Vibration high normally in radial direction (may be also in axial direction incase of overhung and flexible rotors ). 1* RPM vibration is greater than 80% (normally) of the overall reading.
. 1* RPM vibration is greater than 80% (normally) of the overall reading.")
39
Vibration Analysis Unbalance
Horizontal and vertical 1* RPM amplitude should be nearly same, although it also depends on system rigidity on the particular direction. Other frequency peaks may be less than 5% of the 1*RPM amplitude Phase shift of 90 deg. When sensor moves from horizontal to vertical.

40
UNBALANCE Operating conditions such as load, flow condition and temperature effect unbalance Balance under normal operating conditions Changes in track and pitch angle of fan blades can result in “Aerodynamic Unbalance”

41
Typical Spectrum For Unbalance

42
MISALIGNMENT BIGGEST PROBLEM INITIALLY
Operating temperature can affect alignment Machines aligned cold can go out when warm Bases or foundations can settle Grouting can shrink or deteriorate Increases energy demands

43
MISALIGNMENT Forces shared by driver and driven (not localized)
Level of misalignment severity is determined by the machines ability to withstand the misalignment If coupling is stronger than bearing the bearing can fail with little damage to the coupling

44
Three Types of Misalignment
Combination (most common) Angular Parallel or Offset
 Angular. Parallel or Offset.")
45
General Characteristics Of Misalignment
Radial vibration is highly directional 1X, 2x, and 3x running speed depending on type and extent of misalignment Angular 1x rpm axial Parallel x rpm radial (H & V) Combination 1,2,3x rpm radial and axial
 Combination 1,2,3x rpm radial and axial.")
46
Typical Spectrum for Misalignment

47
Vibration Analysis Misalignment
Angular Misalignment High axial vibration ( Greater than 50% of the radial vibration) 1* , 2*, 3* RPM normally high. 180 deg. Out of phase across the coupling
 1* , 2*, 3* RPM normally high. 180 deg. Out of phase across the coupling.")
48
Angular Misalignment Produces predominant 1x rpm component
Marked by 180 degree phase shift across the coupling in the axial direction

49
Vibration Analysis Misalignment
Off-Set Misalignment High Axial vibration. Also shows high radial vibrations. 1*, 2*, 3* RPM high. 2* often larger than 1* In case of severe misalignment, much high harmonics (4* - 8*) or even a whole series of high frequency harmonics will be generated. 180 deg. Out of phase across coupling
 or even a whole series of high frequency harmonics will be generated. 180 deg. Out of phase across coupling.")
50
Parallel Or Offset Misalignment
Produces a predominant 2x rpm peak in the spectrum Marked by 180 degree phase shift across the coupling in the radial direction.

51
Typical Spectrum for Misalignment

52
Axial Phase Showing Misalignment

53
Other Types Of Misalignment

54
Vibration Analysis Mechanical Looseness
Caused by structured looseness / weakness of machine feet, base plate or foundation; also by deteriorated grouting, loose base bolts and distortion of the frame or base. Radial vibration high 2* RPM & 1* RPM dominant 180 deg. Phase differences between mating surfaces which have looseness between them.

55
Vibration Analysis Mechanical Looseness
Caused by structured looseness / weakness of machine feet, base plate or foundation; also by deteriorated grouting, loose base bolts and distortion of the frame or base. Radial vibration high 2* RPM & 1* RPM dominant 180 deg. Phase differences between mating surfaces which have looseness between them.

56
Looseness Looseness produces 2X RPM Freq.

57
Vibration Analysis Mechanical Looseness
Caused by looseness in bearing housing bolts and cracks in the frame structure. Radial vibration high 2* RPM normally dominant. 0.5*, 1* and 3* RPM may also be present Substantial Phase difference between mating surfaces which have looseness between them

58
LOOSENESS Not an exciting force
Allows exciting frequencies already present to exhibit much higher amplitudes Loss or reduction in normal stiffness Caused by: loose mounting bolts deterioration of grouting cracked welds

59
Two Types Of Looseness Looseness of Rotating Components
Loose Rotors Bearings Loose on the Shaft or in Housing Excessive Sleeve Bearing Clearances Looseness of Support System Loose Mounting Bolts Grouting Deterioration Cracks Poor Support Frame Distortion

60
Looseness Of Rotating System
Rattling condition cause impacts due to excessive clearance in a rolling element or sleeve bearing Impacts cause multiple running speed harmonics to appear in the spectra Identified by: multiple harmonics unstable phase highly directional radial vibration

61
Typical Spectrum for Looseness of Rotating System

62
Looseness Of Support System
FFT readings show 1x rpm, 2x rpm, and 3x rpm components Structural looseness / weakness will cause high 1xrpm peak in FFT Identified by Highly directional radial vibration Bouncing Taking comparative phase readings across interfaces and look for amplitude variation Typically loose in vertical direction

63
Looseness Of Support System

64
Modern Trend in Vibration Technology

65
Condition Monitoring System Integration
WALKAROUND OFF- LINE Condition Monitoring System Integration CENTRALISED PROTECTION DISTRIBUTED CONTINUOUS SURVEILLANCE ON - LINE PERIODIC ON-LINE ANALYSIS NETWORK DCS SOFTWARE PdM TECHNOLOGIES CMMS

66
Overall Data Acquistion
4-20mA MONITOR THE DCS time waveform DCS OUTPUT

67
this is what the DCS records
Overall Data Trends- this is what the DCS records current value changes over time lo alarm hi alarm The limitation is that it does not adequately reflect changes at higher frequencies which can increase by 100% but only add 1% to the overall energy level

68
Vibration Analysis transducer time waveform Protection Monitor
and / or Data Collector Vibration Spectrum time waveform transducer

69
Band Alarms, associate with each rotating element
frequency bands hi alarm lo alarm

70
Band Trending, the new way forward
lo alarm hi alarm changes over time Trend and alarm the: Machine unbalance Alignment Gear mesh Bearings etc

71
Emonitor Odyssey: spectrum band alarming though its diagnostic tools feature for both On & Off line gives advanced machinery analysis and reduces False Alarms

72
EMONITOR Odyssey: Frequency Band Trends
Frequency Trend of Single Measurement

73
DIAGNOSTICS - the advantage of frequency band trending
Root cause analysis is a complex machine specific exercise considering all eventualities Expert systems are a one off diagnosis and do not show a trend Frequency band trending is specific to root cause analysis Band alarming also indicates vibration signals that are outside the established norms Trending alignment, unbalance, gear meshing and bearing condition condition is more specific A complex issue simplified without the need of specialist customisation and regular updates

74
DCS Limitations - Summary
We have shown that putting total belief in the DCS vibration trend is highly risky Machinery failures still happen with on-line vibration monitoring with 4-20mA data to the DCS. Most causes are due to higher frequency signals swamped by the overall levels. Advanced machinery protection through Frequency Band Trending and Alarming - more specific than an Expert system. The latest S/w based Analysers incorporates Narrow Band Alarming. They offer machinery protection and narrow band alarming. A lower cost solution is periodic manual Data Collection.

75
ESHAPE: Modal analysis using phase for advanced diagnosis and better understanding of system response

76
On line Vibration and other monitors
Innovative, fully-digital design Exceeds API 670 specification Widely-used system Fully field programmable Low installation cost ModBus protocol

77
TYPICAL APPLICATION

78
POWER PLANT INTEGRATION
DCS OPERATIONS ENGINEERING ODYSSEY SERVER DATA LOGGER VIBRATION ANALYSER FS HP LP GEN EX BFP ID BFP FD CWP PA TURBINE SUPERVISORY STATOR END WINDING GATEWAY TO CMMS AUXILIARIES

79
Plant Integration with LAN or WAN
DCS ENGINEERING ODYSSEY CLIENT SERVER VIBRATION ANALYSER ETHERNET CONTROL ROOM No 1 CONTROL ROOM No 2 CONTROL ROOM No 3 FS HP LP GEN EX FS HP LP GEN EX FS HP LP GEN EX GATEWAY TO CMMS ANURAKSHAN TG 1 TG 2 TG 3

80
NETWORKING THE INFORATION - LAN / WAN e.g.
RIHAND TALCHER PLANT OPERATIONS VINDHYACHAL NOIDA HQ CM CELL GATEWAY TO CMMS ANURAKSHAN KAYAMKULAM UNCHAHAR

81
Hyperlink to equipment
Using PlantLink Vibration Trend Plot Digital Picture of Plant Hyperlink to equipment Hierarchy Automatic notification on Equipment Alarm Status Click on Measurement Label to link to plots or other views.

82
Information however you want it !

83
X-Window Screen Captures

84
Scenario of Instruments &Sensors & Probes
Velocity sensors are made in India Accelerometers range over 150 types standard Low frequency High temperature (Gas Turbines) Special application Eddy current probes - comprehensive range Others available for process measurement
 Special application. Eddy current probes - comprehensive range. Others available for process measurement.")
85
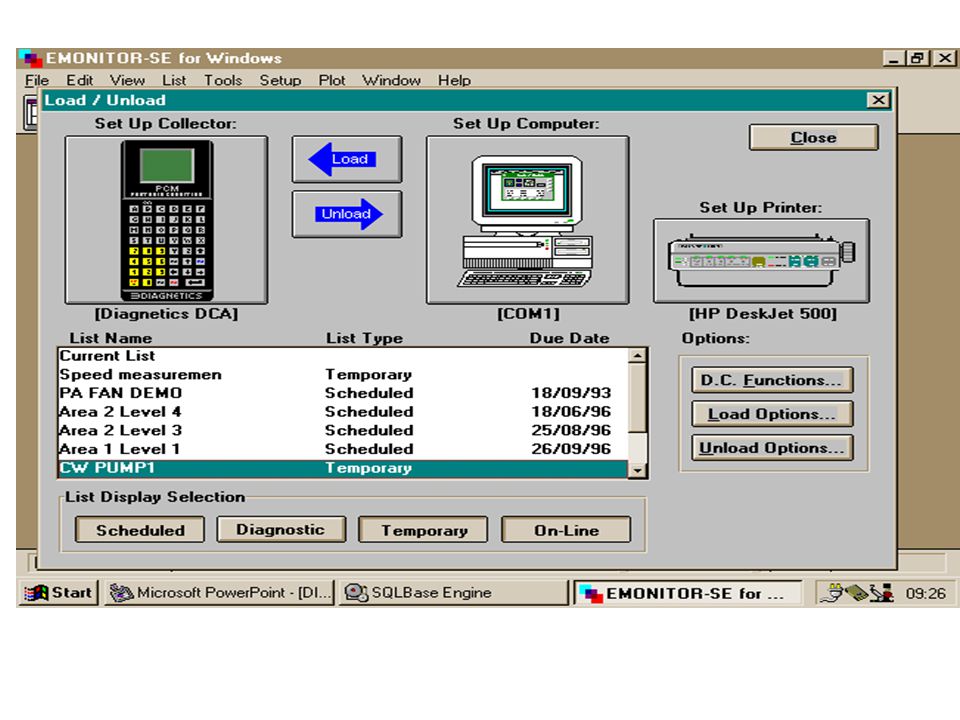
Vibration Datacollectors
Many vendors Select on ‘Fitness for Purpose’ Intrinsic Safety Dust & Moisture proof Diagnostic Capability

Similar presentations


>")


, NOIDA>")
 Control of Excitation Control of Vibration Source. Example: Balancing of Machines 3) Control of System Parameters Change of system.>")

