Download presentation
Presentation is loading. Please wait.

2
Cohort B Leadership Session March 3, 2008

3
Agenda

4
Cohort B Project Data: “How are we doing?” State Project Data

5
Cohort B Projectwide Data: Reviewing Outcomes (Winter 2006-Winter 2008) Grade/Measure Percent at Established/ Low Risk Winter 2006Winter 2007Winter 2008 Year 1Year 2Year 3 Kindergarten - PSF47%50% (+3)70% (+23) Kindergarten - NWF38%45% (+7)60% (+22) First Grade - NWF34%48% (+6)52% (+18) First Grade - ORF31%40% (+9)41% (+10) Second Grade - ORF42%49% (+7)53% (+9) Third Grade - ORF30%34% (+4)47% (+17)
 Grade/Measure Percent at Established/ Low Risk Winter 2006Winter 2007Winter 2008 Year 1Year 2Year 3 Kindergarten - PSF47%50% (+3)70% (+23) Kindergarten - NWF38%45% (+7)60% (+22) First Grade - NWF34%48% (+6)52% (+18) First Grade - ORF31%40% (+9)41% (+10) Second Grade - ORF42%49% (+7)53% (+9) Third Grade - ORF30%34% (+4)47% (+17)")
6
Cohort B Projectwide Data: Reviewing Outcomes (Winter 2006-Winter 2008) Grade/Measure Percent at Deficit/ At Risk Winter 2006Winter 2007Winter 2008 Year 1Year 2Year 3 Kindergarten - PSF27%24% (-3)11% (-16) Kindergarten - NWF39%30% (-9)16% (-13) First Grade - NWF27%18% (-9)15% (-12) First Grade - ORF34%24% (-10)23% (-11) Second Grade - ORF45%36% (-9)30% (-15) Third Grade - ORF45%40% (-5)28% (-17)
 Grade/Measure Percent at Deficit/ At Risk Winter 2006Winter 2007Winter 2008 Year 1Year 2Year 3 Kindergarten - PSF27%24% (-3)11% (-16) Kindergarten - NWF39%30% (-9)16% (-13) First Grade - NWF27%18% (-9)15% (-12) First Grade - ORF34%24% (-10)23% (-11) Second Grade - ORF45%36% (-9)30% (-15) Third Grade - ORF45%40% (-5)28% (-17)")
7
Cohort A Years 3-5 vs. Cohort B Years 1-3 Grade/Measure Percent at Established / Low Risk Winter 2006Winter 2007Winter 2008 Cohort A (Year 3) Cohort B (Year 1) Cohort A (Year 4) Cohort B (Year 2) Cohort A (Year 5) Cohort B (Year 3) Kindergarten-PSF 62%47%69%50%74%70% Kindergarten-NWF 53%38%60%45%66%60% First Grade-NWF 51%34%59%48%65%52% First Grade-ORF 44%31%48%40%51%41% Second Grade-ORF 52%42%54%49%57%53% Third Grade-ORF 42%30%47%34%49%47%
 Cohort B (Year 1) Cohort A (Year 4) Cohort B (Year 2) Cohort A (Year 5) Cohort B (Year 3) Kindergarten-PSF 62%47%69%50%74%70% Kindergarten-NWF 53%38%60%45%66%60% First Grade-NWF 51%34%59%48%65%52% First Grade-ORF 44%31%48%40%51%41% Second Grade-ORF 52%42%54%49%57%53% Third Grade-ORF 42%30%47%34%49%47%.")
8
Cohort A Years 3-5 vs. Cohort B Years 1-3 Grade/Measure Percent at Deficit / At Risk Winter 2006Winter 2007Winter 2008 Cohort A (Year 3) Cohort B (Year 1) Cohort A (Year 4) Cohort B (Year 2) Cohort A (Year 5) Cohort B (Year 3) Kindergarten-PSF 16%27%14%24%11% Kindergarten-NWF 23%39%17%30%14%16% First Grade-NWF 14%27%12%18%10%15% First Grade-ORF 23%34%19%24%16%23% Second Grade-ORF 33%45%32%36%31%30% Third Grade-ORF 33%45%29%40%27%28%
 Cohort B (Year 1) Cohort A (Year 4) Cohort B (Year 2) Cohort A (Year 5) Cohort B (Year 3) Kindergarten-PSF 16%27%14%24%11% Kindergarten-NWF 23%39%17%30%14%16% First Grade-NWF 14%27%12%18%10%15% First Grade-ORF 23%34%19%24%16%23% Second Grade-ORF 33%45%32%36%31%30% Third Grade-ORF 33%45%29%40%27%28%.")
9
NOTES: The dotted lines represent the 75th and 25th percentiles for the percent of students making AP based on all Oregon schools collecting DIBELS in 2004-05. Intact refers to students who have data in both fall and winter. Challenge contexts are based on the percent of kindergarteners identified as intensive in the fall. The least challenging context includes schools with fewer than 33% of kindergarteners identified as intensive, the moderate context includes schools with between 34 and 46% of kindergarteners identified as intensive, and the most challenging context includes schools with more than 46% of kindergarteners identified as intensive.

10
NOTES: The dotted lines represent the 75th and 25th percentiles for the percent of students making AP based on all Oregon schools collecting DIBELS in 2004-05. Intact refers to students who have data in both fall and winter. Challenge contexts are based on the percent of kindergarteners identified as intensive in the fall. The least challenging context includes schools with fewer than 33% of kindergarteners identified as intensive, the moderate context includes schools with between 34 and 46% of kindergarteners identified as intensive, and the most challenging context includes schools with more than 46% of kindergarteners identified as intensive.

11
NOTES: The dotted lines represent the 75th and 25th percentiles for the percent of students making AP based on all Oregon schools collecting DIBELS in 2004-05. Intact refers to students who have data in both fall and winter. Challenge contexts are based on the percent of kindergarteners identified as intensive in the fall. The least challenging context includes schools with fewer than 33% of kindergarteners identified as intensive, the moderate context includes schools with between 34 and 46% of kindergarteners identified as intensive, and the most challenging context includes schools with more than 46% of kindergarteners identified as intensive.

12
NOTES: The dotted lines represent the 75th and 25th percentiles for the percent of students making AP based on all Oregon schools collecting DIBELS in 2004-05. Intact refers to students who have data in both fall and winter. Challenge contexts are based on the percent of kindergarteners identified as intensive in the fall. The least challenging context includes schools with fewer than 33% of kindergarteners identified as intensive, the moderate context includes schools with between 34 and 46% of kindergarteners identified as intensive, and the most challenging context includes schools with more than 46% of kindergarteners identified as intensive.

13
NOTES: The dotted lines represent the 75th and 25th percentiles for the percent of students making AP based on all Oregon schools collecting DIBELS in 2004-05. Intact refers to students who have data in both fall and winter. Challenge contexts are based on the percent of kindergarteners identified as intensive in the fall. The least challenging context includes schools with fewer than 33% of kindergarteners identified as intensive, the moderate context includes schools with between 34 and 46% of kindergarteners identified as intensive, and the most challenging context includes schools with more than 46% of kindergarteners identified as intensive.

14
NOTES: The dotted lines represent the 75th and 25th percentiles for the percent of students making AP based on all Oregon schools collecting DIBELS in 2004-05. Intact refers to students who have data in both fall and winter. Challenge contexts are based on the percent of kindergarteners identified as intensive in the fall. The least challenging context includes schools with fewer than 33% of kindergarteners identified as intensive, the moderate context includes schools with between 34 and 46% of kindergarteners identified as intensive, and the most challenging context includes schools with more than 46% of kindergarteners identified as intensive.

15
Beacon Schools “The Reading First Center will identify Beacon Schools from the first 30-35 Reading First Schools in Cohort A - based on exceptional student performance and effective implementation of research-based reading practices. These Beacon Schools will serve as laboratory schools of research-based reading implementation for other Reading First schools, Pathfinder schools, state and private Colleges of Education, and interested elementary schools.” Oregon Reading First Application, p. 125

16
Announcing Beacon Schools! The Oregon Department of Education and Oregon Reading First Center have identified three Beacon Schools to serve as demonstration sites for schools throughout the state: Humboldt Elementary (Portland) (April 2008) Jefferson Elementary (Medford) (Fall 2008) David Hill Elementary (Hillsboro) (Winter 2009) Beacon Schools were selected on the basis of the progress they made in demonstrating high quality implementation of effective reading practices and strong student outcomes.
 (April 2008) Jefferson Elementary (Medford) (Fall 2008) David Hill Elementary (Hillsboro) (Winter 2009) Beacon Schools were selected on the basis of the progress they made in demonstrating high quality implementation of effective reading practices and strong student outcomes..")
17
Beacon Schools “Hope for Humboldt” What will happen on a visit? How can we schedule a visit? For more information please check the Oregon Reading First Center website (http://oregonreadingfirst.uoregon.edu)http://oregonreading

18
Humboldt Elementary, Portland Public Schools 4915 N. Gantenbein Portland, OR 97217 (503) 916-5468 Principal: Jamila Williams Coach: Mary Peake OPEN TO VISITORS IN APRIL 2008 Humboldt Elementary To schedule a visit, please contact: Mary Peake (mpeake@pps.k12.or.us)
 Principal: Jamila Williams Coach: Mary Peake OPEN TO VISITORS IN APRIL 2008 Humboldt Elementary To schedule a visit, please contact: Mary Peake")
19
Jefferson Elementary, Medford School District 333 Holmes Ave. Medford, OR 97501 (541) 842-3800 Principal: Susan Inman Coach: Kathy Staller OPEN TO VISITORS IN FALL 2008 Jefferson Elementary To schedule a visit, please contact: Kathy Staller (kathy.staller@medford.k12.or.us
 Principal: Susan Inman Coach: Kathy Staller OPEN TO VISITORS IN FALL 2008 Jefferson Elementary To schedule a visit, please contact: Kathy Staller")
20
David Hill Elementary Hillsboro School District 440 SE Oak St. Hillsboro, OR 97123 (503) 844-1680 Principal: Toni Crummett Coach: Connie Robertson OPEN TO VISITORS IN JANUARY 2009 at Lincoln Street Elementary To schedule a visit, please contact: TBD
 Principal: Toni Crummett Coach: Connie Robertson OPEN TO VISITORS IN JANUARY 2009 at Lincoln Street Elementary To schedule a visit, please contact: TBD.")
21
Cohort B Continuation Process Timeline Deliverables

22
2008-2009 Funding

23
Oregon’s K-3 Literacy Framework Presented to the LLSSC November 15, 2007

24
Components of the Framework Goals Assessment Instruction Leadership Professional Development Commitment

25
Outline for Oregon’s K-3 Literacy Framework 1.A schoolwide priority on K-3 reading goals is established. 2.Reliable and valid reading assessments are used to inform instructional practices. 3.Reading instructional time is protected and sufficient for all students to meet reading goals. 4.Instructional programs and materials are based on research and linked to reading goals.

26
Outline for Oregon’s K-3 Literacy Framework 5. Differentiated instruction is an integral part of the schoolwide reading plan and is used to help all students meet reading goals. 6.Leadership prioritizes attainment of reading goals for all students. 7.High quality professional development must be linked to the school’s reading goals and program. 8.Schoolwide commitment to meeting reading goals.

28
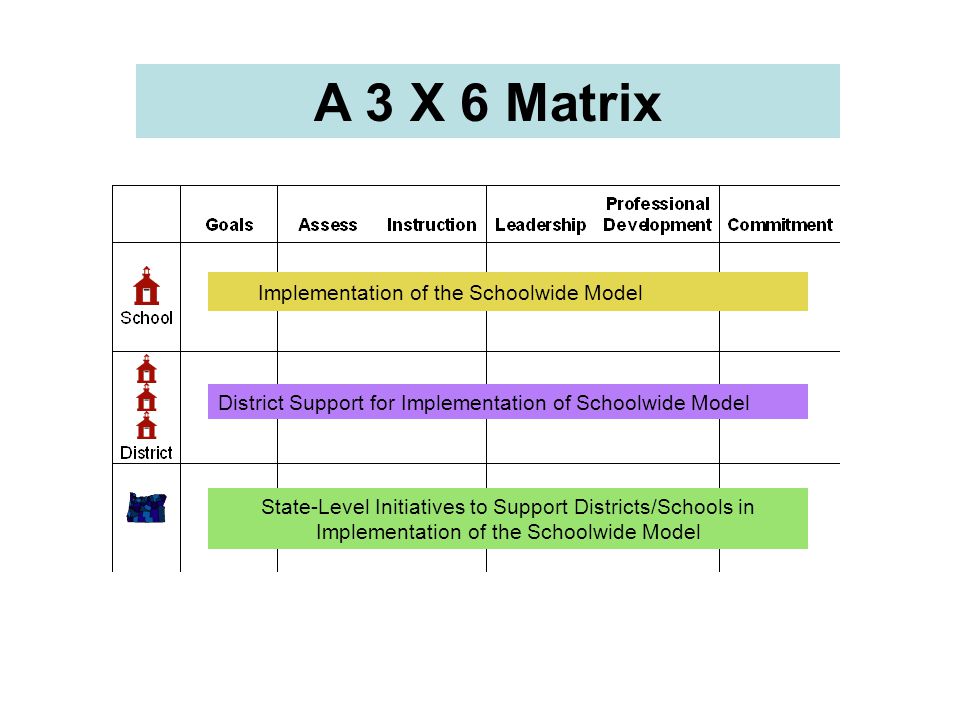
A 3 X 6 Matrix Implementation of the Schoolwide Model District Support for Implementation of Schoolwide Model State-Level Initiatives to Support Districts/Schools in Implementation of the Schoolwide Model

30
At the School Level Preamble Chapters 1-6 IN DRAFT FORM provide conceptual understanding and practical examples literature referenced in footnotes resources and tools referenced in text and in footnotes

31
At the District Level

32
At the State Level GoalsAssessmentInstructionLeadershipProfessional Development Commitment State

33
At the State Level PROFESSIONAL DEVELOPMENT: Sample Policy Considerations: What implications does the Oregon Literacy Framework have for preservice PD for teachers, coaches, specialists, and school, district, and state leaders? What role and responsibilities do institutions of higher education have in helping build the capacity to implement the Oregon Literacy Framework?

34
At the State Level What role should ODE – or the LLSSC – play in directing decisions of districts and schools to build effective, strong beginning reading programs through the implementation of the Oregon Literacy Framework?

35
School-Level Literacy Plans Purpose of a Literacy Plan Action Plans vs. Literacy Plans

36
Framework for School-Level Literacy Plans Part 1: Introduction Provides an overview of key components of literacy plan. Part 2: Details Provides details on how school will apply the key components identified in the Introduction.

37
Introduction The introduction states school’s commitment to reading instruction K-3 and the role of the schoolwide beginning reading model. Why is early reading instruction and achievement important to the school? What are the reading goals at the school? How will the components of the schoolwide reading model help meet the reading goals? How will the school use the literacy plan?

38
Details School Literacy Plan - Part 2 DRAFT Date: Literacy Plan Review Timeline: Component 1: Goals Primary Reading Goal: Formative Reading Goals: Kindergarten Phonemic AwarenessMiddle: End: PhonicsMiddle: End: First Grade: PhonicsBeginning: Middle: FluencyMiddle: End:

39
Details School Literacy Plan - Part 2 DRAFT Second Grade FluencyBeginning: Middle: End: Third Grade: FluencyBeginning: Middle: End: School-Level Goals for Overall Improvement: K: 1:

40
Remember, school-level literacy plans are a tool for sustainability. Don’t focus discussion on what you are doing this year with Reading First funding. Instead, focus these plans and the discussion on how you will do things in your building next year without funding.

41
Hillsboro District Literacy Plan

42
Agenda

Similar presentations
 in Primary Grades>")


 2007 by the Oregon Reading First Center Center on Teaching and Learning.>")

 2006 by the Oregon Reading First Center Center on Teaching and Learning.>")
 October 21, 2005 (Cohort A) Erb Memorial Union University of Oregon Eugene, Oregon.>")


1 Oregon Reading First Webinar Data-based Action Planning Winter 2009.>")


1 Oregon Reading First Regional Coaches’ Meeting May 13, 2010.>")

1 Oregon Reading First Regional Coaches’ Meeting May 2009.>")
1 Oregon Reading First Conference Call Data-based Action Planning Winter 2008.>")
