Download presentation
Presentation is loading. Please wait.

1
Torsional oscillator and specific heat measurements on solid helium PITP-Outing Lodge workshop, July 22, 2007 Moses Chan - Penn State

2
Outline Introduction Torsional oscillator measurements on solid samples grown under constant temperature /constant pressure condition. Thermal history studies Specific heat measurements

3
Superfluidity in liquid 4 He Superfluid Superfluid helium film helium film can flow up can flow up a wall a wall Superfluid Superfluid Fountain Fountain Solid Superfluid ( He II ) Normal Liquid ( He I ) T =2.176K
 Normal Liquid ( He I ) T =2.176K")
4
Lindemann Parameter the ratio of the root mean square of the displacement of atoms to the interatomic distance (d a ) A classical solid will melt if the Lindemann ’ s parameter exceeds the critical value of ~0.1. X-ray measurement of the Debye-Waller factor of solid helium at ~0.7K and near melting curve shows this ratio to be 0.262. (Burns and Issacs, Phys. Rev. B 55, 5767(1997)) Zero-point Energy Inter-atomic potential total energy zero-point energy
) Zero-point Energy Inter-atomic potential total energy zero-point energy.")
5
Theoretical ‘ consensus ’ in 1970s: Superfluidity in solid is not impossible! - If solid 4 He can be described by a Jastraw-type wavefunction that is commonly used to describe liquid helium then crystalline order (with finite fraction of vacancies) and BEC can coexist. G.V. Chester, Lectures in Theoretical Physics Vol XI-B(1969); Phys. Rev. A 2, 256 (1970) J. Sarfatt, Phys. Lett. 30A, 300 (1969) L. Reatto, Phys. Rev. 183, 334 (1969) - Andreev and Liftshitz assume the specific scenario of zero- point vacancies and other defects ( e.g. interstitial atoms) undergoing BEC and exhibit superfluidity. Andreev & Liftshitz, Zh.Eksp.Teor.Fiz. 56, 205 (1969).
 and BEC can coexist. G.V. Chester, Lectures in Theoretical Physics Vol XI-B(1969); Phys. Rev. A 2, 256 (1970) J. Sarfatt, Phys. Lett. 30A, 300 (1969) L. Reatto, Phys. Rev. 183, 334 (1969) - Andreev and Liftshitz assume the specific scenario of zero- point vacancies and other defects ( e.g. interstitial atoms) undergoing BEC and exhibit superfluidity. Andreev & Liftshitz, Zh.Eksp.Teor.Fiz. 56, 205 (1969)..")
6
f s (T) is the supersolid fraction Its upper limit is estimated by different theorists to range from 10 -6 to 0.4; Leggett: 10 -4 Solid Helium R I(T)=I classical [1-f s (T)] Quantum exchange of particles arranged in an annulus under rotation leads to a measured moment of inertia that is smaller than the classical value The ideal method of detection of superfluidity is to subject solid to dc or ac rotation and look for evidence of nonclassical rotational inertia A. J. Leggett, PRL 25, 1543 (1970)
![f s (T) is the supersolid fraction Its upper limit is estimated by different theorists to range from to 0.4; Leggett: Solid Helium R I(T)=I classical [1-f s (T)] Quantum exchange of particles arranged in an annulus under rotation leads to a measured moment of inertia that is smaller than the classical value The ideal method of detection of superfluidity is to subject solid to dc or ac rotation and look for evidence of nonclassical rotational inertia A.](http://images.slideplayer.com/17/5364964/slides/slide_6.jpg "J. Leggett, PRL 25, 1543 (1970).")
7
Torsional Oscillator Technique is ideal for the detection of superfluidity Drive Detection 3.5 cm Torsion rod Torsion cell f0f0 ff Amp Quality Factor Q= f 0 / f ~10 6 Stability in the period is ~0.1 ns Frequency resolution of 1 part in 10 7 Mass sensitivity of ~10 -7 g f~ 1kHz

8
Torsional oscillator studies of superfluid films I total = I cell + I helium film, Above Tc the adsorbed normal liquid film behaves as solid and oscillates with the cell. In the superfluid phase, helium film decouples from oscillation. Hence I total and drops. Vycor Berthold,Bishop, Reppy, PRL 39,348(1977) ΔΔ
 ΔΔ .")
9
Blocked capillary (BC) method of growing solid samples heat drain Be-Cu torsion rod and fill-line solid blocks fill-line gravity
 method of growing solid samples heat drain Be-Cu torsion rod and fill-line solid blocks fill-line gravity")
10
Solid 4 He at 62 bars in Vycor glass Period shifted by 4260ns due to mass loading of solid helium *=966,000ns

11
Supersolid response of helium in Vycor glass Period drops at 175mK appearance of NCRI size of period drop - ~17ns *=971,000ns

12
Solid helium in Vycor glass - * [ns] *=971,000ns 62bar Total mass loading = 4260ns Measured decoupling, - o =17ns NCRIF = 0.4% (with tortuosity, 2% ) f 0 =1024Hz 7nm E. Kim & M.H.W. Chan, Nature 427, 225 (2004).
![Solid helium in Vycor glass - * [ns] *=971,000ns 62bar Total mass loading = 4260ns Measured decoupling, - o =17ns NCRIF = 0.4% (with tortuosity, 2% ) f 0 =1024Hz 7nm E.](http://images.slideplayer.com/17/5364964/slides/slide_12.jpg "Kim & M.H.W. Chan, Nature 427, 225 (2004)..")
13
Solid helium in porous gold E. Kim & M.H.W. Chan, JLTP 138, 859 (2005). f 0 =359Hz 27bar Total mass loading = 1625ns Measured decoupling, - o =13ns NCRIF = 0.8% (with tortuosity, 1.2% ) 490nm
 490nm.")
14
Bulk solid helium in annulus Torsion cell with helium in annulus Mg disk Filling line Solid helium in annular channel Al shell Channel OD=10mm Width=0.63mm Drive Detection 3.5 cm Torsion rod Torsion cell

15
E. Kim & M.H.W. Chan, Science 305, 1941 (2004) f 0 =912Hz Bulk solid helium in annulus 51bar Total mass loading = 3012ns Measured decoupling, - o =41ns NCRIF = 1.4%
 f 0 =912Hz Bulk solid helium in annulus 51bar Total mass loading = 3012ns Measured decoupling, - o =41ns NCRIF = 1.4%.")
16
Total mass loading =3012ns at 51 bars ρS/ρρS/ρ |v| max Non-Classical Rotational Inertia Fraction

17
Superfluids exhibit potential (irrotational) flow – For our exact dimensions, NCRIF in the blocked cell should be about 1% that of the annulus* *E. Mueller, private communication. Irrotational Flow

18
Solid 4 He at various pressures show similar temperature dependence, but the measured supersolid fraction shows scatter with no obvious pressure dependence NCRIF

19
Pressure dependence of supersolid fraction Blue data points were obtained by seeding the solid helium samples from the bottom of the annulus. NCRIF What are the causes of the scatter in NCRIF?

20
Large number of experimental parameters. 1.Pressure 2.Oscillation speed. 3. 3 He concentration ( Eunseong Kim) 4. Sample geometry/ crystal quality 5. Frequency of measurement ( Kojima)
 4. Sample geometry/ crystal quality 5. Frequency of measurement ( Kojima).")
21
Strong and ‘universal’ velocity dependence in all annular samples v C ~ 10µm/s =3.16µm/s for n=1 ω R Vortices are important

22
3 He Effect E. Kim, J. S. Xia, J. T. West, X. Lin, and M. H. W. Chan, To be published. Eunseong Kim

23
Data shifted vertically for easy comparison 3 He Effect of solid 4 He in Vycor

24
Nonclassical rotational inertia results have been replicated in four labs. The temperature dependence of NCRI is reproduced. However, the magnitude of NCRI varies from 0.03% up to 20%(!!) NCRI in cell with simple cylindrical geometry appears to be smaller than that in annular geometry. 20% NCRI was seen by Rittner and Reppy in solid confined in a very narrow annulus of 0.15mm in width.
 NCRI in cell with simple cylindrical geometry appears to be smaller than that in annular geometry. 20% NCRI was seen by Rittner and Reppy in solid confined in a very narrow annulus of 0.15mm in width..")
25
NCRI in open geometry appears to be smaller than in an annulus

26
Annealing effects f 0 =185Hz Quenched samples show large NCRI (~0.5%) Annealed samples show NCRI < 0.05% Velocities are between 9 m/s and 45 m/s A.S. Rittner & J.D. Reppy, PRL 97, 165301 (2006).
..")
27
The variation in NCRI and the annealing effect seen by Rittner and Reppy suggest disorder in solid at least enhances NCRI. What kind of disorder? Vacancies and interstitials, dislocation lines and grain boundaries. It has been proposed that the observed effect is due to superfluid film flow along the grain boundaries.

28
High quality single crystals have been grown under constant temperature 1 and pressure 2 Best crystals grown in zero temperature limit Crystal Growth 1. O.W. Heybey & D.M. Lee, PRL 19, 106 (1967); S. Balibar, H. Alles & A. Ya Parshin, Rev. Mod. Phys. 77, 317 (2005). 2. L.P. Mezhov-Deglin, Sov. Phys. JETP 22, 47 (1966); D.S. Greywall, PRA 3, 2106 (1971).
; S. Balibar, H. Alles & A. Ya Parshin, Rev. Mod. Phys. 77, 317 (2005). 2. L.P. Mezhov-Deglin, Sov. Phys. JETP 22, 47 (1966); D.S. Greywall, PRA 3, 2106 (1971)..")
29
Constant T/P growth from superfluid (1ppb 3 He) Heat in Heat out Q ~ 500,000 Tony Clark and Josh West
 Heat in Heat out Q ~ 500,000 Tony Clark and Josh West")
30
BC samples can also be grown Heat out Q ~ 500,000

31
NCRI in solid helium (1ppb 3 He) Samples grown carefully from superfluid collapse onto one curve for T > 40mK and share common onset temperature, T C ~ 80mK NCRIF ~ 0.3%
 Samples grown carefully from superfluid collapse onto one curve for T > 40mK and share common onset temperature, T C ~ 80mK NCRIF ~ 0.3%")
32
NCRI in solid helium (1ppb 3 He) Samples grown carefully from superfluid collapse onto \ one curve for T > 40mK and share common onset temperature, T C ~ 80mK NCRIF ~ 0.3%
 Samples grown carefully from superfluid collapse onto \ one curve for T > 40mK and share common onset temperature, T C ~ 80mK NCRIF ~ 0.3%")
33
NCRI in solid helium (1ppb 3 He) Samples grown carefully from superfluid collapse onto one curve for T > 40mK and share common onset temperature, T C ~ 80mK NCRIF ~ 0.3%
 Samples grown carefully from superfluid collapse onto one curve for T > 40mK and share common onset temperature, T C ~ 80mK NCRIF ~ 0.3%")
34
NCRI in solid helium (1ppb 3 He) Samples grown carefully from superfluid collapse onto one curve for T > 40mK and share common onset temperature, T C ~ 80mK NCRIF ~ 0.3%
 Samples grown carefully from superfluid collapse onto one curve for T > 40mK and share common onset temperature, T C ~ 80mK NCRIF ~ 0.3%")
35
NCRI in solid helium (1ppb 3 He) Samples grown carefully from superfluid collapse onto one curve for T > 40mK and share common onset temperature, T C ~ 80mK NCRIF ~ 0.3%
 Samples grown carefully from superfluid collapse onto one curve for T > 40mK and share common onset temperature, T C ~ 80mK NCRIF ~ 0.3%")
36
NCRI in solid helium (1ppb 3 He) Samples grown carefully from superfluid collapse onto one curve for T > 40mK and share common onset temperature, T C ~ 80mK NCRIF ~ 0.3%
 Samples grown carefully from superfluid collapse onto one curve for T > 40mK and share common onset temperature, T C ~ 80mK NCRIF ~ 0.3%")
37
NCRI in solid helium (1ppb 3 He) Samples grown carefully from superfluid collapse onto one curve for T > 40mK and share common onset temperature, T C ~ 80mK NCRIF ~ 0.3%
 Samples grown carefully from superfluid collapse onto one curve for T > 40mK and share common onset temperature, T C ~ 80mK NCRIF ~ 0.3%")
38
Comparison of BeCu & AgCu cells -For a particular cell, NCRIF in BC samples > NCRIF in CT/CP samples -T O also higher in BC samples -Order of magnitude difference in NCRIF between two cells

39
NCRIF increases upon annealing T F =2.2K (45.5bar) 1 st anneal: 5hr at 1.75K 2 nd anneal: ~20min above 1.5K Annealing in AgCu cell (300ppb)
 1 st anneal: 5hr at 1.75K 2 nd anneal: ~20min above 1.5K Annealing in AgCu cell (300ppb)")
40
-Annealing BC samples usually decreases large NCRIF’s -CT sample unchanged -Need to be very close to T F for high pressure samples -Most dramatic change occurs in (likely polycrystalline) sample at low pressure Annealing in BeCu cell (1ppb)
 sample at low pressure Annealing in BeCu cell (1ppb)")
41
Annealing of CT sample Melting temperature = 1.38K

42
2 hour anneal at 1.28K Annealing of CT sample

43
Melting temperature = 1.38K Additional 37 hours near 1.35K Annealing of CT sample

44
Again Annealing of BC sample

45
NCRIF, Q -1, and T O converge on that of the CT sample Annealing of BC sample

46
Reproducible results (1ppb) 8 CT samples & 1 annealed BC sample collapse onto a single curve above 40mK
 8 CT samples & 1 annealed BC sample collapse onto a single curve above 40mK")
47
High temperature tail of NCRI Transition broadened in BC samples (probably “polycrystalline”) and by 3 He impurities
 and by 3 He impurities")
48
Grain boundaries surely cannot be the sole mechanism. What then is the cause for variation in NCRI from cell to cell? Dislocation lines with density that ranges from 10 5 cm -2 to 10 10 cm -2 and in particular how the interaction of vortices and 3 He with dislocation lines are important.

49
Annealing lowers NCRIF, T O, and Q -1 peak Annealing of BC sample

50
Anderson’s vortex liquid model Just a few details: -”Free” vortices (relative to time scale of oscillator = resonant period) can respond to motion of oscillator and screen supercurrents, reducing measured NCRIF -NCRI related to susceptibility of vortices: NCRIF largest when they are “pinned” - 3 He may attach to vortices and slow them down (higher T O ) -Dissipation peak: vortex rate of motion ~ oscillator frequency (higher frequency, higher T O ) P.W. Anderson, Nature Phys. 3, 160 (2007).
..")
51
Frequency dependence -T O increases with frequency -Low temperature NCRIF unchanged Aoki, Graves & Kojima, PRL 99, 015301 (2007). ~150mK ~220mK

52
Critical velocity…vortices? Velocity dependence v C ~ 10µm/s =3.16µm/s for n=1 ω R E. Kim & M.H.W. Chan, PRL 97, 115302 (2006).
..")
53
Critical velocity in single crystals of 1ppb purity? Velocity dependence ω R

54
Thermal history of 1ppb samples More systematic study on a sample grown under constant P Reproducible warming/cooling scans in the low velocity limit, i.e. ~1 m/s

55
Thermal history of 1ppb samples More systematic study on a sample grown under constant P Velocity increased (to 20 m/s) at low temperature NCRIF unchanged 1
 at low temperature NCRIF unchanged 1")
56
Thermal history of 1ppb samples More systematic study on a sample grown under constant P Decay of NCRI above 30mK Cooling from 40mK “freezes in” NCRIF 1 2 3

57
Thermal history of 1ppb samples More systematic study on a sample grown under constant P Decay appears faster at higher temperature (but depends on initial conditions) 1 2 3 4 5
")
58
Thermal history of 1ppb samples More systematic study on a sample grown under constant P Exponential decay at 60mK with time constant of 2 hours NCRIF reversible when warming/cooling above 60mK at 20 m/s 6 8 7

59
For T < 60mK, different decay above & below the low velocity field trace NCRIF decay

60
Metastability also in BC samples, but high speed trace always below that of low speed –Quick decay for large differences in metastable and stable NCRIF values –BC: T O is smallest at high speed, CT: T O is independent of speed NCRIF decay

61
Different velocity dependence for samples grown at CT/CP and by BC -No saturation in the (presumably) worst quality crystals -If there is a “critical velocity,” it is very low Data extracted from cooling scans!!
 worst quality crystals -If there is a critical velocity, it is very low Data extracted from cooling scans!!")
62
Onset of NCRI is ~80mK in single crystal samples –Same for all CT/CP samples –Same for some BC samples after considerable annealing –Same for all samples at large rim speed Several parameters produce rounding of onset –Isotopic impurities –Finite measurement frequency –Polycrystallinity NCRI response to rim speed consistent with vortex susceptibility –Vortices pinned below some T < 60mK (vortex pinning critical temperature?) –Residual defects determine degree of vortex pinning Conclusions
 –Residual defects determine degree of vortex pinning Conclusions")
63
Heat capacity Xi Lin and Anthony Clark Is NCRI due to a glassy phase or glassy regions in solid helium?

64
Previous solid 4 He heat capacity measurements below 1K Year Low temperature limit Swenson 1 1962,19670.2K Edwards 2 19650.3K Gardner 3 19730.35K Adams 4 19750.13K Hebral 5 19800.1K Clark 6 20050.08K 1.E. C. Heltemes and C. A. Swenson, Phys. Rev. 128, 1512 (1962); H. H. Sample and C. A. Swenson, Phys. Rev. 158, 188 (1967). 2.D. O. Edwards and R. C. Pandorf, Phys. Rev. 140, A816 (1965). 3.W. R. Gardner et al., Phys. Rev. A 7, 1029 (1973). 4.S. H. Castles and E. D. Adams, J. Low Temp. Phys. 19, 397 (1975). 5.B. Hébral et al., Phonons in Condensed Matter, edited by H. J. Maris (Plenum, New York, 1980), pg. 169. 6.A. C. Clark and M. H. W. Chan, J. Low Temp. Phys. 138, 853 (2005). They all observed T 3 phonon contribution. Their sample cells used in these experiments were all constructed with heavy wall metal or epoxy which contribute significantly to the heat capacity at low temperature.
; H. H. Sample and C. A. Swenson, Phys. Rev. 158, 188 (1967). 2.D. O. Edwards and R. C. Pandorf, Phys. Rev. 140, A816 (1965). 3.W. R. Gardner et al., Phys. Rev. A 7, 1029 (1973). 4.S. H. Castles and E. D. Adams, J. Low Temp. Phys. 19, 397 (1975). 5.B. Hébral et al., Phonons in Condensed Matter, edited by H. J. Maris (Plenum, New York, 1980), pg A. C. Clark and M. H. W. Chan, J. Low Temp. Phys. 138, 853 (2005). They all observed T 3 phonon contribution. Their sample cells used in these experiments were all constructed with heavy wall metal or epoxy which contribute significantly to the heat capacity at low temperature..")
65
Is there a linear T term? T 3 only: Edwards, Hébral T 3 +T 7 : Gardner T 3 +T: YearDensity [cc mol -1 ] Linear slope [J mol -1 K -2 ] T limit [K] Note Swenson 1 196214.50 16.74 20.64 21.04 3.3*10 -3 7.1*10 -3 8.8*10 -3 5.0*10 -3 0.2 12 4 He samples. A tendency of higher linear term at higher molar volumes. In agreement with J. P. Franck. Franck 2 196414.88 16.30 0.8*10 -3 2.5*10 -3 1.3 Annealing samples cut down the linear term by 30%. Temperature range is 1.3 to 4K Swenson 3 196712.230.2*10 -3 0.3 No effects due to annealing or cooling sample down slowly Adams 4 197519.43 20.59 0.9*10 -3 2.5*10 -3 0.13 Anneal the sample for about two hours 1.E. C. Heltemes and C. A. Swenson, Phys. Rev. 128, 1512 (1962). 2.J. P. Franck, Phys. Lett. 11, 208 (1964). 3.H. H. Sample and C. A. Swenson, Phys. Rev. 158, 188 (1967). 4.S. H. Castles and E. D. Adams, J. Low Temp. Phys. 19, 397 (1975).
. 2.J. P. Franck, Phys. Lett. 11, 208 (1964). 3.H. H. Sample and C. A. Swenson, Phys. Rev. 158, 188 (1967). 4.S. H. Castles and E. D. Adams, J. Low Temp. Phys. 19, 397 (1975)..")
66
Linear term, on top of phonon term for the whole temperature range Later study on heat capacity of solid 3 He doesn’t observe the same excess linear heat capacity. (Greywall, PRB, 15,2604,1977) Adams Frank 3 He
 Adams Frank 3 He.")
67
Results from Edwards and Hebral The background problem Edwards Hebral Effect of changing 1% of the empty cell

68
A. C. Clark and M. H. W. Chan, J. Low Temp. Phys. 138, 853 (2005). Clark and Chan, 2005 Aluminum cell
. Clark and Chan, 2005 Aluminum cell.")
69
Our experiment The Silicon cell Si Al Glass Capillary Stycast 2850 Heater Thermometer Reasons for Si: Low heat capacity: High thermal conductivity: Helium Volume= 0.926cc At 0.1KSiCuHe Specific Heat [J mol -1 K -1 ]4x10 -9 7x10 -5 Thermal conductivity [W cm -1 K -1 ]10 -4* 4x10 -2 4x10 -3 * Using the value of quartz 0.6” 4 mil ID
![Our experiment The Silicon cell Si Al Glass Capillary Stycast 2850 Heater Thermometer Reasons for Si: Low heat capacity: High thermal conductivity: Helium Volume= 0.926cc At 0.1KSiCuHe Specific Heat [J mol -1 K -1 ]4x x10 -5 Thermal conductivity [W cm -1 K -1 ]10 -4* 4x x10 -3 * Using the value of quartz mil ID](http://images.slideplayer.com/17/5364964/slides/slide_69.jpg "Our experiment The Silicon cell Si Al Glass Capillary Stycast 2850 Heater Thermometer Reasons for Si: Low heat capacity: High thermal conductivity: Helium Volume= 0.926cc At 0.1KSiCuHe Specific Heat [J mol -1 K -1 ]4x x10 -5 Thermal conductivity [W cm -1 K -1 ]10 -4* 4x x10 -3 * Using the value of quartz mil ID")
70
AC Calorimetry 1,2 1.Paul F. Sullivan, G. Seidel, Phys Rev. 173, 679 (1968). 2.Yaakov Kraftmakher, Physics Reports, 356 (2002) 1-117. Internal time constant << 1/ω External time constant >> 1/ω KbKb Sample Thermal Bath Thermometer KΘKΘ Heater KhKh
. 2.Yaakov Kraftmakher, Physics Reports, 356 (2002) Internal time constant << 1/ω External time constant >> 1/ω KbKb Sample Thermal Bath Thermometer KΘKΘ Heater KhKh.")
71
Results: pure 4 He (0.3ppm) Temperature scale based on 3 He melting curve Minimum temperature 40mK
 Temperature scale based on 3 He melting curve Minimum temperature 40mK")
72
Results: 4 He at different 3 He concentrations in glass capillary cell No long time constant. No hysteresis No change due to annealing No thermal cycle effect Constant volume technique

73
Is there a linear T term? For 0.3ppm, T>0.14K T 3 relation only

74
Comparison with Castle & Adams Adams 19.43cc/mole

75
Pressure measurement Freshly grown sample Annealed sample (19.83cc/mole) — Grüneisen constant ρ — molar volume C V ~T n P~T n+1 V.N.Grigorev, V.A.Maidanov, V.Yu.Rubanskii, S.P.Rubets, E.Ya.Rudavskii, A.S.Rybalko, Ye.V.Syrnikov, V.A.Tikhii cond-mat/0702133
 — Grüneisen constant ρ — molar volume C V ~T n P~T n+1 V.N.Grigorev, V.A.Maidanov, V.Yu.Rubanskii, S.P.Rubets, E.Ya.Rudavskii, A.S.Rybalko, Ye.V.Syrnikov, V.A.Tikhii cond-mat/")
76
For 0.3ppm, T>0.14K T 3 relation only

77
C vs T 3 Constant contribution from 3 He impurity 10ppm sample 0.7+/-0.2 k B per 3 He 30ppm sample 1.7+/-0.3 k B per 3 He

78
NMR measurement of spin ( 3 He) diffusion: A. R. Allen, M. G. Richards & J. Schratter J. Low Temp. Phys. 47, 289 (1982). M. G. Richards, J. Pope & A. Widom, Phys. Rev. Lett. 29, 708 (1972).
. M. G. Richards, J. Pope & A. Widom, Phys. Rev. Lett. 29, 708 (1972)..")
79
NMR measurement of spin diffusion V. N. Grigor'ev, B. N. Esel'son, V. A. Mikheev, V. A. Slusarev, M. A. Strzhemechny, Yu. E. Shulman JLTP 13 65 (1973). The constant specific heat of ~1 k B per 3 He atom is most likely related to the 3 He impuriton wave. Note however 3 He concentrations and temperature range in heat capacity measurement are lower than NMR measurements..
. The constant specific heat of ~1 k B per 3 He atom is most likely related to the 3 He impuriton wave. Note however 3 He concentrations and temperature range in heat capacity measurement are lower than NMR measurements...")
80
Specific heat with the temperature independent constant term subtracted

81
Specific heat peak is found when T 3 term subtracted The peak is independent of 3 He concentration Peak height: 20 μJ mol -1 K -1 (2.5 x 10 -6 k B per 4 He atom) Excess entropy: 28 μ J mol -1 K -1 (3.5 x 10 -6 k B per 4 He atom)
 Excess entropy: 28 μ J mol -1 K -1 (3.5 x k B per 4 He atom)")
82
Is the peak related to phase separation? Hysteresis seen in phase separation in 1000ppm and 760ppm samples. We do not observe hysteresis in the present experiment. Hebral at al. PRL 46, 42 (1981). A. C. Clark and M. H. W. Chan, J. Low Temp. Phys. 138, 853 (2005).
. A. C. Clark and M. H. W. Chan, J. Low Temp. Phys. 138, 853 (2005)..")
83
Latent heat due to phase separation 3 He (ppm)Measured Latent heat (uJ/cc) Calculated Latent heat due to phase separation (uJ/cc) Pobell900033004000 Pobell450014001800 Hebral10005450 Clark7605350 PSU100.065 PSU0.30.060.2 PSU1E -3 0.060.0009 R.Schrenk,O.Friz,Y.Fujii,E.Syskakis, F. Pobell, JLTP 84, 133 (1991). Hebral at al. PRL 46, 42 (1981). A. C. Clark and M. H. W. Chan, J. Low Temp. Phys. 138, 853 (2005).
. Hebral at al. PRL 46, 42 (1981). A. C. Clark and M. H. W. Chan, J. Low Temp. Phys. 138, 853 (2005)..")
84
Melting curve measurements from Helsinki I. A. Todoshchenko,H. Alles, J. Bueno,H.J. Junes, A.Ya. Parshin & V.Tsepelin, Phys. Rev. Lett., 97, 165302 (2006). I. A. Todoshchenko, H. Alles, H. J. Junes, A. Ya. Parshin, & V. Tsepelin JETP 85, 555(2007) Apparent anomaly has the origin of Be-Cu diaphragm. PRL JETP
. I. A. Todoshchenko, H. Alles, H. J. Junes, A. Ya. Parshin, & V. Tsepelin JETP 85, 555(2007) Apparent anomaly has the origin of Be-Cu diaphragm. PRL JETP.")
85
Compare with torsional oscillator

86
Xi, Tony, Eunseong, Josh

88
Thermal history of 1ppb samples Velocity changes at low temperature lead to interesting behavior… Protocol followed below: (1) cooling, (2) velocity increase, (3) warming, (4) cooling 1 3 4 2
 cooling, (2) velocity increase, (3) warming, (4) cooling")
89
End

90
Specific heat with T 3 term subtracted Peak height: 20 μJ mol -1 K -1 (2.5 x 10 -6 k B per 4 He atom) Excess entropy: 28 μ J mol -1 K -1 (3.5 x 10 -6 k B per 4 He atom) 1.Specific heat peak is independent of 3 He concentrations. 2.Assuming 3D-xy universality class (same as the lambda transition in liquid 4 He). 3.Use two-scale-factor universality hypothesis, ρ s ~0.06%. 1ppb study of TO found this number lays between 0.03% and 0.3%.
. 3.Use two-scale-factor universality hypothesis, ρ s ~0.06%. 1ppb study of TO found this number lays between 0.03% and 0.3%..")
91
Hysteresis in Pressure measurement of phase separation A.N.Gan'shin, V.N.Grigor'ev, V.A.Maidanov, N.F.Omelaenko, A.A.Penzev, É.Ya.Rudavskii, A.S.Rybalko., Low Temp. Phys. 26, 869 (2000).
..")
93
Two of the common types: edge & screw Dislocation density, = ~5 <10 10 cm -2 –3-d network, L N ~ 1 to 10 m ( ~10 5 to 10 7 ) [L N ~ 0.1 to 1 m ( ~10 9 )] Dislocations
![Two of the common types: edge & screw Dislocation density, = ~5 <10 10 cm -2 –3-d network, L N ~ 1 to 10 m ( ~10 5 to 10 7 ) [L N ~ 0.1 to 1 m ( ~10 9 )] Dislocations](http://images.slideplayer.com/17/5364964/slides/slide_93.jpg "Two of the common types: edge & screw Dislocation density, = ~5 <10 10 cm -2 –3-d network, L N ~ 1 to 10 m ( ~10 5 to 10 7 ) [L N ~ 0.1 to 1 m ( ~10 9 )] Dislocations")
94
Dislocations intersect on a characteristic length scale of L N ~ 1 5 m Dislocations can also be pinned by 3 He impurities –Distance between 3 He atoms (if uniformly distributed): –1ppb 1000a ~ 0.3 m –0.3ppm 150a ~ 45nm –1% 5a ~ 15nm Granato-Lucke applied to 4 He
: –1ppb 1000a ~ 0.3 m –0.3ppm 150a ~ 45nm –1% 5a ~ 15nm Granato-Lucke applied to 4 He")
95
3 He-dislocation interaction Actual 3 He concentration on dislocation line is thermally activated *Typical binding energy, W 0 is 0.3K to 0.7K

96
3 He-dislocations interaction Line considered as crossover from network pinning to 3 He impurity pinning of dislocations (L Network ~ L 3He spacing ) Average length L Network ~ 1 to 10 m For ~ 10 5 to 10 6 cm -2 Smaller lengths (< 1 m) are expected for larger dislocation densities
 Average length L Network ~ 1 to 10 m For ~ 10 5 to 10 6 cm -2 Smaller lengths (< 1 m) are expected for larger dislocation densities")
97
Solid helium in Vycor glass Weak pressure dependence… from 40 to 65bar Strong velocity dependence

98
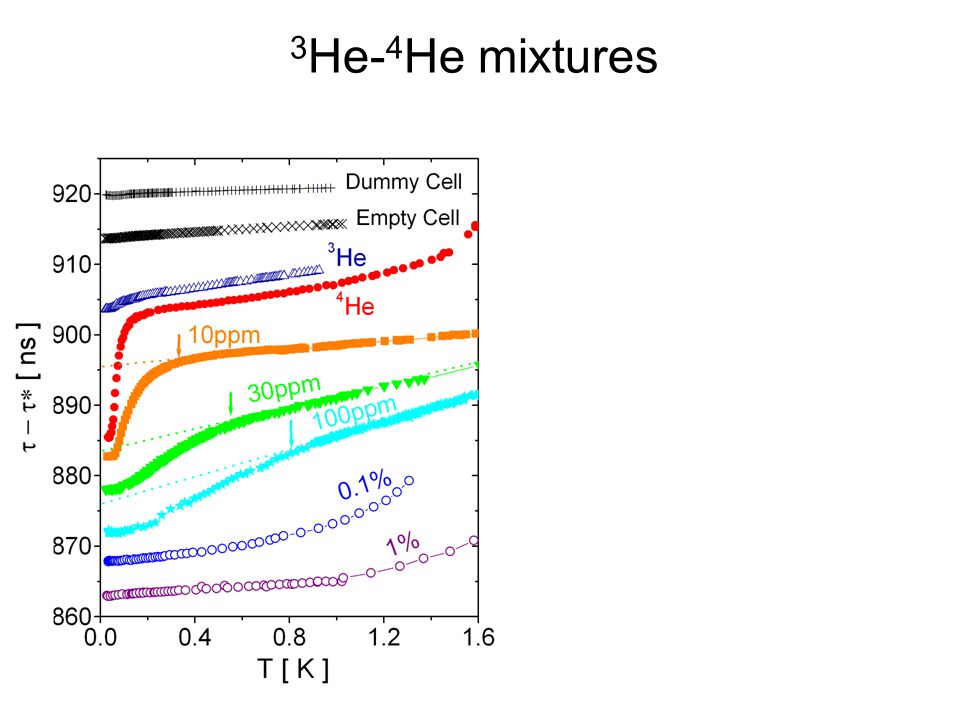
- *[ns] *=971,000ns Question: If there is a transition between the normal and supersolid phases, where is the transition temperature? 3 He- 4 He mixtures
![ - *[ns] *=971,000ns Question: If there is a transition between the normal and supersolid phases, where is the transition temperature.](http://images.slideplayer.com/17/5364964/slides/slide_98.jpg "3 He- 4 He mixtures.")
Similar presentations


 Harry Kojima Rutgers December 2012.>")
 Up to now we have dealt almost exclusively with systems consisting of a single phase. In this lecture, we.>")

 in a gold- plated copper plate (here 10 mm thick) 2 glass windows sealed with indium O-rings.>")

>")

 Harry Kojima Rutgers University.>")
 M. Graf, Z. Nussinov, S. Trugman, AVB (Los Alamos), 1.Thermodynamic considerations.>")

 Lode Pollet (ETH) Massimo Boninsegni (U of Alberta) Matthias Troyer (ETH) Anatoly Kuklov (CUNY) PITP-The Outing.>")


 L. Ladino, J.W. Brill, University of Kentucky.>")
