Download presentation
Presentation is loading. Please wait.

1
The Prospect of Zero GHG Emission Cars Prof. David R. Hodas Widener University School of Law Wilmington DE Journal of Environmental Law and Litigation Symposium: LIVING ON A FINITE EARTH: Energy Law and Policy for a New Era October 10, 2008 School of Law University of Oregon

4
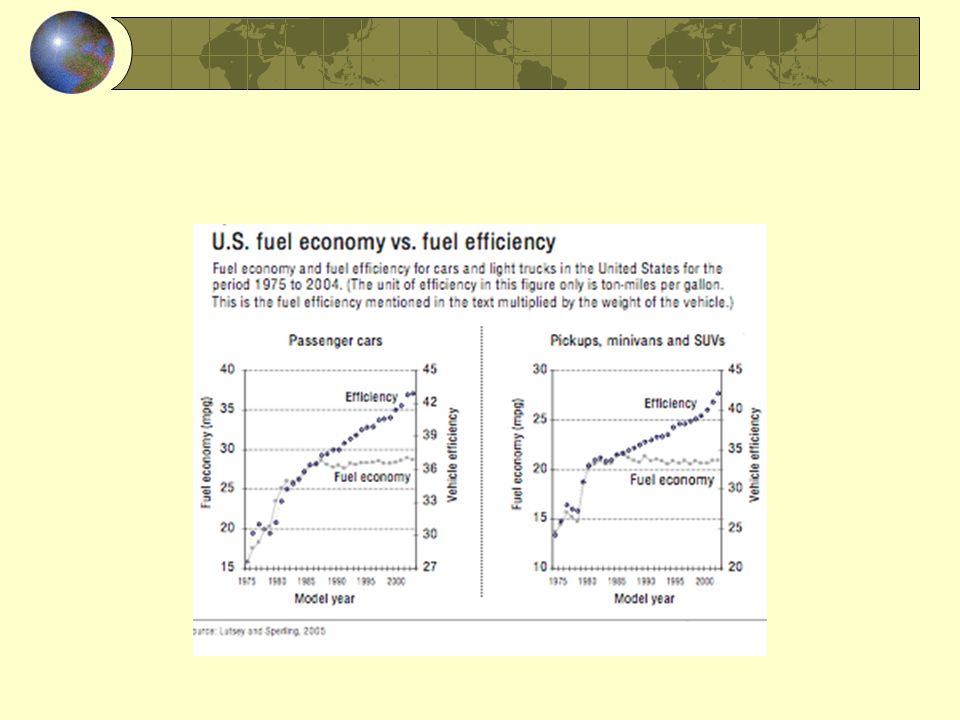
Vehicle weight vs.. acceleration As engines become more efficient they have been used to increase acceleration and weight not increase fuel efficiency

6
Transportation uses 70% of U.S. oil consumption Last week (Oct 3) the U.S. imported (net of exports)12.9 million barrels of petroleum per day (gross imports were14 million)(this translates into > 4.7 billion bbls per year) @$100/bll U.S the cost of these imports is about $1.29 billion per day or $470 billion per year. U.S. consumes about 43% of the world’s gasoline (2003 data)
12.9 million barrels of petroleum per day (gross imports were14 million)(this translates into > 4.7 billion bbls per U.S the cost of these imports is about $1.29 billion per day or $470 billion per year. U.S. consumes about 43% of the world’s gasoline (2003 data).")
7
In 2006 transportation in the U.S. cars account for 1.99 billion metric tons of CO 2 emissions Petroleum: 1.952 billion (gasoline’s share is 1.19 billion mt) Electricity for transportation: 5.2 Natural gas: 32.5 U.S. electricity production from fossil fuels accounts for 2.344 billion tons of CO 2 per year. Together (3.534 billion mt), U.S. gasoline use and electricity generation comprise about 60% of U.S. CO 2 emissions or just under 14% of global CO 2 emissions
 Electricity for transportation: 5.2 Natural gas: 32.5 U.S. electricity production from fossil fuels accounts for billion tons of CO 2 per year. Together (3.534 billion mt), U.S. gasoline use and electricity generation comprise about 60% of U.S. CO 2 emissions or just under 14% of global CO 2 emissions.")
8
Can we reduce CO2 from both electricity and transportation? Only if we can shift to renewable sources of electricity Renewable Electricity challenge: how to store it for use when needed? Can Vehicle-to-Grid (V2G) cars help meet the challenge?
 cars help meet the challenge .")
9
Plug-in Vehicles V2G Slides provided by Prof. Willett Kempton, University of Delaware

10
Vehicle to Grid Arrows indicate direction of power flow

11
V2G Basic Math Average car driven 1 hour/day, thus, time parked is 23 hours/day; Daily average travel: 32 miles, storage for 100 - 250 miles Practical power draw from car: 10 - 20 kW US power: generation=978 GW; load=436 GW avg (EIA) US 241 million cars (FHWA 2005) x 15 kW = 3,615 GW, thus... Power of fleet is >3x generation; >8x load !

12
Electric Markets Initial markets (high value, low impact on battery, no system changes): Regulation (“Frequency regulation”) Spinning reserves Intrahour adjustment Larger but more challenging markets Peak power UPS for the distribution system
: Regulation ( Frequency regulation ) Spinning reserves Intrahour adjustment Larger but more challenging markets Peak power UPS for the distribution system")
13
Time of Day MW ACE, Area Control Error, ~0.5% of control area load Grid operators send frequent signals to on-line generators (equipped with AGC) to either increase or decrease output. Aggregate Daily Load Curve from Letendre et al 2006 Daily Load versus Regulation (=correction of ACE)
.")
14
January 30, 2008 Average Annual Market Clearing Prices: Regulation

15
Average Annual Market Clearing Prices: Spinning Reserves

16
Basic per Vehicle Values 10 –Year Present Value V2G Revenue Potential Assumptions: 80% availability, Reg. $40/MW-h, Spin. $10/MW-h, 7% discount rate, example calculations

17
Vehicle Monitoring Automated data collection while grid-connected and while driving Power from grid to vehicle (-kW) and from vehicle to grid (+kW) AGC regulation signal from PJM (+- kW) State of charge (%) Wind backup: wind output vs. modelled vehicle fleet charge/discharge

18
EV/PHEV Design Tradeoffs Batteries expensive; motor expensive High line-current gives fast charge, roadside recharge; adds only moderate cost if done right Regulation income directly proportional to line power! Line power limits: Size of plug, circuit, service Energy/time = kWh/dispatch

19
Manufacturing Economics Very approximate sale price estimates: 10 cars/year ≈ $70,000 600 cars/year ≈ $50,000 10,000 cars/year ≈ $40,000 100,000 cars/year ≈ $30,000 Len Beck (Delmarva Power) estimates breakeven for $39,000 car providing 16 kW of up/down regulation
 estimates breakeven for $39,000 car providing 16 kW of up/down regulation")
20
How many cars for an A/S contract? PJM minimum A/S contract: 1 MW CalISO minimum A/S contract: 1 MW Assume 2/3 availability (1/3 unavailable because driving, battery at wrong SOC, etc Calculation: 2/3 availability means... ___ kW/car * ___ cars * 2/3 = ___ MW for 1 MW at 15 kW, need 100 cars for 1 MW at 1.5 kW, need 1000 cars

21
Vision One-half vehicle fleet is electric drive (BEV + PHEV). National security & environment benefits. Lots of storage on the electric system, near loads. Electric system storage is dispatchable by ISO/TSO and/or load serving entity. Electric grid is more stable and reliable, A/S is abundant and less expensive Intermittent renewables can be a much higher fraction of the generation mix.

22
Legal and Policy Questions How shift investment strategy in a deregulated electric system to renewable electricity linked to V2G Infrastructure: parking lots, transmission capacity, distribution networks Federal or state regulation? Link to climate change incentives, caps Smart meter laws, aggregation design Contract and business plan design, taxation, ownership, utility integration Other potential issues?

23
Mid-Atlantic Grid-Interactive Car Consortium Partners University of Delaware PHI: Delmarva Power, Atlantic Electric, PEPCO, etc ACUA PJM AC Propulsion Comverge Observers Tesla Motors Google.org State of Delaware (DEDO, PSC, Energy Office) anon http://www.magicconsortium.org
 anon")
Similar presentations


 Dr. Tony Whiteing (Leeds) Dr. Andrew Brint (Sheffield)>")


