Download presentation
Presentation is loading. Please wait.

1
Health Effects and Impact Assessment of Air Pollution Ferran Ballester AREHNA Workshop Kos Island, 3-5 May 2003

2
Hippocrates

3
Health Effects of Air Pollution Mortality Cardiopulmonary Hospitalizations Emergency department or outpatient visits Symptomatic exacerbations Changes in lung function Cardiopulmonary symptoms Upper respiratory illnesses Lower respiratory illnesses

4
Other Effects of Air Pollution Immune System; Allergies Allergic Asthma Allergic Rhinoconjunctivitis Extrinsic Allergic Alveolitis / Hypersensitivity Central Nervous System Toxic Damage of Nerve Cells Mental retardation Carcinogenic Effects Lung Cancer, Leukemia Reproductive effects Infant mortality Low weight birth

5
Health effect assessment Experimental studies Epidemiologic studies

6
Basic study designs in air pollution epidemiology Exposure Unit of observation AcuteChronic AggregatedTime Series (counts): Mortality, Hospital Admissions Emergencies Episodes, interventions Ecological (rates): Mortality Morbidity Cross-sectional IndividualPanel studies: Symptoms/Diseases Lung Function Cohort studies Cohort studies: Mortality Symptoms/Disease Lung Function Cross-sectional
: Mortality, Hospital Admissions Emergencies Episodes, interventions Ecological (rates): Mortality Morbidity Cross-sectional IndividualPanel studies: Symptoms/Diseases Lung Function Cohort studies Cohort studies: Mortality Symptoms/Disease Lung Function Cross-sectional")
7
Results from some epidemiological studies Time series Cohort studies Cross sectional Intervention studies

8
Time series studies

9
APHEA1 cities Population > 25,000,000

10
APHEA1 FINDINGS (1) 1.All pollutants studied have small acute effects on the daily total, cardiovascular and respiratory mortality. 2.Particulate matter and ozone levels were consistently associated with respiratory and COPD admissions.

11
APHEA1 FINDINGS (2) 3.Nitrogen dioxide levels were associated with asthma admissions. 4.The effects were observed in locations where, in the majority of days, air pollutant levels are well below the set (W.H.O., E.C., U.S.E.P.A.) standards.
 standards..")
12
APHEA2 EC Funded 30 cities 43 million inhabitants Period of study: 5 years (~ 1990-1996)
")
13
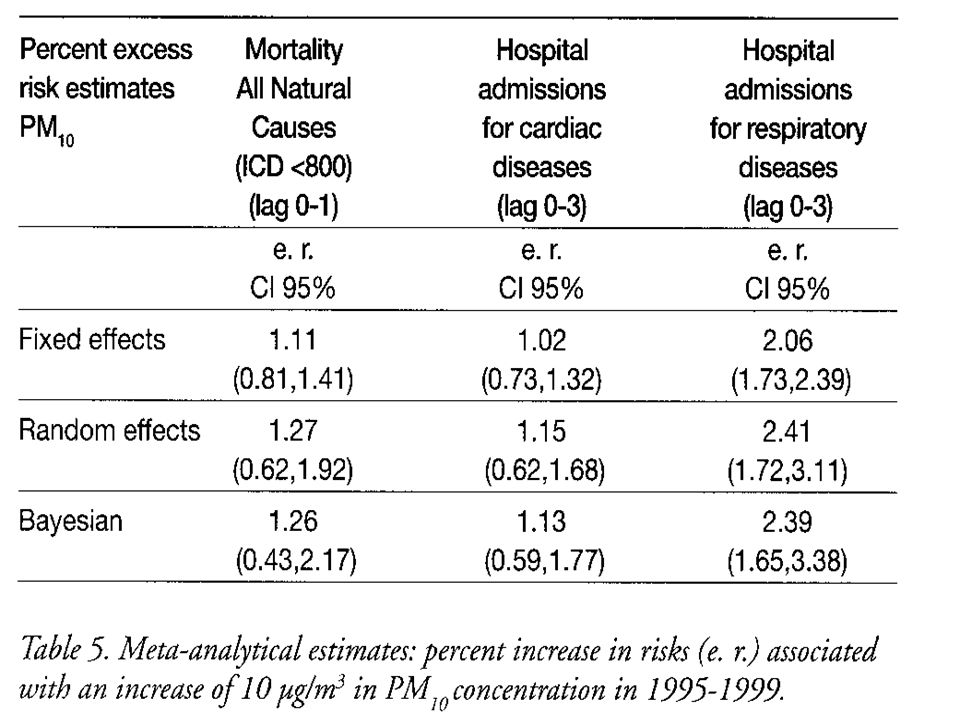
APHEA2 results Percent increase in the total daily number of deaths (95% C I) associated with an increase of 10μg/m3 in the levels of PM10 in each city. Katsouyanni et al Epidemiology 2001;12:521-531

14
APHEA2 results Percent increase in the total daily number of deaths (95% C I) associated with an increase of 10μg/m3 in the levels of Black Smoke in each city. Katsouyanni et al Epidemiology 2001;12:521-531

15
APHEA2 results Le Tertre et al 2002 % increase in cardiac admissions in each city associated with a 10-µg/m 3 increase in the average of PM 10 Barcelona London Milan NL Paris Rome Fixed Random Stockholm Birmingham combined Hospital cardiac admissions

16
PROGRAMME AIR ET SANTE-9 (PSAS-9)
")
17
Percent increase in the daily number of deaths (95% C I) associated with an increase of 10μg/m3 in the levels of air pollutant in each city. PSAS-9 FINDINGS

18
MISA Metanalisi italiana degli studi sugli effetti a breve termine dell’inquinamento atmosferico 8 cities 7 million inh.

20
The EMECAS Project

21
Combined estimates for mortality and air pollution -0,5 0,0 0,5 1,0 1,5 2,0 2,5 3,0 TSPPM10SO2_24h % change TOTAL CVS RES Results expressed as the estimated percentage changes in daily deaths (and the 95%CI) for an increase of 10 µg/m 3 in the concentration of the pollutant levels. Lag 01. Single pollutant models

22
Results expressed as the estimated percentage changes in daily deaths (and the 95%CI) for an increase of 10 µg/m 3 (1mg/m3 for CO) in the concentration of the pollutant levels. Lag 01. Single pollutant models NO2_24hCO_24h % change -2,0 -1,0 0,0 1,0 2,0 3,0 4,0 5,0 6,0 Combined estimates for mortality and air pollution TOTAL CVS RES

24
Particles RR lag 01 0.98 0.99 1.00 1.01 1.02 1.03 R F F F BS R F R F PM10 F F F F TSP EMECAS: COMBINED RESULTS FOR CARDIOVASCULAR ADMISSIONS RR for a 10 g/m 3 increase in air pollutant CVS HD IHD CBS 1.5 % Increase in cardiac admissions

25
RR lag 01 0.99 1.00 1.01 1.02 1.03 1.04 R R R F SO2 F F F F NO2 CVS HD IHD CBS RR for a 10 g/m 3 increase in air pollutant EMECAS: COMBINED RESULTS FOR CARDIOVASCULAR ADMISSIONS

26
RR CO -lag 01- / RR Ozone -lag 23- 0.98 1.00 1.02 1.04 1.06 R R R F CO F R R R Ozone EMECAS: COMBINED RESULTS FOR CARDIOVASCULAR ADMISSIONS RR for a 10 g/m 3 (1 mg/m 3 for CO) increase in air pollutant CVS HD IHD CBS
 increase in air pollutant CVS HD IHD CBS")
27
NMMAPS: The National (USA) Morbidity, Mortality, and Air Pollution Study Total mortality: 0.51 (0.07-0.93) Cardiorespiratory: 0.68 (0.20-1.16) % increase in mortality by 10 ug/m3 PM 10
 Morbidity, Mortality, and Air Pollution Study Total mortality: 0.51 ( ) Cardiorespiratory: 0.68 ( ) % increase in mortality by 10 ug/m3 PM 10")
28
Re-analysed national average estimates Previous published national average estimates Re-analysis in NMMAPS Dominicci et al 2002

29
Cohort studies

30
Relative risk of mortality (adjusted RR and long-term exposure to PM2.5) Harvard Six-City Cohort Study, Dockery et al, NEJM 1993; 329:1753-9 RRs Annual mean PM2.5 ( g /m 3 ) Courtesy of N Künzli
 Harvard Six-City Cohort Study, Dockery et al, NEJM 1993; 329: RRs Annual mean PM2.5 ( g /m 3 ) Courtesy of N Künzli")
31
1.01 (0.95-1.06) Other causes 1.14 (1.04-1.23) Lung cancer 1.09 (1.03-1.16) Cardiopulmonary 1.06 (1.02-1.11) Total mortality RR ( 10µg/m 3 ) Cause of death C.A. Pope et al. Lung cancer, cardiopulmonary mortality and long-term exposure to fine particulate air pollution. JAMA 2002;287(9)1132-41 Long-term exposure to fine particulates and mortality in the ACS cohort (n:500 000)
 Long-term exposure to fine particulates and mortality in the ACS cohort (n: ).")
32
Cross-sectional studies

33
Pulmonary capacity(FVC) in adults and annual mean value of PM10 in 8 regions SAPALDIA in Switzerland Ackermann-Liebrich et al, AJRCCM 1997; 155 (1):122-129 Annual mean of PM10 ( g / m 3 ) FVC % deviation from predicted Courtesy of N Künzli
 in adults and annual mean value of PM10 in 8 regions SAPALDIA in Switzerland Ackermann-Liebrich et al, AJRCCM 1997; 155 (1): Annual mean of PM10 ( g / m 3 ) FVC % deviation from predicted Courtesy of N Künzli")
34
5101520253035 5 7 9 11 13 15 17 19 21 23 25 Montana Payerne Langnau Rheintal Biel Lugano Geneva Zürich Bern Asnières Annual mean PM10 g/m 3 Acute bronchitis in children and annual mean PM10 Swiss Study SCARPOL C. Braun-Fahrländer; AJRCCM 1997

35
Intervention studies

36
Close of a steel mill in the Utah Valley (Pope et al. 1996, Dye 2001): particle levels, morbidity, inflammatory process Reduction of particle levels and consequent reduction of incidence of acute bronchitis in East Germany (Heinrich et al, 2000) Ban on marketing and sale of smoky coal in Dublin (Clancy et al, 2002) black smoke levels and mortality Introduction of gas with low sulphur in Hong Kong (Peters et al, 1996; Hedley et al, 2002): levels of SO2 and SO4, mortality and respiratory symptoms in children
: particle levels, morbidity, inflammatory process Reduction of particle levels and consequent reduction of incidence of acute bronchitis in East Germany (Heinrich et al, 2000) Ban on marketing and sale of smoky coal in Dublin (Clancy et al, 2002) black smoke levels and mortality Introduction of gas with low sulphur in Hong Kong (Peters et al, 1996; Hedley et al, 2002): levels of SO2 and SO4, mortality and respiratory symptoms in children.")
37
Health effects of traffic-related air pollution

38
Traffic-related air pollution: major vs quiet streets in Amsterdam Fischer, At Environ 2000; 34:3713 Figure from B Brunekreef – AIRNET London 2002

39
Air pollution from traffic and Lung Function in children Brunekreef et al, Epidemiology 1997 Figure from B Brunekreef – AIRNET London 2002

40
Road traffic and adverse respiratory effects in children Ciccone et al, OEM 1999

41
Long term effects Mortality and indicators of traffic- related air pollution in the Netherlands Cardio pulmonaryNon-Cardio pulmonary Non-lung cancer Black smoke1.34 (0.68-2.64)1.15 (0.63-2.10) Major road1.95 (1.09-3.51)1.03 (0.54-1.96) Hoek et al, Lancet 2002
1.15 ( ) Major road1.95 ( )1.03 ( ) Hoek et al, Lancet 2002")
42
Health Impact Assessment

43
Health Impact Assesment of Air Pollution Quantify the expected number of people with a health effect that could be attributed to a specific exposure situation Planning and evaluation tool for public policies Integrate public health criteria in environmental decision-making

44
Exposure-response function Hazard Attributable events Target population HIA process Exposure

45
APHEIS Air Pollution and Health: A European Information System A Health Impact Assessment of Air Pollution In 26 European Cities On behalf of the APHEIS network I NSTITUT DE V EILLE S ANITAIRE

46
1. Specify exposure * PM10, BS * Urban background stations Five main steps in HIA

47
2. Define the appropriate health outcomes * Acute effects - Premature mortality excluding accidents and violent deaths - Hospital admissions for respiratory diseases 65+ age group - Hospital admissions for cardiac diseases all ages * Chronic effects - Premature mortality Five main steps in HIA

48
3. Specify the exposure-response functions * Short-term exposure: APHEA2 Five main steps in HIA

49
3. Specify the exposure-response functions * Long-term exposure to PM10: HIA in Austria, France and Switzerland based on two American cohort studies (Künzli et al, 2000). Five main steps in HIA Health indicator RR for 10 µg/m 3 95%CI Total mortality ICD9 <800 1.043 1.026 -1.061
. Five main steps in HIA Health indicator RR for 10 µg/m 3 95%CI Total mortality ICD9 <")
50
4. Derive population baseline frequency measures for health outcomes 5. Calculate number of attributable cases in target population Five main steps in HIA

51
HIA model Künzli, Kaiser, Medina et al, Lancet 2000; 356: 795 - 801 PM10 Incidence/ prevalence Attributable cases Reference level PM10 20 g/m 3 E-R function Observed level: annual mean Courtesy of N Künzli

52
Demographic characteristics * Nearly 39 million inhabitants in Western and Eastern Europe * Proportion of people over 65 years: 15%, with highest proportion in Barcelona and lowest in London Descriptive findings

53
Annual mean levels and 10th and 90th percentiles of the distribution of PM10 Descriptive findings

54
Annual mean levels and 10th and 90th percentiles of the distribution of black smoke Descriptive findings

55
Health indicators Standardised mortality rates for all causes of deaths in the 26 cities Descriptive findings

56
Acute effects scenarios * Reduction of PM10/BS levels to a 24-hour value of 50 µg/m 3 (2005 and 2010 limit values for PM10) on all days exceeding this value * Reduction of PM10/BS levels to a 24-hour value of 20 µg/m 3 (to allow for cities with low levels of PM10/BS) on all days exceeding this value * Reduction by 5 µg/m 3 of all the 24-hour daily values of PM10/BS Health impact assessment findings
 on all days exceeding this value * Reduction of PM10/BS levels to a 24-hour value of 20 µg/m 3 (to allow for cities with low levels of PM10/BS) on all days exceeding this value * Reduction by 5 µg/m 3 of all the 24-hour daily values of PM10/BS Health impact assessment findings")
57
0 500 1000 1500 2000 2500 3000 12 Number of deaths attributable to daily mean value of black smoke (1) and short-term benefits of reducing 5 µg/m 3 (2) - 577 2687 2110
 and short-term benefits of reducing 5 µg/m 3 (2)")
58
Chronic effects scenarios * Reduction of the annual mean value of PM10 to a level of 40 µg/m 3 (2005 limit values for PM10) * Reduction of the annual mean value of PM10 to a level of 20 µg/m 3 (2010 limit values for PM10) * Reduction by 5 µg/m 3 of the annual mean value of PM10 Health impact assessment findings
 * Reduction of the annual mean value of PM10 to a level of 20 µg/m 3 (2010 limit values for PM10) * Reduction by 5 µg/m 3 of the annual mean value of PM10 Health impact assessment findings")
59
Number of deaths attributable to annual mean value of PM10 (1) and long-term benefits of reducing 5 µg/m 3 (2) 0 5000 10000 15000 20000 25000 30000 35000 12 # deaths - 5 547 32 075 26 528
 and long-term benefits of reducing 5 µg/m 3 (2) # deaths")
60
Standardised protocol for data collection and analysis Conservative approach * Did not consider newborn or infant mortality separately * Did not consider many other health outcomes listed by WHO * Did not consider independent effect of ozone * Used range of reference levels in different scenarios Interpretation of findings

61
Transferability of ER functions * Short-term exposure: Question avoided by using ER functions developed by APHEA 2 * Long-term exposure: Open question - used U.S. ER functions Interpretation of findings

62
Conclusions * Our HIA provides a conservative but accurate and detailed picture of the impact of air pollution on health in 26 European cities, and shows that air pollution continues to threaten public health in Europe. * Even very small and achievable reductions in air pollution levels have an impact on public health * This impact justifies taking preventive measures even in cities with low levels of air pollution Interpretation of findings

63
FINIS Thank you very much e-mail: ballester_fer@gva.es

64
Global causes of death Percentage of AP - related mortality: 4-8% (56. 10 6 1999 ) WHO, world health report 2000
 WHO, world health report")
65
WHO World health report 2002 Global Burden of Disease 0.8 million deaths attributed to urban air pollution 6.4 million years of healthy life are lost due to long-term exposure to ambient particulate matter

67
What could be done?

69
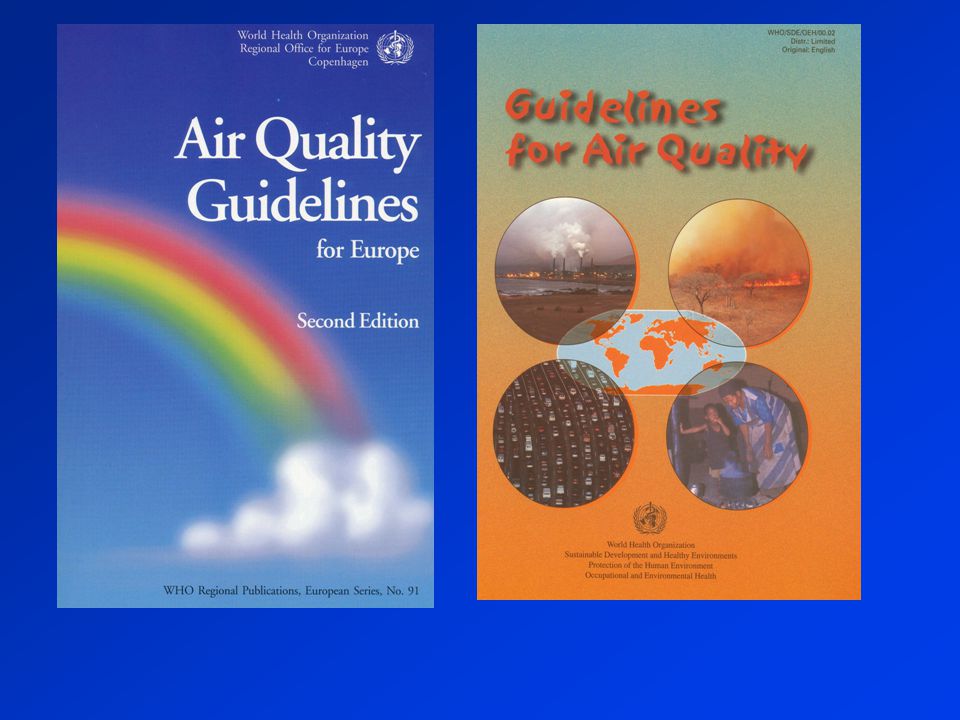
Pollutant (in g/m3) Time SO 2 3501 h 350 ‘Black smoke’ PM 10 24 h 5024 h NO 2 15024 h401year WHO Europe Guidelines (1987) Limit values EU 1999 1 h 120
 Time SO h 350 ‘Black smoke’ PM h 5024 h NO h401year WHO Europe Guidelines (1987) Limit values EU h 120")
70
Smog in Paris in October 1997

71
Actions for improving air quality in cities. Some examples –Restrictions to the private use of vehicles –Inprovement of public transports –Urban design and planification –Development of new technologies –Changes in the individual uses of energy –…

72
Air pollution Noise Accidents Climate change Physical and Social interferences

73
Comprehensive strategies

74
From this perspective the decision makers, professionals and the public need to be informed, in a understable and useful way, of the public health implications and consequences of policies and decisions related with transport, energy use, urban planification, etc Health professionals have a key role in providing this information and assessing the health impacts of public policies. Comprehensive strategies

75
FINIS Moltes gràcies [Thank you very much] e-mail: ballester_fer@gva.es
![FINIS Moltes gràcies [Thank you very much]](http://images.slideplayer.com/17/5349411/slides/slide_75.jpg "FINIS Moltes gràcies [Thank you very much]")
Similar presentations


 Pascal Lammar and Luc Hens Human.>")


