Download presentation
Presentation is loading. Please wait.

1
A Smart Tool for a Sustainable Future

2
Chicago skyline PM 2.5 < 10 μg/m 3

3
Chicago skyline PM 2.5 20 μg/m 3

4
Chicago skyline PM 2.5 35 μg/m 3 Canada Wide Standard: 35μg/m 3

5
Mortality An increase in fine particulate pollution (PM 2.5 ) of 10 μg/m 3 is associated with an increase of: 1.8% in total mortality (death) 1.4% in cardiovascular (CV) mortality After 1990 a ban on coal for residential heating in the UK resulted in a reduction of 35.6 μg/m 3 in black smoke (fine PM). The result was a 10.3% decrease in annual CV mortality In Hong Kong, a 50% reduction in SO 2 was followed by a 2.4% reduction in CV death. Each increase of 10 μg/m 3 was associated with a 6% increase in risk of cardiopulmonary mortality in the ACS study (U.S.) Living near a major road (PM and NO 2 ) was associated with a relative risk for cardiopulmonary mortality of 1.95 (Hamilton and Amsterdam)
 Living near a major road (PM and NO 2 ) was associated with a relative risk for cardiopulmonary mortality of 1.95 (Hamilton and Amsterdam).")
6
Morbidity A transient increase in the concentration of PM 2.5 of 25 μg/m 3 has been associated with an increased risk for myocardial infarction within 1-2 hours of exposure. High concentrations of PM 2.5 over 24 hours increases cardiovascular risk. Living near a busy road increases the likelihood of several respiratory health effects.

7
Growth Issues Population to grow by four million people by 2031 (11 million total). Golden Horseshoe to be third-largest urban land area in North America. Commute times to increase by 45%. Automobile emissions to increase by 42%.

8
Complex Planning Issues Lack of coordinated approach to urban planning. Are health and local environmental impacts measured properly? How are sustainability objectives measured? Lack of full-cost accounting of different approaches. The regions’ current analytical tools have not integrated transportation, environment, health, economic, and social relationships in a comprehensive manner.

9
SO 2 Emissions Over Southern Ontario Using SMOKE (July 13 - 16, 1999)
")
10
NO X Emissions Over Southern Ontario Using SMOKE (July 13 - 16, 1999)
")
11
PM 2.5 Concentrations Over Southern Ontario Using Models-3 / CMAQ (July 11 - 19, 1999)
")
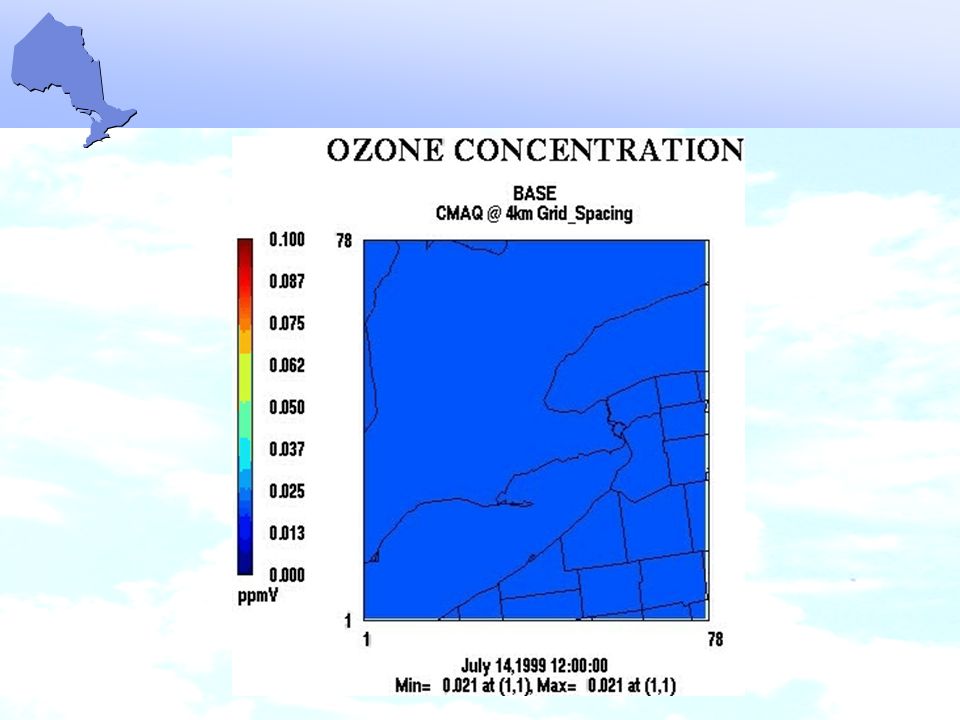
12
O 3 Concentrations Over Southern Ontario Using Models-3 / CMAQ (July 11 - 19, 1999)
")
14
Inter-Relationships Public Policy is Linked to Each Component Economic & Regional Development Infrastructure Municipal Works Transportation Road Congestion Air Quality & GHG Impacts Social Impacts Impact on Health & Environment Socio-Economic and Environmental Costs Industrial Institutional Residential Cost of Decisions Infrastructure costs Balance?

15
A Simplified Source-Receptor Model for Estimating Air Quality Impacts of Policy Measures ReFSoRT Emission Inventories Prepared by: Mike Lepage & Bob Caton, RWDI November 18 & 21, 2003

16
Estimating Clean Air Benefits Changes in Fuel/Energy Use by Sector, Region Changes in Ambient Air Quality (PM 2.5, ozone) Health Impacts (mortality, morbidity) Changes in Individual Welfare (WTP) Aggregation of Damages Across Effects, Individuals, Time AQVM Changes in CAC Emissions (SO X, NO X, etc.) Energy2020 ReFSoRT
 Health Impacts (mortality, morbidity) Changes in Individual Welfare (WTP) Aggregation of Damages Across Effects, Individuals, Time AQVM Changes in CAC Emissions (SO X, NO X, etc.) Energy2020 ReFSoRT")
17
Non-Linear Rollback Sulphate Example PM = f r x SO 4 /(SO 4 -SO 4b ) SO 4 /(SO 4 -SO 4b ) = k/k E s /E s + k/k + E s /E s k is dependent on changes in NO X, SO X and VOC
 SO 4 /(SO 4 -SO 4b ) = k/k E s /E s + k/k + E s /E s k is dependent on changes in NO X, SO X and VOC")
18
NAPS and Census Division Coverage in ReFSoRT

19
Model Domains (MM5 and CMAQ) and ReFSoRT Subregions
 and ReFSoRT Subregions")
20
Comparison between SRT and CMAQ modelling for Ozone

21
Inter-Relationships Public Policy is Linked to Each Component Economic & Regional Development Infrastructure Municipal Works Transportation Road Congestion Air Quality & GHG Impacts Social Impacts Impact on Health & Environment Socio-Economic and Environmental Costs Industrial Institutional Residential Cost of Decisions Infrastructure costs Balance?

22
CMAQ Model Domain, ReFSoRT Subregions and Micro-subregions

23
Key Components for a Risk Assessment for PM Concentration-response (C-R) functions: C-R functions describe the relationship between the health endpoint of interest and concentration of PM 2.5 –cardiovascular disease –non-fatal heart attack –asthma/allergy –pulmonary/respiratory infection –lung cancer C-R functions are available for long- and short-term exposures to PM 2.5. Additional C-R functions are available for SO 2, nitrogen oxides, and volatile organic compounds.

24
Economics Component Infrastructure PerspectiveSocial Perspective Capital Operating Financing Replacement How much does it cost? How to pay for it? Health Productivity Quality of Life What are we willing to pay to enhance these values? Economics is about clarifying choice from a financial and social perspective:

25
Thank you

Similar presentations