Download presentation
Presentation is loading. Please wait.

1
9/20091 EPI 5240: Introduction to Epidemiology Descriptive Epidemiology September 28, 2009 Dr. N. Birkett, Department of Epidemiology & Community Medicine, University of Ottawa

2
9/20092 Scenario (1) A 34 year old domestic worker who had recently emigrated from South-East Asia to Ottawa presents at the ED with a 6-week history of cough, fever, night sweats, weakness, fatigue & shortness of breath. She was previously in good health and has had 2 uncomplicated pregnancies (parity=2). Chest x-ray shows cavitary lesions & a sputum smear shows acid-fast bacilli. TB was diagnosed. Treatment included 8 weeks of directly observed four drug therapy. Then, 10 weeks of two drugs taken three times per week.
. Chest x-ray shows cavitary lesions & a sputum smear shows acid-fast bacilli. TB was diagnosed. Treatment included 8 weeks of directly observed four drug therapy. Then, 10 weeks of two drugs taken three times per week..")
3
9/20093 Scenario (2) Patient lived in an apartment with husband and two children. TB skin tests were positive for husband and 3 year old daughter. Preventive treatment was given to all immediate family members. There was one positive skin test in 54 other apartment residents. No work contacts were positive.

4
9/20094 Session Overview Role of descriptive epidemiology Main features –Person –Place –Time

5
9/20095 Assessing the Health Status of a Population Generating Hypotheses about causal factors Planning and Evaluating Public Health Programmes Evaluating clinical outcomes and treatments Uses (1)
")
6
9/20096 Person (age, sex, race, religion, SES) Place (country, state/province, city) Time (year, season, month, week, day, hour) Identification of disease clusters in time & space (epidemics/outbreaks) Key Elements
 Place (country, state/province, city) Time (year, season, month, week, day, hour) Identification of disease clusters in time & space (epidemics/outbreaks) Key Elements")
8
9/20098 Age –Disease incidence generally increases with age –Aging process vs. accumulation of 'experience‘ Sex –Breast cancer: 1 : 99 (Male:female) –Esophageal cancer:10 : 1 (Male:female) Hormones Habits Sexual practices Occupational exposures Societal roles/attitudes Person factors (1)
 –Esophageal cancer:10 : 1 (Male:female) Hormones Habits Sexual practices Occupational exposures Societal roles/attitudes Person factors (1).")
9
9/20099 Race/ethnicity –Controversial. How to define 'race'? Biological vs. social construct –Minority groups have more disease and worse outcomes. SES Health practices Access to Health Care Discrimination Stress Environmental/occupational exposures Person factors (2)
.")
10
9/200910 SES (socio-economic status) –Lower worse health Life expectancy 6.6 years lower in the poorest group. The Titanic –Complex causal pathway Nutrition Race Habits Environmental/occupational Access to/use of health/preventive services Political isolation Others Person factors (3)
.")
11
9/200911 Religion –Genetic (in-breeding) Tay-Sachs disease largely restricted to Jews of European descent. –Behavioral Mormons have 24% lower cancer rate Nuns, cervical cancer and breast cancer Occupation –Percival Pott and scrotal cancer in chimney sweeps Person factors (4)
.")
12
9/200912 Marital status –Married people have better health in general (e.g. lower suicide rates) Does marital support better health Are people who are predisposed to better health more likely to marry or be more attractive? –Stress of failed marriage Person factors (5)
 Does marital support better health Are people who are predisposed to better health more likely to marry or be more attractive. –Stress of failed marriage Person factors (5).")
13
9/200913 # reported TB cases (USA, 2002) 10 yrs 20 yrs
 10 yrs 20 yrs")
14
9/200914 Incidence rates for TB (USA, 2002)
")
15
9/200915 Incidence rates for TB By Race/ethnicity (USA, 2002)
")
16
9/200916 Incidence rates for TB By Sex (USA, 2002)
")
17
9/200917 Strong overlap with many aspects of geography. Small area estimation GIS Basis Geopolitical units Natural features Place factors (1)
.")
18
9/200918 Aspects include: Physical Environment –Climate –Water –Soil –Air Biological environment –Flora/fauna Social environment –Cultural traditions Place factors (2)
")
19
Scale of Comparisons Global –Cancer rates Regional –CHD and birth defects are more common in Eastern Canada than Western Canada. Neighborhood –Childhood lead poisoning was higher in one specific 28 block area of Boston than in other parts of the city. Traced to use of lead paint in that area. Pica and soil contamination. Place factors (3)
.")
20
9/200920 Cancer rates by place

21
HIV rates by USA states

22
Cholera in London (John Snow)
")
23
TB incidence around the world

24
TB incidence in the USA by state

25
9/200925 Lung cancer mortality By county

26
9/200926 Breast cancer mortality By county

27
Lung cancer mortality By county

28
Breast cancer mortality By county

29
9/200929 Frequently called 'temporal' or 'secular' trends. Mainly relates to changes over calendar time. Years (most common), months, weeks, days, diurnal, hours. Seasonal effects Time factors (1)
, months, weeks, days, diurnal, hours. Seasonal effects Time factors (1).")
30
9/200930 Interpretation Can be tricky. Need external information, other clues. Changes in exposure levels or susceptibility Diagnostic abilities –Ultrasound and congenital heart defects Completeness of reporting –Child sexual abuse Denominator issues, changes in age distribution. Changes in treatment. Time factors (2)
.")
31
9/200931 Alcohol intake, France, 1860-1989

32
9/200932 Blood lead,1976/80 & 1988/91

33
9/200933 Suicide rates by month

34
9/200934 Suicide rates by day of week

35
9/200935 TB incidence over time, USA

36
9/200936 TB cases over time, USA with trend line

38
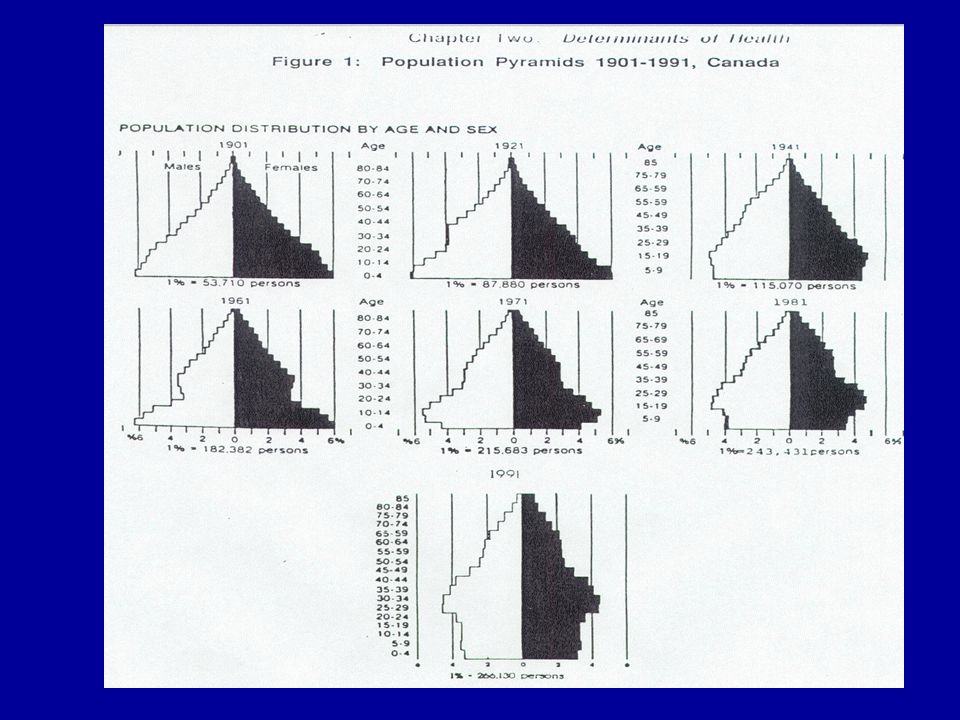
9/200938 Population pyramids can be animated to show population changes over time. Here are some examples from Statistics Canada. CANADA: 1901-2001 NFLD: 1949-2001 Yukon: 1901-2001 URL: http://www.statcan.ca/english/kits/animat/pyone.htm Time factors (3)
.")
39
9/200939 Birth cohort effects. Also called age-period-cohort modeling. –Difficult to cover in detail. Here, we explain basic concept. Consider people dying from TB at age 50. –In 2000, these people were born in 1950 –In 1950, these people were born in 1900. First group grew up in the post-WWII boom, with modern medicine, good nutrition/sanitation, good housing. Second group experienced WWI, WWII, the depression, crowded housing, poor medical care. These are BIRTH COHORT effects Time factors (4)
.")
40
9/200940 BUT: Year of death = year of birth + age at death Can not disentangle trends due to: –Age –Birth cohort –Period (year of death) Ignoring year of birth (commonly done) can lead to distorted information Time factors (5)
 Ignoring year of birth (commonly done) can lead to distorted information Time factors (5)")
41
9/200941 TB mortality, 1900-1960, age effect by year of death

42
9/200942 TB mortality, 1900-1960, age effect by year of BIRTH

43
9/200943 When people move, does the incidence of disease: –Change to reflect their new country Likely due to environmental causes –Stay the same as in the old country Likely due to genetic factors Perhaps due to early environmental exposures –Become somewhere in between. Japanese migrants to Hawaii/California Italian migrants to various countries –26,000,000 migrants between 1876 & 1985 'East block' Europeans migrating to the West Migrant studies (1)
.")
44
9/200944 TB incidence after migration

45
9/200945 Why does TB incidence persist at elevated level? –Latent infections prior to migration –Residence in migrant communities in new country; localized high transmission rates –Crowded housing –Inadequate access to preventive or therapeutic services –Noncompliance with therapy –Resistant organisms –Re-infection on return to country of origin Migrant studies (2)
.")
46
9/200946 Descriptive Epidemiology plays a major role in identifying outbreaks and unknown risks. Provides preliminary information about groups are particular risk. –Can provide hypotheses about potential risks or causes. HIV example Very common activity with governments and health units. Summary

Similar presentations


 Betty C. Jung, RN, MPH, CHES.>")


>")


Women generally need more health care than men because.>")

