Download presentation
Presentation is loading. Please wait.

1
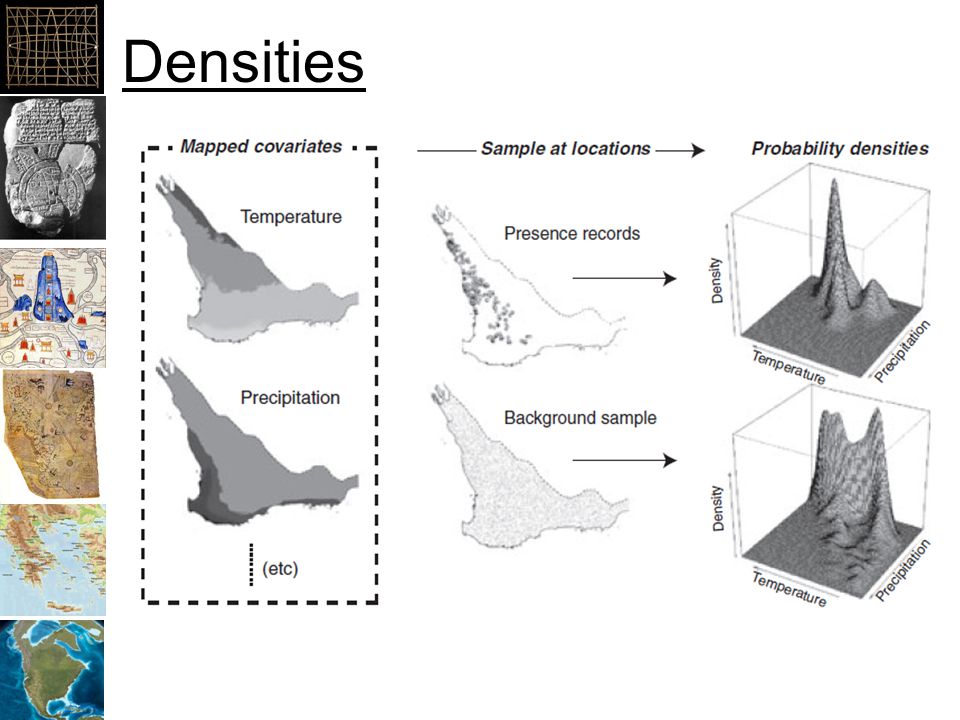
Maxent Implements “Maximum Entropy” modeling –Entropy = randomness –Maximizes randomness by removing patterns –The pattern is the response Website with papers: –http://www.cs.princeton.edu/~schapire/maxe nt/

2
Densities

4
Logit – Inverse of Logistic

5
MaxEnt’s “Model”

6
MaxEnt Optimizes “Gain” “Gain in MaxEnt is related to deviance” –See Phillips in the tutorial MaxEnt generates a probability distribution of pixels in the grid starting at uniform and improving the fit to the data “Gain indicates how closely the model is concentrated around presence samples” –Phillips

7
Gain

8
Regularization

9
Background Points 10,000 random points Uses all pixels if <10,000 samples

10
MaxEnt really… MaxEnt tries to create a probability surface in hyperspace where: –Values are near 1.0 where there are lots of points –Values are near 0.0 where there are few or no points

11
Synthetic Habitat & Species

12
MaxEnt Outputs

13
Threshold~0.5 Threshold~0.2Threshold~0.0

14
Cumulative Threshold Threshold of 0 = Entire area No omission for entire area All points omitted for no area Threshold of 100% = no area

15
Definitions Omission Rate: Proportion of points left out of the predicted area for a threshold Sensitivity: Proportion of points left in the predicted area –1 – Omission Rate Fractional Predicted Area: –Proportion of area within the thresholded area Specificity: Proportion of area outside the thresholded area –1 – Fractional Predicted Area:

16
Receiver-Operator Curve (ROC) Area Under The Curve (AUC)
 Area Under The Curve (AUC)")
17
What proportion of the sample points are within the thresholded area What proportion of the total area is within the thresholded area Goes up quickly if points are within a sub-set of the overall predictor values

18
AUC Area Under the Curve 0.5=Model is random, Closer to 1.0 the better

19
Best Explanation Ever! http://en.wikipedia.org/wiki/Receiver_operating_characteristic

20
Fitting Features Types of “Features” –Threshold: flat response to predictor –Hinge: linear response to predictor –Linear: linear response to predictor –Quadratic: square of the predictor –Product: two predictors multiplied together –Binary: Categorical levels The following slides are from the tutorial you’ll run in lab

21
Threshold Features

22
Linear

23
Quadratic

24
Hinge Features

25
Product Features

26
Getting the “Best” Model AUC does not account for the number of parameters –Use the regularization parameter to control over-fitting MaxEnt will let you know which predictors are explaining the most variance –Use this, and your judgment to reduce the predictors to the minimum number –Then, rerun MaxEnt for final outputs

27
Number of Parameters cld6190_ann, 0.0, 32.0, 84.0 dtr6190_ann, 0.0, 49.0, 178.0 ecoreg, 0.0, 1.0, 14.0 frs6190_ann, -1.1498818281061252, 0.0, 235.0 h_dem, 0.0, 0.0, 5610.0 pre6190_ann, 0.0, 0.0, 204.0 pre6190_l1, 0.0, 0.0, 185.0 pre6190_l10, 0.0, 0.0, 250.0 pre6190_l4, 0.0, 0.0, 188.0 pre6190_l7, 0.0, 0.0, 222.0 tmn6190_ann, 0.0, -110.0, 229.0 tmp6190_ann, 0.5804254993432195, 1.0, 282.0 tmx6190_ann, 0.0, 101.0, 362.0 vap6190_ann, 0.0, 1.0, 310.0 tmn6190_ann^2, 1.0673168197973097, 0.0, 52441.0 tmx6190_ann^2, -4.158022614271723, 10201.0, 131044.0 vap6190_ann^2, 0.8651171091826158, 1.0, 96100.0 cld6190_ann*dtr6190_ann, 1.2508669203612586, 2624.0, 12792.0 cld6190_ann*pre6190_l7, -1.174755465148628, 0.0, 16884.0 cld6190_ann*tmx6190_ann, -0.4321445358008761, 3888.0, 28126.0 cld6190_ann*vap6190_ann, -0.18405049411034943, 38.0, 25398.0 dtr6190_ann*pre6190_l1, 1.1453859981618322, 0.0, 19240.0 dtr6190_ann*pre6190_l4, 4.849148645354156, 0.0, 18590.0 dtr6190_ann*tmn6190_ann, 3.794041694656147, -16789.0, 23843.0 ecoreg*tmn6190_ann, 0.45809862608857377, -1320.0, 2290.0 ecoreg*tmx6190_ann, -1.6157434815320328, 154.0, 3828.0 ecoreg*vap6190_ann, 0.34457033151188204, 12.0, 3100.0 frs6190_ann*pre6190_l4, 2.032039282175344, 0.0, 6278.0 frs6190_ann*tmp6190_ann, -0.7801709867413774, 0.0, 15862.0 frs6190_ann*vap6190_ann, -3.5437330369989097, 0.0, 11286.0 h_dem*pre6190_l10, 0.6831004745857797, 0.0, 332920.0 h_dem*pre6190_l4, -7.446077252168424, 0.0, 318591.0 pre6190_ann*pre6190_l7, 1.5383313604986337, 0.0, 39780.0 pre6190_l1*vap6190_ann, -2.6305122968909807, 0.0, 47495.0 pre6190_l10*pre6190_l4, -2.5355630131828004, 0.0, 47000.0 pre6190_l10*pre6190_l7, 5.413839860312993, 0.0, 48750.0 pre6190_l10*tmn6190_ann, 1.2055688090972252, -1407.0, 54500.0 pre6190_l4*pre6190_l7, -3.172491547290633, 0.0, 36660.0 pre6190_l4*tmn6190_ann, -1.2333164353879962, -1463.0, 40984.0 pre6190_l4*vap6190_ann, -0.6865648521426311, 0.0, 55648.0 pre6190_l7*tmp6190_ann, -0.45424195658031474, 0.0, 55278.0 pre6190_l7*tmx6190_ann, -0.23195173539212843, 0.0, 68598.0 tmn6190_ann*tmp6190_ann, 0.733594398523686, -6300.0, 64014.0 tmn6190_ann*vap6190_ann, 1.414888294903485, -3675.0, 70074.0 (85.5<pre6190_l10), 0.7526049605127942, 0.0, 1.0 (22.5<pre6190_l7), 0.09143627960137418, 0.0, 1.0 (14.5<pre6190_l7), 0.3540139414522918, 0.0, 1.0 (101.5<tmn6190_ann), 0.5021949716276776, 0.0, 1.0 (195.5<h_dem), -0.4332023993069761, 0.0, 1.0 (340.5<tmx6190_ann), -1.4547597256316012, 0.0, 1.0 (48.5<h_dem), -0.1182394373335682, 0.0, 1.0 (14.5<pre6190_l10), 1.4894000152716946, 0.0, 1.0 (308.5<tmx6190_ann), -0.5743766711031515, 0.0, 1.0 (311.5<tmx6190_ann), -0.19418359220467488, 0.0, 1.0 (23.5<pre6190_l4), 0.6810910505907158, 0.0, 1.0 (9.5<ecoreg), 0.7192087537708799, 0.0, 1.0 (281.5<tmx6190_ann), -1.2177451449751997, 0.0, 1.0 (50.5<h_dem), -0.2041650979073212, 0.0, 1.0 'tmn6190_ann, 2.506694714713521, 228.5, 229.0 (36.5<h_dem), -0.04215558381842702, 0.0, 1.0 (191.5<tmp6190_ann), 0.8679225073207016, 0.0, 1.0 (101.5<dtr6190_ann), 0.0032675586724019226, 0.0, 1.0 'cld6190_ann, -0.009785185080653264, 82.5, 84.0 `h_dem, -1.0415514779720143, 0.0, 2.5 (1367.0<h_dem), -0.2128591450282928, 0.0, 1.0 (280.5<tmx6190_ann), -0.06975266984609022, 0.0, 1.0 (55.5<pre6190_ann), -0.3681568888568664, 0.0, 1.0 (211.5<h_dem), -0.09946657794871552, 0.0, 1.0 (82.5<pre6190_l10), 0.09831192008677023, 0.0, 1.0 (41.5<pre6190_l7), -0.07282871533190113, 0.0, 1.0 (86.5<pre6190_l1), -0.06404898712746389, 0.0, 1.0 (106.5<pre6190_l1), 0.9347973610811197, 0.0, 1.0 (97.5<pre6190_l4), 0.02588993095745272, 0.0, 1.0 `h_dem, 0.2975112175166992, 0.0, 57.5 `pre6190_l1, -1.4918629714740488, 0.0, 3.5 (87.5<pre6190_l1), -0.16210452683985327, 0.0, 1.0 `pre6190_l1, 0.6469706380585183, 0.0, 33.5 (199.5<vap6190_ann), 0.07974469741688692, 0.0, 1.0 `pre6190_l7, 0.6529517367541156, 0.0, 0.5 (985.0<h_dem), 0.5311126727361561, 0.0, 1.0 (12.5<pre6190_l7), 0.15147093558026073, 0.0, 1.0 'dtr6190_ann, 1.9102989446786593, 100.5, 178.0 (24.5<pre6190_l7), 0.22066203658397954, 0.0, 1.0 `h_dem, 0.19290062857835738, 0.0, 58.5 (95.5<pre6190_l4), 0.11847374533530691, 0.0, 1.0 (42.5<pre6190_l10), -0.22634502760604264, 0.0, 1.0 (59.5<cld6190_ann), -0.08833902526182105, 0.0, 1.0 (156.5<tmn6190_ann), -0.3949178282642713, 0.0, 1.0 'vap6190_ann, -0.09749601885757717, 284.5, 310.0 (195.5<pre6190_l10), -0.7064287716566797, 0.0, 1.0 'pre6190_ann, -0.13355287707153143, 198.5, 204.0 (85.5<pre6190_ann), -0.08639349917230135, 0.0, 1.0 `cld6190_ann, -0.8869579099922708, 32.0, 56.5 (127.5<pre6190_l7), 0.16433984792079512, 0.0, 1.0 (310.5<tmx6190_ann), -0.12187855649464616, 0.0, 1.0 (123.5<dtr6190_ann), -0.3879778631592106, 0.0, 1.0 (58.5<cld6190_ann), -0.045757294470318455, 0.0, 1.0 `h_dem, -0.03506780995851361, 0.0, 15.5 `dtr6190_ann, 0.8788733700181052, 49.0, 89.5 (34.5<pre6190_ann), -0.11675983810645604, 0.0, 1.0 `h_dem, -0.07042193156800028, 0.0, 16.5 (195.5<tmp6190_ann), -0.06201919461360444, 0.0, 1.0 linearPredictorNormalizer, 8.791343644655978 densityNormalizer, 129.41735442727088 numBackgroundPoints, 10112 entropy, 7.845994051976282
, , 0.0, 1.0 (22.5<pre6190_l7), , 0.0, 1.0 (14.5<pre6190_l7), , 0.0, 1.0 (101.5<tmn6190_ann), , 0.0, 1.0 (195.5<h_dem), , 0.0, 1.0 (340.5<tmx6190_ann), , 0.0, 1.0 (48.5<h_dem), , 0.0, 1.0 (14.5<pre6190_l10), , 0.0, 1.0 (308.5<tmx6190_ann), , 0.0, 1.0 (311.5<tmx6190_ann), , 0.0, 1.0 (23.5<pre6190_l4), , 0.0, 1.0 (9.5<ecoreg), , 0.0, 1.0 (281.5<tmx6190_ann), , 0.0, 1.0 (50.5<h_dem), , 0.0, 1.0 tmn6190_ann, , 228.5, (36.5<h_dem), , 0.0, 1.0 (191.5<tmp6190_ann), , 0.0, 1.0 (101.5<dtr6190_ann), , 0.0, 1.0 cld6190_ann, , 82.5, 84.0 `h_dem, , 0.0, 2.5 (1367.0<h_dem), , 0.0, 1.0 (280.5<tmx6190_ann), , 0.0, 1.0 (55.5<pre6190_ann), , 0.0, 1.0 (211.5<h_dem), , 0.0, 1.0 (82.5<pre6190_l10), , 0.0, 1.0 (41.5<pre6190_l7), , 0.0, 1.0 (86.5<pre6190_l1), , 0.0, 1.0 (106.5<pre6190_l1), , 0.0, 1.0 (97.5<pre6190_l4), , 0.0, 1.0 `h_dem, , 0.0, 57.5 `pre6190_l1, , 0.0, 3.5 (87.5<pre6190_l1), , 0.0, 1.0 `pre6190_l1, , 0.0, 33.5 (199.5<vap6190_ann), , 0.0, 1.0 `pre6190_l7, , 0.0, 0.5 (985.0<h_dem), , 0.0, 1.0 (12.5<pre6190_l7), , 0.0, 1.0 dtr6190_ann, , 100.5, (24.5<pre6190_l7), , 0.0, 1.0 `h_dem, , 0.0, 58.5 (95.5<pre6190_l4), , 0.0, 1.0 (42.5<pre6190_l10), , 0.0, 1.0 (59.5<cld6190_ann), , 0.0, 1.0 (156.5<tmn6190_ann), , 0.0, 1.0 vap6190_ann, , 284.5, (195.5<pre6190_l10), , 0.0, 1.0 pre6190_ann, , 198.5, (85.5<pre6190_ann), , 0.0, 1.0 `cld6190_ann, , 32.0, 56.5 (127.5<pre6190_l7), , 0.0, 1.0 (310.5<tmx6190_ann), , 0.0, 1.0 (123.5<dtr6190_ann), , 0.0, 1.0 (58.5<cld6190_ann), , 0.0, 1.0 `h_dem, , 0.0, 15.5 `dtr6190_ann, , 49.0, 89.5 (34.5<pre6190_ann), , 0.0, 1.0 `h_dem, , 0.0, 16.5 (195.5<tmp6190_ann), , 0.0, 1.0 linearPredictorNormalizer, densityNormalizer, numBackgroundPoints, entropy,")
28
Running Maxent Folder for layers: –Must be in ASCII Grid “.asc” format CSV file for samples: –Must be: Species, X, Y Folder for outputs: –Maxent will put a number of files here

29
Avoiding Problems Create a folder for each modeling exercise. –Add a sub-folder for “Layers” Layers must have the same extent & number of rows and columns of pixels –Save your samples to a CSV file: Species, X, Y as columns –Add a sub-folder for each “Output”. Number or rename for each run Some points may be missing environmental data

30
Running Maxent Batch file: –maxent.bat contents: java -mx512m -jar maxent.jar –The 512 sets the maximum RAM for Java to use Double-click on jar file –Works, with default memory

31
Maxent GUI

32
Douglas-Fir Points

33
AUC Curve

34
Response Curves Each response if all predictors are used Each response if only one predictor is used

35
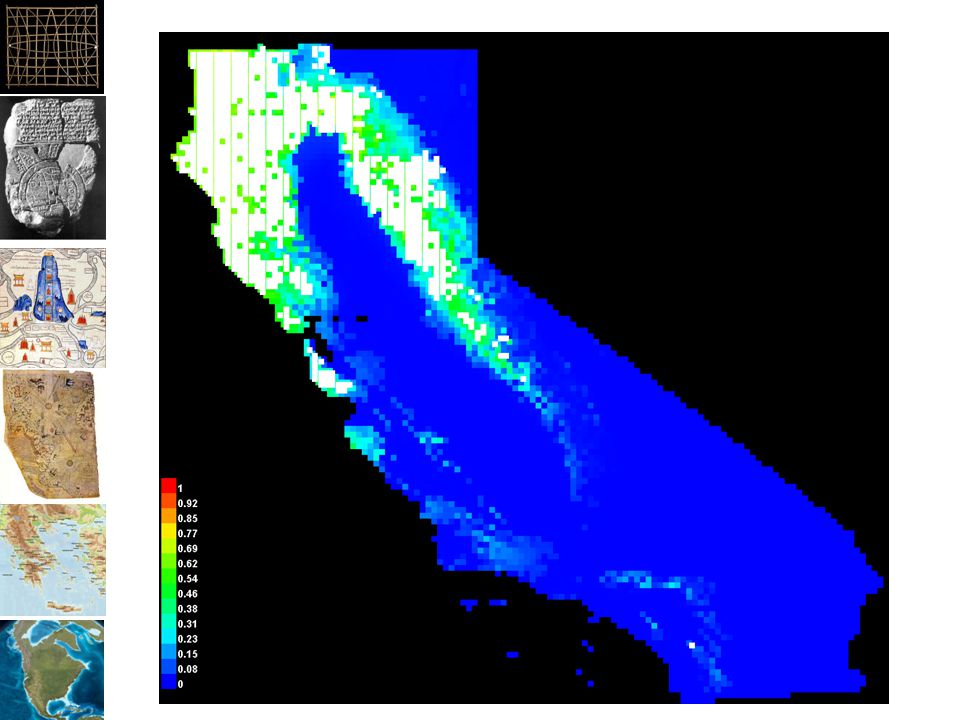
Surface Output Formats

37
Percent Contribution Precip. contributes the most

38
Settings

39
Regularization = 2 AUC = 0.9

40
Resampling Resampling: The model general term Cross-validation: typically with an independent data set Leave-one-out cross-validation (LOOCV) –Break up data set into N “chucks”, run model leaving out each chunk Replication: MaxEnt’s term for resampling
 –Break up data set into N chucks , run model leaving out each chunk Replication: MaxEnt’s term for resampling")
41
MaxEnt: Replication Cross-Validation: LOOCV –10 replicates -> each replicate will be trained using 90% of the data Repeated Subsampling: –Breaks data into “training” and “test” data sets “Bootstrapping”: sub-samples data using replacement. Training can have duplicate records (not recommended)
.")
42
Optimizing Your Model Select the “Sample Area” carefully Use “Percent Contribution”, Jackknife and correlation stats to determine the set of “best” predictors Try different regularization parameters to obtain response curves you are comfortable with and reduce the number of parameters (and/or remove features) Run “replication” to determine how robust the model is to your data
 Run replication to determine how robust the model is to your data")
43
Model Optimization & Selection Modeling approach Predictor Selection Coefficients estimation Validation: –Against sub-sample of data –Against new dataset Parameter sensitivity Uncertainty estimation

44
LinearGAMBRTMaxent Number of predictors NNNN “Base” equationLinear (or linearized) Link + splines (typical) TreesLinear, product, threshold, etc. Fitting approachDirect analytic solution Solve derivative for maximum likelihood Make a tree, add one, if better, keep going Search for best solution Response variable Continuous Continuous or categorical Continuous Sample Measure ContinuousContinuous or categorical Presence-only PredictorsContinuousContinuous or categorical Uniform residuals Yes Independent samples Yes ComplexitySimpleModerateComplex Over fitNoUnlikelyProbably

Similar presentations


 assessment Dr. Huiru Zheng Dr. Franscisco Azuaje School of Computing and Mathematics Faculty of Engineering.>")


 Vision Lab, NCTU.>")