Download presentation
Presentation is loading. Please wait.

1
Tripod Student Surveys
Discussion with Massachusetts Association of School Business Officials Tripod Student Surveys Ronald F. Ferguson, PhD Co-Founder, Tripod Education Partners, Inc., and Faculty Director, the Achievement Gap Initiative at Harvard University September 9, 2014

2
Ron Ferguson Founder of the Tripod Project and its student and teacher surveys Leads all research and analysis of Tripod survey data Eighteen years building bridges between researchers and professional K-12 educators Over thirty years teaching and research at Harvard University Director of the Achievement Gap Initiative, Harvard University

3
Why might student surveys be relevant from a school finance perspective? Turnover. Productivity.
Survey patterns can: supplement test scores as a way of tracking instructional quality improvements—they can help inform judgments on whether expenditures on professional development are producing value. help reduce turnover by more accurately identifying teachers who are struggling and might leave without targeted support. help cut turnover through reducing frustration among struggling teachers without a diagnosis of what they could do better. help identify teachers whose ideas and practices could be harvested for sharing, thereby increasing payoffs to professional development expenditures help instructional coaches and administrators more efficiently differentiate professional supports.

4
Four Key Messages Students are good observers
There is a great deal of measurable variation in teaching quality Multiple measures, multiple times, over multiple years While our surveys are also appropriate for evaluation, our primary purpose has always been professional growth

5
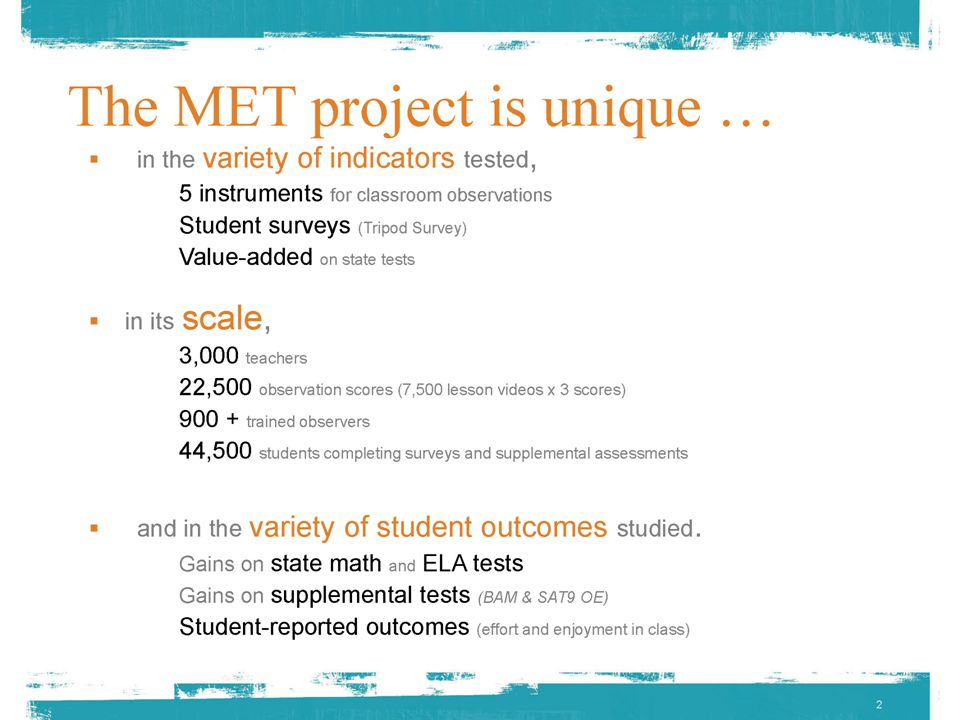
MET

8
Why the focus on student surveys?
In the Gates Measures of Effective Teaching study a single administration of Tripod surveys was found to be a reliable measure and predictive of student achievement gains. Source:

11
Nine Principles from the Gates Measures of Effective Teaching
Source:

12
Vision Universal reliance on student feedback as a respected basis for professional reflection on ways to provide enriched learning experiences in the near term, to enable high quality life outcomes over the long term. Role in evaluation systems?

13
Tripod

14
Why the name Tripod? Content Relationships Pedagogy
Improved student performance depends on strengthening three legs of our teaching practice: Content Relationships What should we teach? Does each teacher have deep knowledge of the curriculum? Are we a community? Do students and teachers care about, inspire, and motivate each other? Pedagogy How should we teach? Does each teacher use effective instructional techniques?

15
Dozens of Districts and Several States are Using Tripod
1/17/2014

16
Some Background Typically administered as an organized school and/or district activity Multiple versions: K-2, 3-5, 6-12, measuring - Student Engagement - Teaching Effectiveness - School Climate - Youth Achievement Culture Online or paper-based Approximately 20 minutes to complete, on average Response rates of over 95% are common

17
Capturing Valuable Insights from Students – The Framework Matters
Grounded in decades of teaching quality research Easy to understand and remember Excellent coverage of key education issues Ideas are integrated coherently as a system of concepts Easy to align and cross-walk with prominent observational frameworks (such as those by Danielson, Marshall, Pianta, and Marzano.)
")
18
Survey Items Organized in a Framework Refined over a Decade: Informed by Research and Input from Teachers

19
Components of the Tripod 7Cs Framework
Care: Show concern and commitment. Confer: Invite ideas and promote discussion. Captivate: Inspire curiosity and interest. Clarify: Cultivate understanding and overcome confusion. Consolidate: Integrate ideas and make learning coherent. Challenge: Press for rigor and persistence. Control: Sustain order, respect and focus. SUPPORT PRESS

20
Sample Survey Items Clarify Care
If you don’t understand something, my teacher explains it another way. My teacher explains difficult things clearly. Care Confer Captivate Clarify Consolidate Challenge Control

21
Sample Survey Items Care Confer Captivate Clarify Control
Students in this class treat the teacher with respect. My classmates behave the way the teacher wants them to. Our class stays busy and doesn’t waste time. Consolidate Challenge Control

22
Sample Survey Items Care Confer Challenge Captivate
My teacher asks students to explain more about the answers they give. My teacher doesn’t let people give up when the work gets hard. In this class, we learn to correct our mistakes. My teacher wants us to use our thinking skills, not just memorize things. Captivate Clarify Consolidate Challenge Control

23
Percentage Desirable Responses

24
Percent agreement (i.e., Mostly or Totally True), for: "In this class, we learn a lot almost every day." (One rural district: each bar is a class.)
, for: In this class, we learn a lot almost every day. (One rural district: each bar is a class.)")
25
Early Elementary Items, e.g.:
My teacher is nice to me when I ask questions. (Care) To help us remember, my teacher talks about things that we already learned. (Consolidate) My teacher makes sure that I try to do my best. (Challenge)
 To help us remember, my teacher talks about things that we already learned. (Consolidate) My teacher makes sure that I try to do my best. (Challenge)")
26
Kindergarten First Second

27
Chart for illustrative purposes: NOT real data

28
Agreement with selected statements by students in 25th and 75th percentile classrooms from the MET secondary school sample. ( From among 2985 classrooms, each with at least 5 students responding) 25th Percentile 75th 1. CARE: My teacher in this class makes me feel that s/he really cares about me 40 73 2. CONTROL: Our class stays busy and doesn’t waste time. 36 69 3. CLARIFY: My teacher explains difficult things clearly. 50 79 4. CHALLENGE: My teacher wants me to explain my answers – why I think what I think. 59 83 5. CAPTIVATE: My teacher makes learning enjoyable. 33 72 6. CONFER: My teacher wants us to share our thoughts. 47 7. CONSOLIDATE: My teacher takes the time to summarize what we learn each day. 38 67

29
Predicted difference per school year*
Predicted differences in months of learning for classrooms at the 25th versus 75th percentiles of the composite 7Cs distribution for the MET sample. (Estimated using surveys from one class and gains from another class, taught by the same teacher.) Using student survey responses in one section to predict learning gains in another. Predicted difference per school year* On state math tests 4.8 months On the Balanced Assessment in Math 3.7 months On state English Language Arts (ELA) tests 2.3 months On the Stanford 9 Open Ended ELA 2.9 months *Based on Table 9, p. 26: Bill and Melinda Gates Foundation, “Learning about Teaching: Initial findings from the Measures of Effective Teaching Project.” December 2010.
 Using student survey responses in one section to predict learning gains in another. Predicted difference per school year* On state math tests. 4.8 months. On the Balanced Assessment in Math. 3.7 months. On state English Language Arts (ELA) tests. 2.3 months. On the Stanford 9 Open Ended ELA. 2.9 months. *Based on Table 9, p. 26: Bill and Melinda Gates Foundation, Learning about Teaching: Initial findings from the Measures of Effective Teaching Project. December")
30
Teaching Practices: What matters most?
Care Control Clarify Challenge Captivate Confer Consolidate

31
Simple 7Cs correlations with previous-year value-added ratings for 233 teachers of math, science, and English language arts in one Tripod district. (Not MET)
.")
32
Some Things Tripod’s 7Cs Predict (MET data for 4th through 8th Graders; Multivariate Estimation.)
Support Press Value-Added Test Score Gains -- Inspiration to Attend College Happiness in Class Effort in Class

33
Tripod composite 7Cs favorability percentages for one district, by year and season, for each level of schooling, including only teachers with at least one class per deployment. (N>800 teachers for each level.)
.")
34
Improvement

35
A Personalize Report to Each Teacher
Surveys are organized to help focus goal-setting discussions and decisions about professional development. Progress can be tracked over time.

36
Four Possible Scenarios
Surveys are scored and results are used for performance evaluations Results are used as a check on the accuracy of the other ratings Teacher receives results, reflects, sets some goals, and is evaluated on their approach and follow through on this process. Some (which?) or all of the above
 or all of the above.")
37
School One (N=356 students) School Two (N=354 students)
Variation Tables for Two Secondary Schools School One (N=356 students) Control Challenge Care Confer Captivate Consolidate Clarify Row Mean A 1 1.0 B C 2 1.1 D 1.3 E 1.4 F 1.7 G 1.9 H 3 2.0 I 4 2.4 J 2.7 K 3.7 L 5 4.0 M 4.3 N 4.7 School Two (N=354 students) 3.0 3.1 3.3 3.6 4.4 4.6 Numbers and colors indicate quintiles in the secondary school distribution for this state.
 Control. Challenge. Care. Confer. Captivate. Consolidate. Clarify. Row Mean. A B. C D E F G H I J K L M N School Two (N=354 students) Numbers and colors indicate quintiles in the secondary school distribution for this state.")
38
School One (N=356 students) School Two (N=354 students)
Four Possible Scenarios Surveys are scored and results are used for performance evaluations Results are used as a check on the accuracy of the other ratings Teacher receives results, reflects, sets some goals, and is evaluated on their approach and follow through on this process. Some (which?) or all of the above OTHERS? School One (N=356 students) Con-trol Chal-lenge Care Con-fer Capti-vate Consoli-date Clar-ify Row Mean A 1 1.0 B C 2 1.1 D 1.3 E 1.4 F 1.7 G 1.9 H 3 2.0 I 4 2.4 J 2.7 K 3.7 L 5 4.0 M 4.3 N 4.7 School Two (N=354 students) 3.0 3.1 3.3 3.6 4.4 4.6
 or all of the above. OTHERS School One (N=356 students) Con-trol. Chal-lenge. Care. Con-fer. Capti-vate. Consoli-date. Clar-ify. Row Mean. A B. C D E F G H I J K L M N School Two (N=354 students)")
39
Each student engagement target has a unique relationship to the 7Cs
Each student engagement target has a unique relationship to the 7Cs. So, we may need different professional learning priorities, depending upon which aspects of student engagement seem most critical to improve.

40
7Cs Components Engagement Targets Care Confer Trust Captivate
Clarify Consolidate Challenge Control Trust Cooperation Ambitiousness Diligence Satisfaction

41
7Cs Components Engagement Targets Care Confer Trust Captivate
Clarify Consolidate Challenge Control Trust Cooperation Ambitiousness Diligence Satisfaction

42
7Cs Components Engagement Targets Care Confer Trust Captivate
Clarify Consolidate Challenge Control Trust Cooperation Ambitiousness Diligence Satisfaction

43
7Cs Components Engagement Targets Care Confer Trust Captivate
Clarify Consolidate Challenge Control Trust Cooperation Ambitiousness Diligence Satisfaction

44
7Cs Components Engagement Targets Care Confer Trust Captivate
Clarify Consolidate Challenge Control Trust Cooperation Ambitiousness Diligence Satisfaction

45
Four Key Messages Students are good observers
There is measurable variation in teaching quality Multiple measures, multiple times, over multiple years While our surveys are useful for evaluation, our primary purpose is professional growth

46
For info on Tripod, contact: Rob Ramsdell Tel: 617-645-2725 rob@TripodEd.com

Similar presentations


 Laying the Groundwork ISLN September 2012.>")


>")

 & PROVIDING.>")