Download presentation
Presentation is loading. Please wait.

1
1.3 Graphs of Functions Pre-Calculus

2
Home on the Range What kind of "range" are we talking about? What kind of "range" are we talking about? What does it have to do with "domain?" What does it have to do with "domain?" Are domain and range really "good fun for the whole family?" Are domain and range really "good fun for the whole family?"

3
Definitions Domain: Is the set of all first coordinates (x-coordinates) from the ordered pairs. Domain: Is the set of all first coordinates (x-coordinates) from the ordered pairs. Range: Is the set of all second coordinates (y-coordinates) from the ordered pairs. Range: Is the set of all second coordinates (y-coordinates) from the ordered pairs.
 from the ordered pairs. Range: Is the set of all second coordinates (y-coordinates) from the ordered pairs. Range: Is the set of all second coordinates (y-coordinates) from the ordered pairs..")
4
Domain The domain is the set of all possible inputs into the function { 1, 2, 3, … } The domain is the set of all possible inputs into the function { 1, 2, 3, … } The nature of some functions may mean restricting certain values as inputs The nature of some functions may mean restricting certain values as inputs

5
Range { 9, 14, -4, 6, … } { 9, 14, -4, 6, … } The range would be all the possible resulting outputs The range would be all the possible resulting outputs The nature of a function may restrict the possible output values The nature of a function may restrict the possible output values

6
Find the Domain and Range Given the set of ordered pairs, Given the set of ordered pairs,{(2,3),(-1,0),(2,-5),(0,-3)}DomainRange
,(-1,0),(2,-5),(0,-3)}DomainRange")
7
Choosing Realistic Domains and Ranges Consider a function used to model a real life situation Consider a function used to model a real life situation Let h(t) model the height of a ball as a function of time Let h(t) model the height of a ball as a function of time What are realistic values for t and for height? What are realistic values for t and for height?

8
Choosing Realistic Domains and Ranges By itself, out of context, it is just a parabola that has the real numbers as domain and a limited range By itself, out of context, it is just a parabola that has the real numbers as domain and a limited range

9
Find the Domain and Range of a Function a) Find the domain of f(x) b) Find f(-1) c) f(2) d) Find the range of f(x) *When viewing a graph of a function, realize that solid or open dots on the end of a graph mean that the graph doesn’t extend beyond those points. However, if the circles aren’t shown on the graph it may be assumed to extend to infinity.

10
Domain and Range Find the domain and range of Find the domain and range of

11
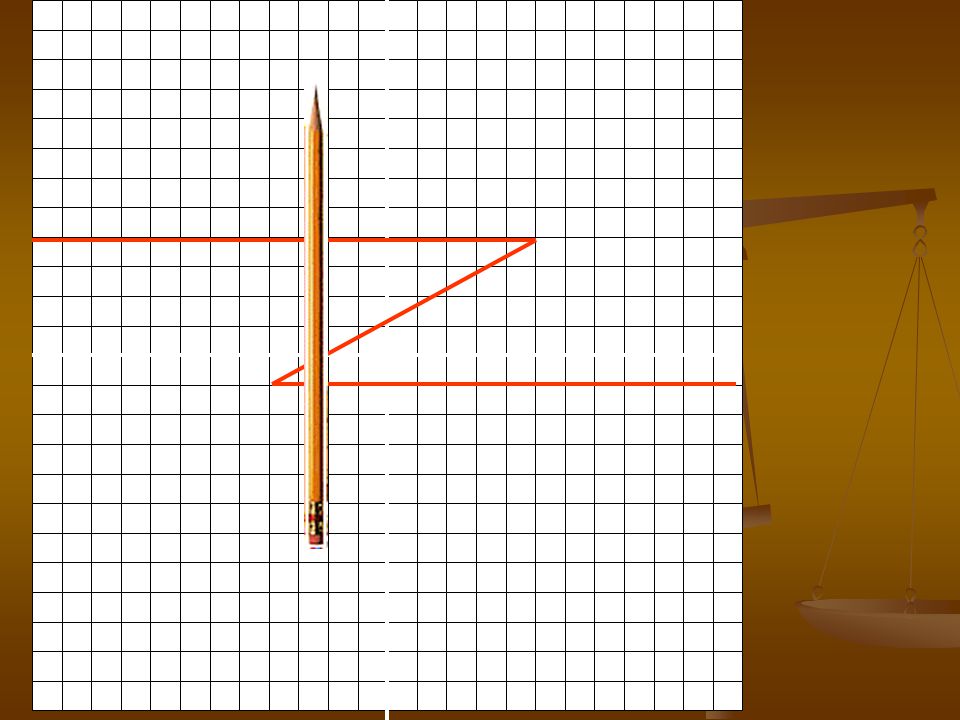
Vertical Line Test A set of points in a coordinate plane is the graph of y as a function of x if and only if no vertical line intersects the graph at more than one point. A set of points in a coordinate plane is the graph of y as a function of x if and only if no vertical line intersects the graph at more than one point.

12
If a vertical line passes through a graph more than once, the graph is not the graph of a function. Hint: Pass a pencil across the graph held vertically to represent a vertical line. The pencil crosses the graph more than once. This is not a function because there are two y-values for the same x-value.

19
The Ups and Downs Think of a function as a roller coaster going from left to right Think of a function as a roller coaster going from left to right Uphill Uphill Slope > 0 Slope > 0 Increasing function Increasing function Downhill Downhill Slope < 0 Slope < 0 Decreasing function Decreasing function 19

20
A function f is increasing on (a, b) if f (x 1 ) < f (x 2 ) whenever x 1 < x 2. A function f is decreasing on (a, b) if f (x 1 ) > f (x 2 ) whenever x 1 < x 2. Increasing Decreasing Increasing/Decreasing Functions
 if f (x 1 ) > f (x 2 ) whenever x 1 < x 2. Increasing Decreasing Increasing/Decreasing Functions.")
21
Example In the given graph of the function f(x), determine the interval(s) where the function is increasing, decreasing, or constant.
, determine the interval(s) where the function is increasing, decreasing, or constant.")
22
Maximum and Minimum Values Local Maximum ( f (c 2 ) f (x) for all x in I Absolute Maximum ( f (c 1 ) f (x) for all x) |c2|c2 |c1|c1 I
 f (x) for all x in I Absolute Maximum ( f (c 1 ) f (x) for all x) |c2|c2 |c1|c1 I")
23
Maximum and Minimum Values Local Minimum ( f (c 2 ) f(x) for all x in I ) Absolute Minimum ( f (c 1 ) f(x) for all x) I c2|c2| |c1|c1 I Collectively, maximums and minimums are called extreme values.
 f(x) for all x in I ) Absolute Minimum ( f (c 1 ) f(x) for all x) I c2|c2| |c1|c1 I Collectively, maximums and minimums are called extreme values.")
24
Approximating a Relative Minimum Use a calculator to approximate the relative minimum of the function given by Use a calculator to approximate the relative minimum of the function given by

25
Approximating Relative Minima and Maxima Use a calculator to approximate the relative minimum and relative maximum of the function given by Use a calculator to approximate the relative minimum and relative maximum of the function given by

26
Temperature During a 24-hour period, the temperature y (in degrees Fahrenheit) of a certain city can be approximated by the model where x represents the time of day, with x=0 corresponding to 6 am. Approximate the max and min temperatures during this 24-hour period. During a 24-hour period, the temperature y (in degrees Fahrenheit) of a certain city can be approximated by the model where x represents the time of day, with x=0 corresponding to 6 am. Approximate the max and min temperatures during this 24-hour period.
 of a certain city can be approximated by the model where x represents the time of day, with x=0 corresponding to 6 am. Approximate the max and min temperatures during this 24-hour period..")
27
Piecewise Defined Functions Sketch the graph of Sketch the graph of by hand. by hand.

28
Even functions A function f is an even function if for all values of x in the domain of f. Example: is even because

29
Odd functions A function f is an odd function if for all values of x in the domain of f. Example: is odd because

30
Determine if the given functions are even or odd

31
Graphs of Even and Odd functions The graph of an even function is symmetric with respect to the x-axis. The graph of an odd function is symmetric with respect to the origin.

32
Determine if the function is even or odd?

35
Homework Page 38-41 Page 38-41 2-8 even (graphical), 15-18 all, 19-29 odd, 32-36 even, 44, 48, 59-65 odd, 73-81 odd, 91
, all, odd, even, 44, 48, odd, odd, 91")
Similar presentations


>")


, #61-85 (EOO)>")
 b) c)>")

 The rate at which a tablet of Vitamin C begins to dissolve depends on the surface area of the tablet. One brand of tablet 3 cm long.>")

