Download presentation
Presentation is loading. Please wait.

1
MRS of Fat/Lipids Fat Fraction using Localized MRS
Performed in Liver routinely at 1.5 and 3T Fat Composition using Localized MRS Reported at 7T and repeated at 3T for subQ, bone marrow, and liver Fat Composition Using Multi-peak Dixon MRI Reported at 3T

2
Fat Composition using Localized MRS Human Studies Reported at 7T for subQ and Bone Marrow

3
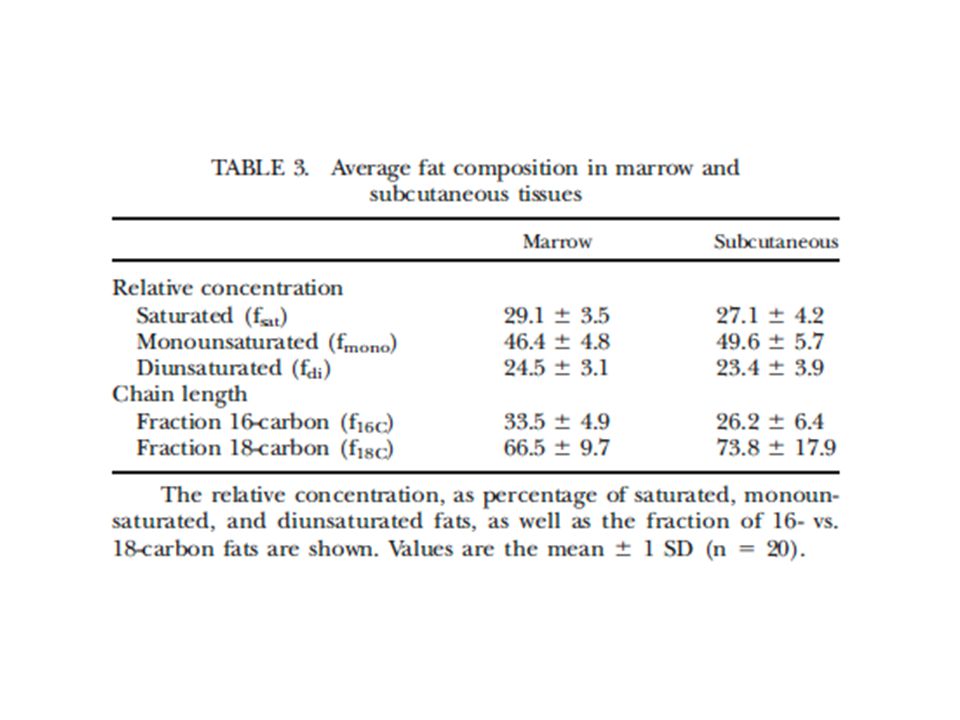
1H NMR spectra of subcutaneous fat (left) and tibial bone marrow (right) from a 26 year-old healthy male at 7 Tesla (7T) Ren, J. et al. J. Lipid Res. 2008;49: Copyright ©2008 American Society for Biochemistry and Molecular Biology

6
Correlation of measured area (F/E) between tibial bone marrow and subcutaneous fat for the 20 healthy adult subjects studied, showing that the diunsaturated fatty acid is similar for these two adipose sites and that the fat composition variation among subjects is detectable by 1H magnetic resonance spectroscopy Ren, J. et al. J. Lipid Res. 2008;49: Copyright ©2008 American Society for Biochemistry and Molecular Biology

7
MRS Results at 3T We Performed MRS on SubQ Fat Composition on Four Normal Volunteers MRS 3-4 times each Intra Subject Reproducibility LCModel ca 8% on average for the ratio of F/E Lenkinski et al. unpublished results

9
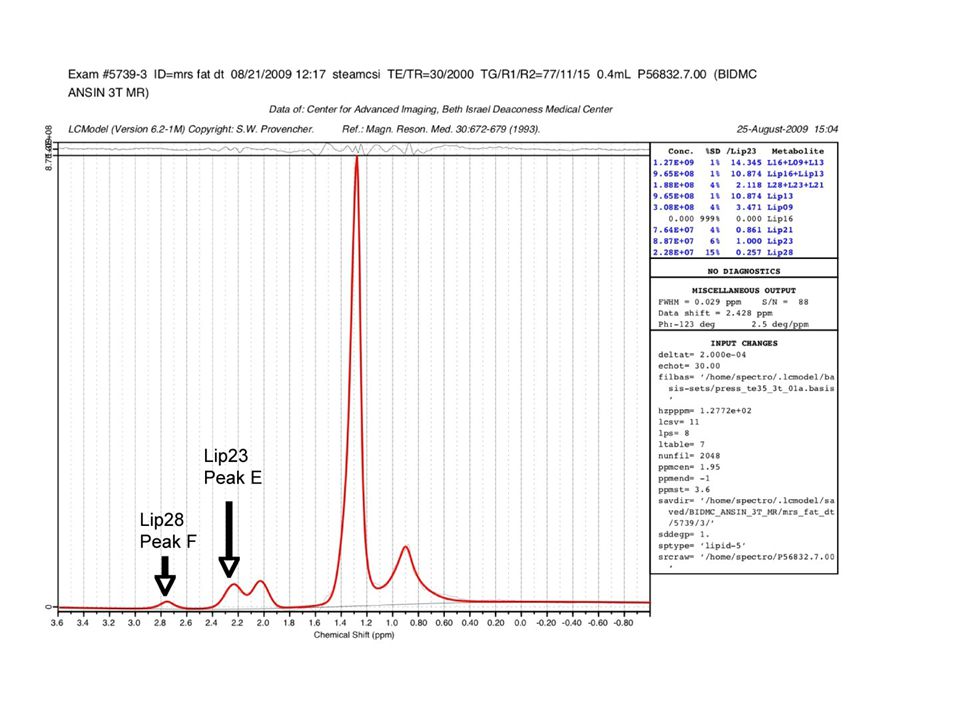
Liver fat 3T Philips Ingenia E F

10
Positive Unexpected Results The spectral resolution of fat peaks the liver is good enough to resolve peaks E and F that are indicators of the saturated/unsaturated ratio of fatty acids

11
MRI Methods CHEMICAL SHIFT-INDUCED AMPLITUDE MODULATIONS IN IMAGES OBTAINED WITH GRADIENT REFOCUSING WEHRLI FW, PERKINS TG, SHIMAKAWA A, et al. MAGNETIC RESONANCE IMAGING Volume: 5 Issue: 2 Pages:

12
Huanzhou Yu Scott B. Reeder Ann Shimakawa Jean H. Brittain
University of Wisconsin, Madison GE Healthcare Applied Science Lab Charles A. McKenzie University of Western Ontario

13
Motivation 2-pt and 3-pt Dixon/IDEAL water-fat separation
relatively insensitive to field inhomogeneities models water and fat as a single frequency CH2 CH3 olefinic 0Hz (water) water fat fat water 3.5ppm ω
 water. fat. fat. water. 3.5ppm. ω.")
14
Multiecho water‐fat separation and simultaneous R estimation with multifrequency fat spectrum modeling Illustration of the confounding effect from the fat spectra peaks when estimating R in fatty tissues (a) and the excellent fitting from the multipeak‐corrected T‐IDEAL (b). Sixteen echoes were acquired in a peanut oil phantom and the magnitude signals of a representative pixel are shown (dotted black line). When conventional T‐IDEAL was used on the first six echoes (solid blue curve in a), an overestimated R resulted (T = 8 ms), primarily due to the signal modulation from fat peak 2 (solid arrows). The high‐frequency oscillation indicated by the dashed arrows comes from the presence of fat peak 3. As part of the spectrum precalibration procedure, when treating fat peaks as six independent species using 16‐echo T‐IDEAL, the resynthesized signals fit the acquired signals extremely well (solid green curve in b). The self‐calibrated spectrum using the first six echoes (dashed red curve in b) also leads to an excellent fit to the acquired signals, particularly at the first six echoes. © This slide is made available for non-commercial use only. Please note that permission may be required for re-use of images in which the copyright is owned by a third party. Magnetic Resonance in Medicine Volume 60, Issue 5, pages , 27 OCT 2008 DOI: /mrm
 and the excellent fitting from the multipeak‐corrected T‐IDEAL (b). Sixteen echoes were acquired in a peanut oil phantom and the magnitude signals of a representative pixel are shown (dotted black line). When conventional T‐IDEAL was used on the first six echoes (solid blue curve in a), an overestimated R resulted (T = 8 ms), primarily due to the signal modulation from fat peak 2 (solid arrows). The high‐frequency oscillation indicated by the dashed arrows comes from the presence of fat peak 3. As part of the spectrum precalibration procedure, when treating fat peaks as six independent species using 16‐echo T‐IDEAL, the resynthesized signals fit the acquired signals extremely well (solid green curve in b). The self‐calibrated spectrum using the first six echoes (dashed red curve in b) also leads to an excellent fit to the acquired signals, particularly at the first six echoes. © This slide is made available for non-commercial use only. Please note that permission may be required for re-use of images in which the copyright is owned by a third party. Magnetic Resonance in Medicine Volume 60, Issue 5, pages , 27 OCT 2008 DOI: /mrm")
15
Spectrum Calibration considered known 420 freq in Hz @ 3T 472 318 -94
234 46 freq in 3T considered known

16
Multiecho water‐fat separation and simultaneous R estimation with multifrequency fat spectrum modeling Two representative spectra collected in peanut oil and knee subcutaneous fat at 3T. The spectra were shifted and displayed such that the main fat peak is at 420 Hz relative to water. Both fat spectra show a very similar multipeak pattern. Six peaks can be identified, and their chemical shift frequencies relative to the water resonant frequency at 3T are labeled. Peak 6 is at slightly different locations in the two spectra. © This slide is made available for non-commercial use only. Please note that permission may be required for re-use of images in which the copyright is owned by a third party. Magnetic Resonance in Medicine Volume 60, Issue 5, pages , 27 OCT 2008 DOI: /mrm

17
Spectrum Self-Calibration
IDEAL ψ 420 318 -94 420 318 -94 Center Freq. 420 -94 318 α1= 0.74 α2= 0.19 α3= 0.07

18
Results In principle, images can be made for each of the six fat components or their ratios.

Similar presentations


 NMR Spectroscopy>")


 studies of the human brain. In conjunction with.>")


