Download presentation
Presentation is loading. Please wait.

1
Sylvia Galen & Jon Thorsen AASP Regional Symposium January 21, 2015

2
Starting out We work in a bottom-line business Demonstrating ROI is a continuous need Tying results to the bottom line is critical We can be removed from results Not tied directly to achievements Not controlling results This makes the challenge more difficult We have opportunities to improve processes Data-based decisions are better than the other kind

3
Assessing the Environment Best actors in a supporting role Cost centers in an income stream Behind-the-scenes workers in an out-front function Process-oriented thinkers in a people-focused industry

4
Determining Relevant Metrics The most common approach – counting activity Number of visits Dollars raised Gifts closed Profiles written Requests fulfilled Events held Alumni contacted\engaged Message click-through rates

5
Determining Relevant Metrics A better approach: Measuring outcomes Number of visits – leading to new stage of relationship Dollars raised – for priority needs Gifts closed – as a % of rated capacity Profiles written – supporting a solicitation Requests fulfilled – leading to new prospect assignments Events held – reflecting ROI Alumni contacted\engaged – leading to new volunteer or donor activity Message click-through rates – constituent interaction (completing a call to action, responding to a survey, etc.)
")
6
Determining Relevant Metrics An even better approach: Reporting on impact & effectiveness, using “soft” data in addition to numbers Client satisfaction: Survey information on attitude, perceptions Hard numbers on turnaround time, deadlines Skills and competencies: How close is your team and each individual to meeting best practice expectations? Are gaps being closed? Reliability and planning How successful are we in meeting stated goals? Are we staying loyal to our mission and values?

7
Not everything that can be counted counts, and not everything that counts can be counted. - Albert Einstein Soft Data Matters, Too

8
Planning Ahead What do we want to report? How will we measure these factors? Counting – pieces, time, dollars, prospects Linking – our office’s activity to others’ actions Assessing gaps – where we are vs. where we want to be Tracking change and progress – processes improved, new results achieved ROI – how our investments have paid back

9
Setting the Right Goals & Objectives Clear connection to the mission Ties to the divisional priorities A SMART approach: Specific Measurable Achievable Relevant Time Limited

10
What tasks take the bulk of our time? Are they the right tasks? What clients demand the bulk of our time/resources? Are they right clients? How will we track and report progress? How is our responsiveness How’s the turnaround time? How is the work used? How is the quality of our work? What we can change to improve results? Asking the Tough Questions

11
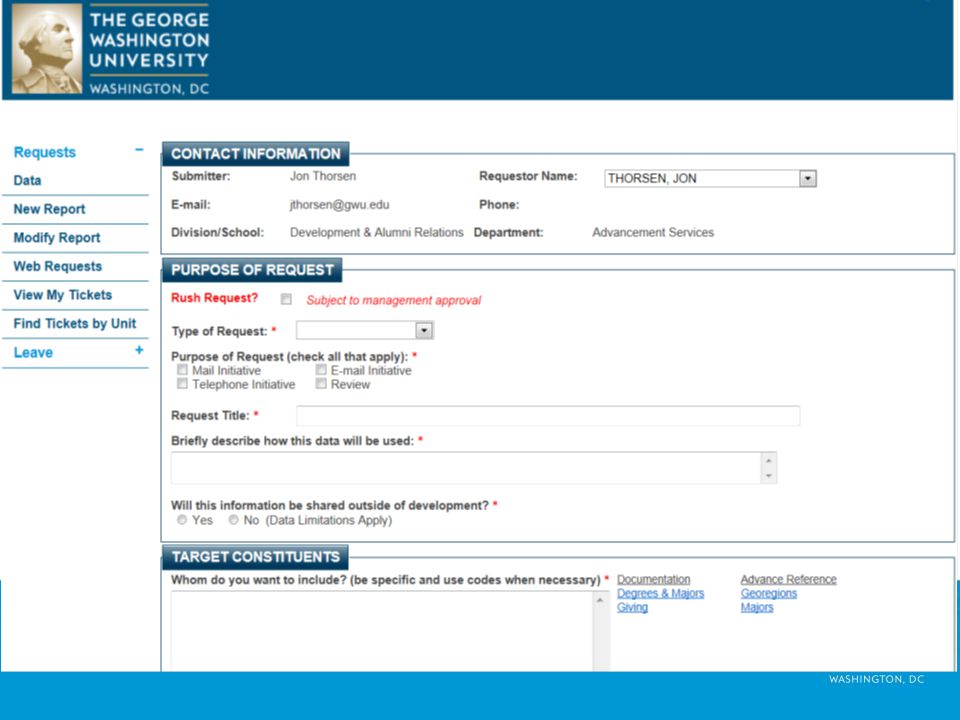
What Messages Do We Want to Send? We need to build our systems to easily pull the data we need to report progress toward goals Think ahead to the points we want to make and the information we’ll need to demonstrate our points: Increasing staff and budget Changing structure or responsibilities Implementing new processes\systems Letting go of outdated processes\systems Data should be systemic, clear and consistent Ideally, it comes from the database of record

12
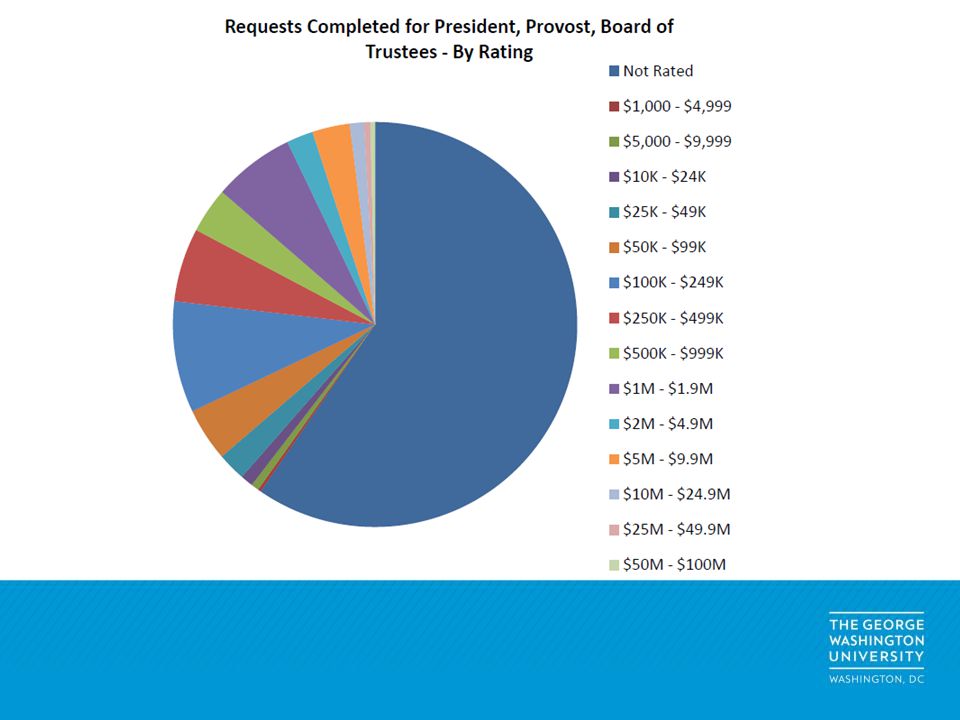
Automated ticketing system for all departments: In Place: Bio Records, Events, Relationship Management, Research, Technical Services In Progress: Gift Records, Memos of Understanding, Stewardship Allows reporting of Key Performance Indicators Ask for the Data We Want (Input) and Need (Output)
 and Need (Output)")
14
Using KPIs: Example – DAR Digital * Make a Gift * Register for an Event Log In to Access Services Update Contact Information Sign Up to Volunteer Social Advocacy

17
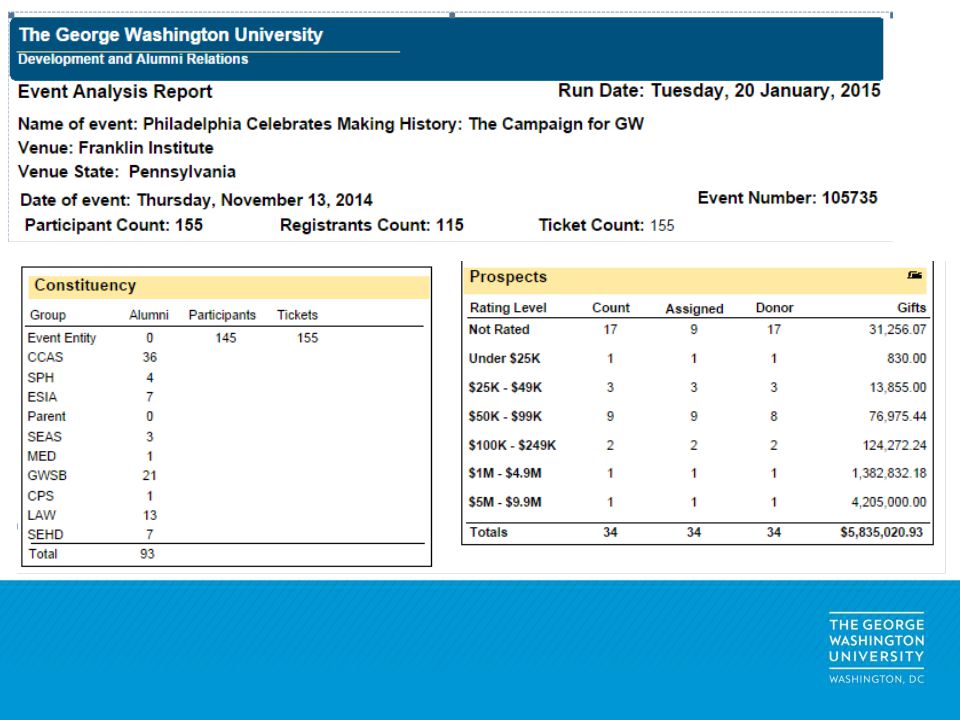
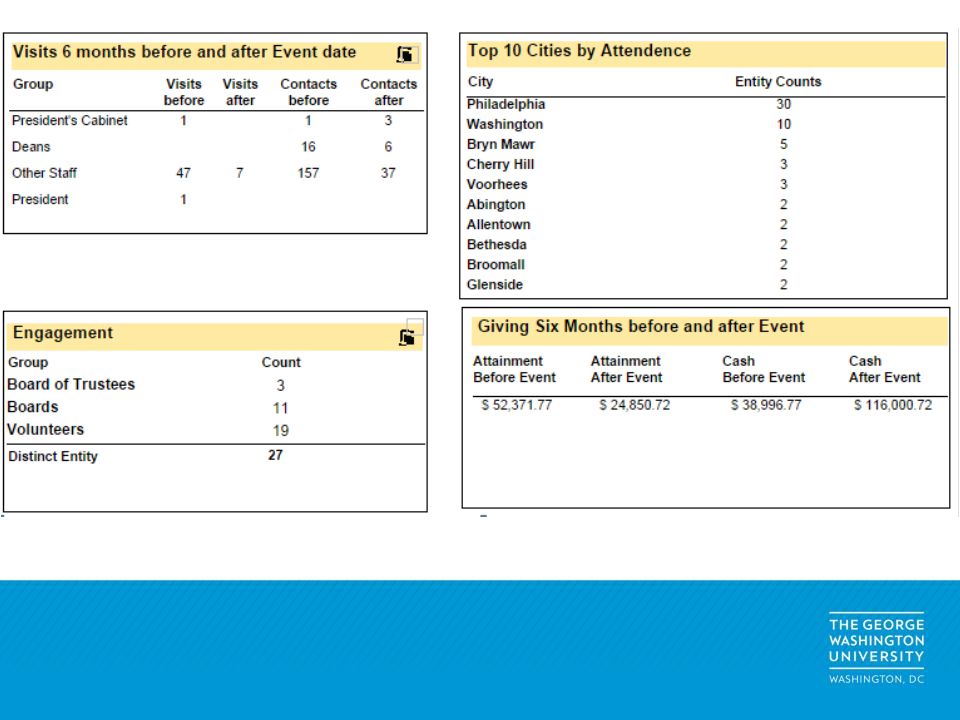
Getting the chair of a department or other key academic partner on board with the event to raise the visibility of the department Professor installations – honoring the donor who made the professorship possible, quantity/quality of the donor’s network who was engaged at the event Number of Alumni engaged further – newly volunteering, giving, attending more events Number of contact info updates Additional knowledge about interest areas of constituents Increasing volunteer\donor engagement (stage) Increasing gifts Suggested measures for events
 Increasing gifts Suggested measures for events")
18
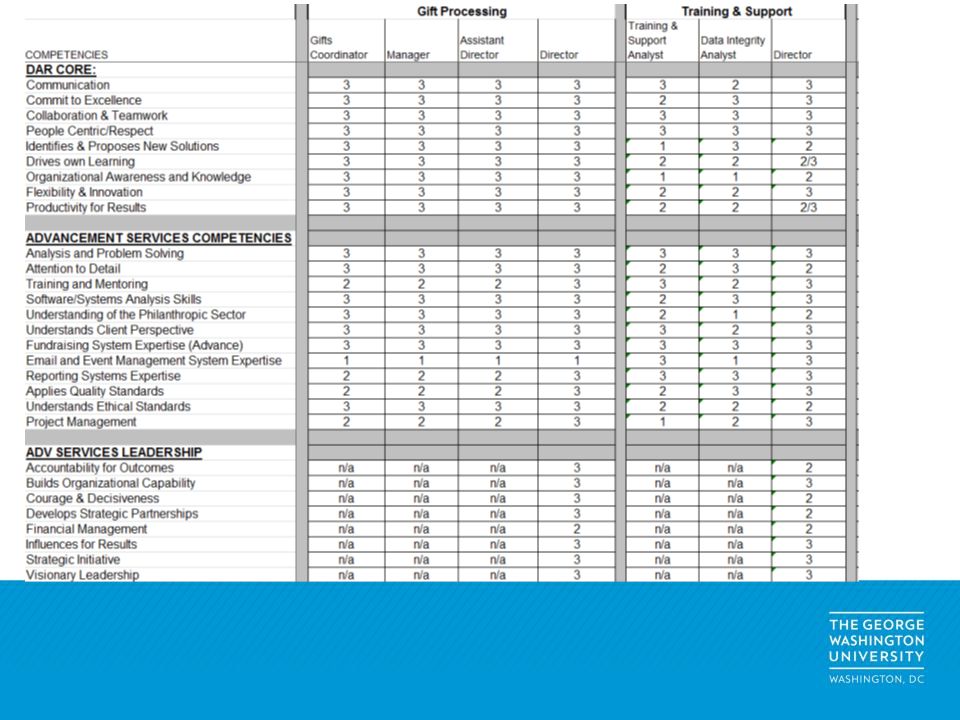
Data for Evaluating Staff Evaluation tools Using skills sets to break down areas for evaluation Establishing target performance levels Cumulating the gaps Addressing the gaps Most useful when many people share same or similar job descriptions Can also help define job paths

20
Data in the Strategic Planning Process Analysis (where are we now?) Environment Statistics Strengths and weaknesses Opportunities, threats Setting direction (where do we want to be?) Action and Implications Evaluation
 Environment Statistics Strengths and weaknesses Opportunities, threats Setting direction (where do we want to be ) Action and Implications Evaluation")
21
Data in the Planning Process Set goals Decide on strategies, objectives, action steps Assess the resource implications on each objective Need more staff to implement? Need to purchase more tools? Effect on workload/hours? Can’t answer these questions unless you know your data! Establish priorities – have a process in place Manage change

22
Sample: Project Prioritization Criteria

23
Data in Determining Progress – Outcomes What does success look like? How will we know we’ve achieved it? Applying SMART assessments: Specific Measurable Achievable Relevant Time Limited

24
Example: Reporting the Contributions of the Research & Relationship Management Team to GW’s Largest-ever Gift: 14 years from first document 15 RRM staff, including freelancers Starting in FY12: 1,780 approximate hours; 222 work days; 44.5 work weeks 3 big gifts Donors who are positively impacting future connections, cultivation, and solicitations across GW Tying Results to the Bottom Line

25
Taking The Show on the Road Share an annual report publicly Develop a dog-and-pony show for standard staff meetings Incorporate the materials into orientations for new staff and key clients Communicate in ways that will reach our clients Get outside of our comfort zones if necessary

29
Getting the Message Across Deliver meaning, not buzzwords Focus on results, not issues Apply the proper perspective Don’t focus on the provider (“Here’s all the cool stuff we do”) Connect to the user (“Here’s how this helps you in your work”) Remember the decision-makers Push information to the audience in ways that will be absorbed and utilized Think (and talk) like the client
 Connect to the user ( Here’s how this helps you in your work ) Remember the decision-makers Push information to the audience in ways that will be absorbed and utilized Think (and talk) like the client")
30
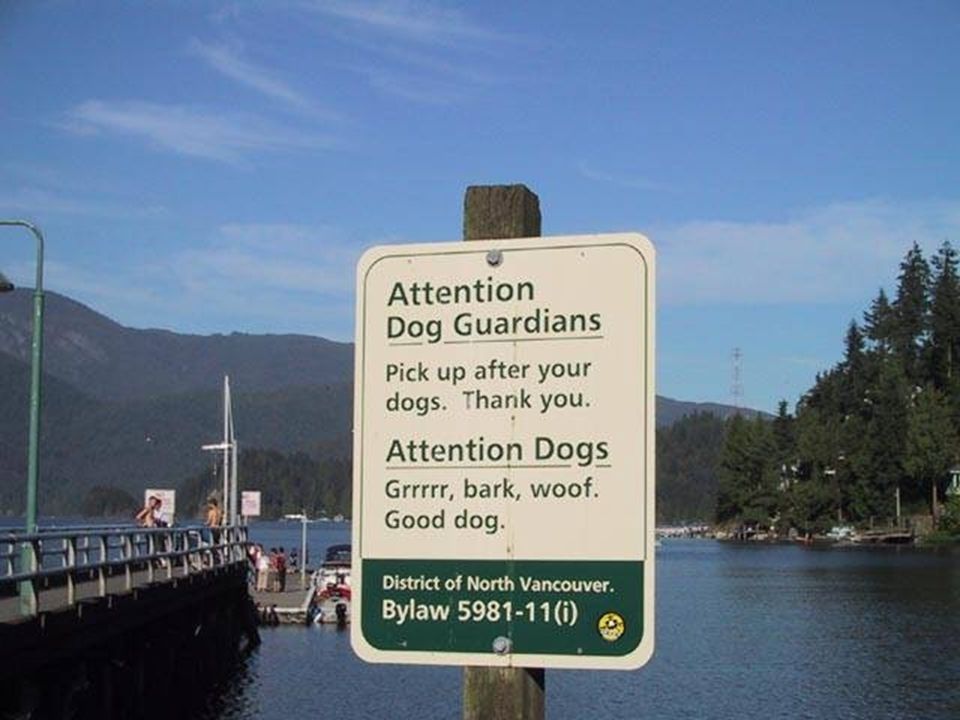
NOT…

31
Talking Like Our Clients Know how the most vital information is shared Hint: it’s usually not the most common vehicle Use the appropriate methods and settings Get in people’s faces (in the good sense) Recruit advocates, testimonials, fans
 Recruit advocates, testimonials, fans")
33
Metrics are even more important for activity that is hard to count or comprehend Everyone likes to have clear goals and expectations Evaluation, performance management and professional development are easier and more effective with clear standards and measures In the Final Analysis…

34
sgalen@gwu.edu jthorsen@gwu.edu AASP Best Practices: http://www.advserv.org/?page=Best_Practices http://www.advserv.org/?page=Best_Practices Questions?

Similar presentations


 and decision making For Crime Stoppers,>")


>")

 in Libraries.>")


