Download presentation
Presentation is loading. Please wait.

1
Maine Disclosure and Portfolio Requirements Workshop on Electric Imports and “Emission Leakage” In Support of the Regional Greenhouse Gas Initiative June 15, 2006 Faith Huntington Maine Public Utilities Commission

2
Resource Portfolio Requirement MPUC Chapter 311

3
Requirement 30% kWhs sold to Maine customers must come from “eligible” resources Applicable to all Maine retail suppliers Must be met with eligible GIS certificates (with limited exceptions)
")
4
Eligible Resources Small Power Production ( PURPA QF ) Efficient Cogeneration built before 1/1/97 Renewable Generation < 100 MW Fuel CellsGeothermal TidalHydro SolarBiomass WindMunicipal Solid Waste
 Efficient Cogeneration built before 1/1/97 Renewable Generation < 100 MW Fuel CellsGeothermal TidalHydro SolarBiomass WindMunicipal Solid Waste")
5
Compliance Use ISO-NE GIS system to comply with Maine’s RPS requirement (with limited exceptions) Supplier must have sufficient quantity of certificates from “eligible” resources in its GIS account GIS has “Maine Eligible” as attribute
 Supplier must have sufficient quantity of certificates from eligible resources in its GIS account GIS has Maine Eligible as attribute")
6
Verification Verify compliance in supplier’s annual report, including by GIS settled certificates reports MPUC can confirm through own access to GIS reports MPUC may audit

7
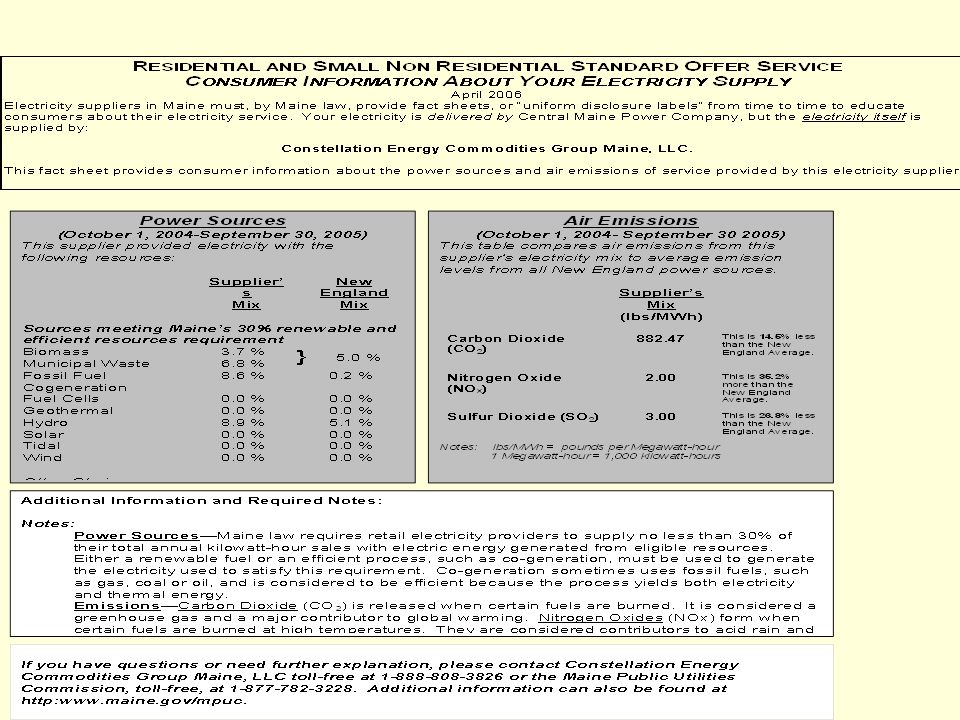
Uniform Information Disclosure MPUC Chapter 306

8
Label Purpose Consumer information Compare: - supplier portfolios - emissions profiles - among products, e.g. “green” vs standard offer - to regional average Consumers see the environmental attributes of their power supply.

9
Label Provides: Attributes associated with supplier’s load obligations over recent 12 month period Comparability – must conform visually to MPUC sample label

10
Label Content Fuel attributes of resource portfolio -- biomass, MSW, fossil fuel cogen, fuel cells, geothermal, hydro, solar, tidal, wind, nuclear, gas, oil,coal Emissions attributes of resource portfolio -- CO2, NOX, SO2 Must compare fuel mix and emissions to regional average

13
Product Offerings Separate label for each product offering Green products, for example Maine Green Power Connection :

15
Label Distribution Mailed quarterly to all residential and small commercial customers Available to all customers on request Sent with Terms of Service to residential and small commercial customers

16
Compliance and Verification Suppliers provide labels and evidence of validity with annual report GIS account reports MPUC may audit

17
Select Energy, 2004 Sample Annual Report Information Select Energy, 2004

24
Other Applications Reports to Maine Legislature Other analysis, summary statistics

26
Why GIS? Market perspective Liquidity Credibility kWh was generated no double counting Regulator perspective Simplifies attribute-to-load mapping no need to examine stacks of bilateral contracts Credibility kWh was generated kWh “owned” by supplier no double counting

27
A Bit More About GIS... Public reports State regulator reports detailed and confidential information need account w/ password

28
Public Reports GIS Account Holders GIS Generators NEPOOL Residual Mix Import System Mix GIS Generator Production Quarterly AnnualQuarterlyAnnual Imports Quarterly AnnualQuarterlyAnnual Exports Quarterly Annual QuarterlyAnnual GIS Certificate Statistics Quarterly Quarterly LSE Certificate Obligations Quarterly Annual QuarterlyAnnual Reserved Certificate Transfers Quarterly AnnualQuarterlyAnnual NEPOOL System Mix Quarterly Quarterly

29
State Regulator Reports GIS Generators Import Generators GIS GeneratorsImport Generators Retail LSEs with GIS Subaccounts in NEPOOL states Settled Certificates by LSE and State Emission Defaults for each Fuel Type Settled Certificates by LSE and StateEmission Defaults for each Fuel Type Total Certificates Allocated to Load by State Quarterly Quarterly Certificates Allocated to Load by State Quarterly Quarterly Energy Summary Quarterly AnnualQuarterlyAnnual Total Emissions by GIS Generator Quarterly AnnualQuarterlyAnnual Units Reporting Emissions via an Approved Emissions Protocol (Rule 2.5(d)) Reserved Certificate Transactions Quarterly Quarterly GIS Certificate Statistics Quarterly Quarterly Residual Mix including Reserved Certificates Quarterly Quarterly NEPOOL Residual Mix Quarterly Quarterly NEPOOL System Mix Quarterly Quarterly State Emissions by Subaccount and Averaged per Certificate Quarterly AnnualQuarterlyAnnual Banked Certificates Quarterly Quarterly Retired Banked Certificates QuarterlyQuarterly Retired MA Qualified New Renewable Certificates Load Detail by Asset ID – Current GIS Billable Amount by Participant CurrentGIS Billable Amount by Participant GIS Billable Load Detail by Asset ID
) Reserved Certificate Transactions Quarterly Quarterly GIS Certificate Statistics Quarterly Quarterly Residual Mix including Reserved Certificates Quarterly Quarterly NEPOOL Residual Mix Quarterly Quarterly NEPOOL System Mix Quarterly Quarterly State Emissions by Subaccount and Averaged per Certificate Quarterly AnnualQuarterlyAnnual Banked Certificates Quarterly Quarterly Retired Banked Certificates QuarterlyQuarterly Retired MA Qualified New Renewable Certificates Load Detail by Asset ID – Current GIS Billable Amount by Participant CurrentGIS Billable Amount by Participant GIS Billable Load Detail by Asset ID")
30
No. ofPercentageCarbon Nitrogen Particulat es SulpherOrganic FuelCertificatesby FuelDioxideMonoxideMercryOxides Particul ates (<10 mincrons) Dioxide Compou nds Biomass275,5840.754112.865630.0318500.033350.010990.007890.003220.00157 Coal5,371,52914.69852299.613310.088270.000020.363930.185930.051021.451710.00617 Diesel802,8302.1968441.205750.0088800.089950.046960.046940.712620.00188 Digester gas5,2080.014250.197920.000100.00016000.000030.00002 Efficient Resource (Maine)51,3240.140444.38880.0077200.023170.043540.011320.048030.00091 Fuel cell2,7800.007610.07990000000 Hydroelectric/Hydr opower1,042,7722.8534100000000 Jet1,041,8032.8507653.156590.0105100.117740.060850.060790.922730.00237 Landfill gas112,4380.307675.502030.0193100.005040.001040.000810.002610.0008 Municipal solid waste374,2001.0239520.619520.015940.000010.045370.105830.103820.011780.00051 Natural Gas13,729,14237.56808388.12480.1755600.505080.018080.014820.053680.01055 Nuclear9,643,46526.3881300000000 Oil3,153,8978.63024134.529250.1346100.164260.03810.034951.169180.00343 Solar Photovoltaic2650.0007300000000 Trash-to-energy584,3841.5990945.640080.010660.000020.083440.238250.23780.018990.00053 Wind2,2690.0062100000000 Wood350,8120.9599514.645750.0282700.026670.031510.028140.001360.00082 36,544,7021001,020.570.531670.000061.45817 0.7810 8 0.59829 4.3959 5 0.02957 NEPOOL System Mix - System Mix By Fuel (Contribution to 1 MWh of System Mix emissions from each Fuel in lbs/MWh)
 Dioxide Compou nds Biomass275, Coal5,371, Diesel802, Digester gas5, Efficient Resource (Maine)51, Fuel cell2, Hydroelectric/Hydr opower1,042, Jet1,041, Landfill gas112, Municipal solid waste374, Natural Gas13,729, Nuclear9,643, Oil3,153, Solar Photovoltaic Trash-to-energy584, Wind2, Wood350, ,544, , NEPOOL System Mix - System Mix By Fuel (Contribution to 1 MWh of System Mix emissions from each Fuel in lbs/MWh).")
32
For More Information... MPUC home page http://www.maine.gov/mpuc/ GIS home page http://www.nepoolgis.com/

Similar presentations


 of the Internal Market Directive (Directive 2003/54/EC) Final customers.>")

 April 20, 2009.>")


? What are they used for? Who uses them? How is REC ownership tracked? What is the Renewable Portfolio.>")


 increasing.>")


, 2001. Request to reproduce all or.>")
 business CESI Renewable.>")