Download presentation
Presentation is loading. Please wait.

1
Public Higher Education: Public Trust, Private Investment, or Lost Cause! University of Denver – Strategic Issues Panel The Future of State Government in Colorado Presentation by: David Longanecker President, Western Interstate Commission for Higher Education (WICHE) University of Denver – Strategic Issues Panel The Future of State Government in Colorado Presentation by: David Longanecker President, Western Interstate Commission for Higher Education (WICHE) The Colorado Story A Perfect Situation
 University of Denver – Strategic Issues Panel The Future of State Government in Colorado Presentation by: David Longanecker President, Western Interstate Commission for Higher Education (WICHE) The Colorado Story A Perfect Situation.")
2
Public Higher Education: Public Trust, Private Investment, or Lost Cause! University of Denver – Strategic Issues Panel The Future of State Government in Colorado Presentation by: David Longanecker President, Western Interstate Commission for Higher Education (WICHE) University of Denver – Strategic Issues Panel The Future of State Government in Colorado Presentation by: David Longanecker President, Western Interstate Commission for Higher Education (WICHE) The Colorado Story A Perfect Situation Perfect Storm or Perfect Opportunity
 University of Denver – Strategic Issues Panel The Future of State Government in Colorado Presentation by: David Longanecker President, Western Interstate Commission for Higher Education (WICHE) The Colorado Story A Perfect Situation Perfect Storm or Perfect Opportunity.")
3
The Perfect Storm: Three Converging Waves Wave One: Colorado’s Economic Competitiveness Wave Two: Who We Are – Can Colorado Be Competitive Wave Three: What Colorado Has in Resources to Commit to This Venture

4
The Liberal Borrowings Knocking on the College Door (WICHE) Beyond Social Justice (WICHE) National Center for Higher Education Management Systems (NCHEMS) : www.higheredinfo.org. State Higher Education Executive Officers (SHEEO), SHEF Report, February 2010.
, SHEF Report, February")
5
The Converging Waves Wave One: Colorado’s Economic Competitiveness Wave Two: Who We Are – Can Colorado Be Competitive Wave Three: What Colorado Has in Resources

6
Relationship Between Educational Attainment, Personal Income, and Economic Strength AL AZ AR CA CO CT DE IL IN IA KY LA MD MA MS NJ NY ND OK OR SC SD UT VA WA MN NH TN TX WV WI WY $15,000 $20,000 $25,000 $30,000 15%20%25%30%35%40% Personal Income Per Capita, 2000 Percent of Adults Age 25-64 with a Bachelor’s Degree or Higher MT HI AK GA KS ME NE NV NC OH PA VT ID MI MO NM RI FL US Low Income, High Educational Attainment Low Income, Low Educational Attainment High Income, High Educational Attainment High Income, Low Educational Attainment State New Economy Index (2002) Top Tier Middle Tier Low Tier
 Top Tier Middle Tier Low Tier")
7
Educational Attainment & Personal Income by Colorado Counties

8
Differences in College Attainment (Associate and Higher) Between Younger and Older Adults - U.S. and OECD Countries, 2005 Source: Organisation for Economic Co-operation and Development (OECD), Education at a Glance 2007
, Education at a Glance")
9
Differences in College Attainment (Associate and Higher) Between Younger and Older Adults - U.S., 2005 Source: U.S. Census Bureau, 2005 ACS

10
Percent of Adults with an Associate Degree or Higher by Age Group – Colorado, U.S. & Leading OECD Countries Source: OECD, Education at a Glance 2008

11
The White Caps on the First Wave We’ve Been A Leader But Slip-Sliding Away Losing Ground: Falling Internationally (Comparatively) Mixed Bag Nationally One Size Doesn’t Fit All Two Stories – The Haves & the Have Nots
 Mixed Bag Nationally One Size Doesn’t Fit All Two Stories – The Haves & the Have Nots")
12
The Public Policy Response: Thinking Here & Elsewhere National/Federal The President’s Goal – Lead Again by 2020 Increased visibility – Education & Workforce Gates and Lumina Regions & Their States East: Status Quo, more or less Mid-West: A Mixed Bag Rhetoric trumps action South: Investing in Education But still disconnects West (and Colorado): Question the Data Blame Immigration Disinvest in Access and Quality Question the data Fight for Immigration Reform (Less and More)
: Question the Data Blame Immigration Disinvest in Access and Quality Question the data Fight for Immigration Reform (Less and More)")
13
The Converging Waves Wave One: Colorado’s Economic Competitiveness Wave Two: Who We Are – Can Colorado Be Competitive Wave Three: What Colorado Has in Resources

14
Public & Nonpublic High School Graduates 1991-92 through 2021-22, Colorado Total = public and non public, all races. Source: WICHE, Knocking at the College Door ActualProjected

15
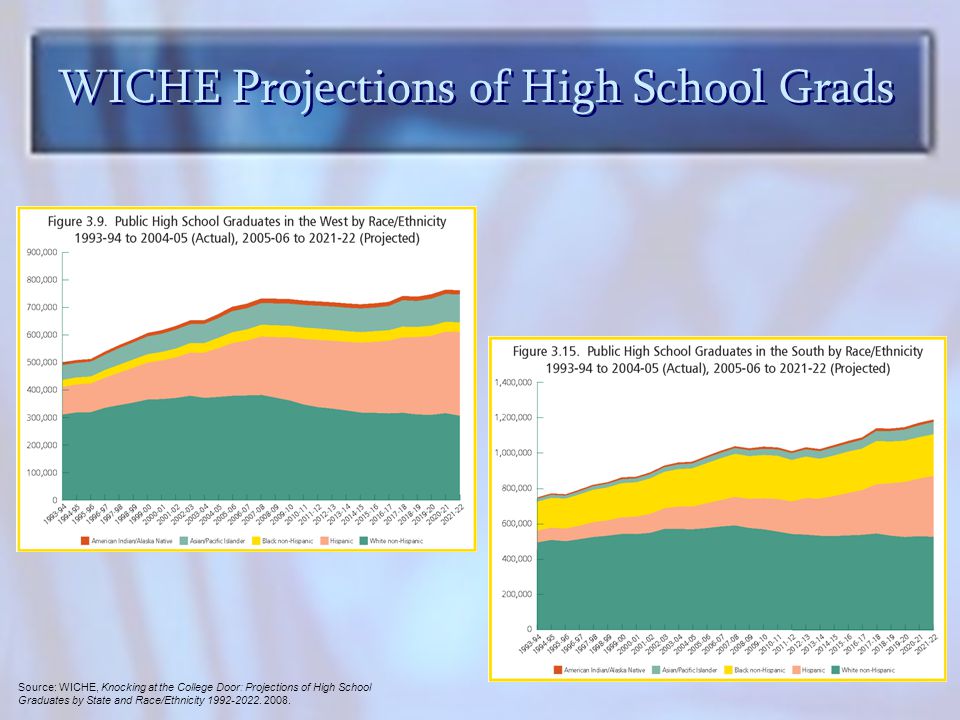
WICHE Projections of High School Grads Source: WICHE, Knocking at the College Door: Projections of High School Graduates by State and Race/Ethnicity 1992-2022. 2008.
16
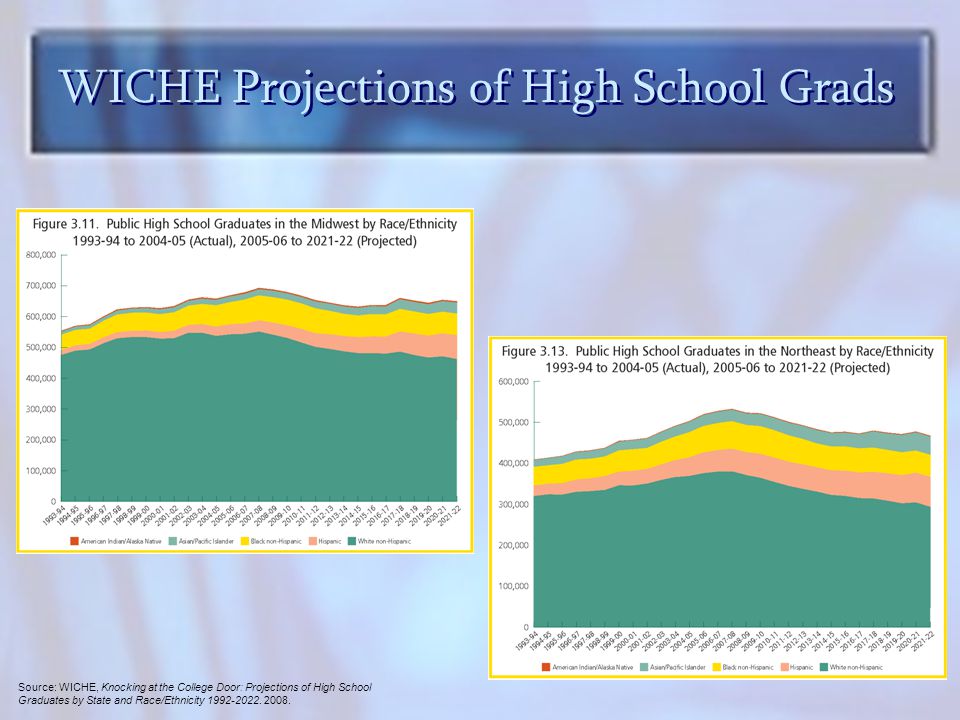
WICHE Projections of High School Grads Source: WICHE, Knocking at the College Door: Projections of High School Graduates by State and Race/Ethnicity 1992-2022. 2008.
17
Difference in Education Attainment Between Whites and Hispanics (2006, Percent) Source: U.S. Census Bureau, 2006 American Community Survey (ACS) Public Use Microdata Sample (PUMS) File. Via NCHEMS
 Public Use Microdata Sample (PUMS) File. Via NCHEMS.")
18
Difference Between Whites and Next Largest Race/ Ethnic Group in Percentage of Adults Age 25-34 with an Associate Degree or Higher, 2000 Source: U.S. Census Bureau, PUMS (based on 2000 Census), Via NCHEMS
, Via NCHEMS.")
19
The White Caps on the Second Wave Those with whom we have succeeded are declining Those with whom we have not succeeded are increasing “Average” won’t sustain us, and may not even be achievable And, One Size Doesn’t Fit All Really Two Stories – The Haves & the Have Nots

20
The Public Policy Response: Here and Elsewhere The Good News National Consensus Efforts Complete College America (Colorado is in) NGA focus area for New Governors Equity focus – Nevada, Wisconsin An emerging “Change” agenda – Metro state/NCAT The Other News – Same Old, same old Mission creep Focus on highest achieving (financial aid & enrolment protections) Challenges to diversity & diverse populations Whining trumps Changing -- it’s “their” fault Students for not being smart States for not being supportive
 NGA focus area for New Governors Equity focus – Nevada, Wisconsin An emerging Change agenda – Metro state/NCAT The Other News – Same Old, same old Mission creep Focus on highest achieving (financial aid & enrolment protections) Challenges to diversity & diverse populations Whining trumps Changing -- it’s their fault Students for not being smart States for not being supportive")
21
The Converging Waves Wave One: Colorado’s Economic Competitiveness Wave Two: Who We Are – Can Colorado Be Competitive Wave Three: What Colorado Has in Resources

22
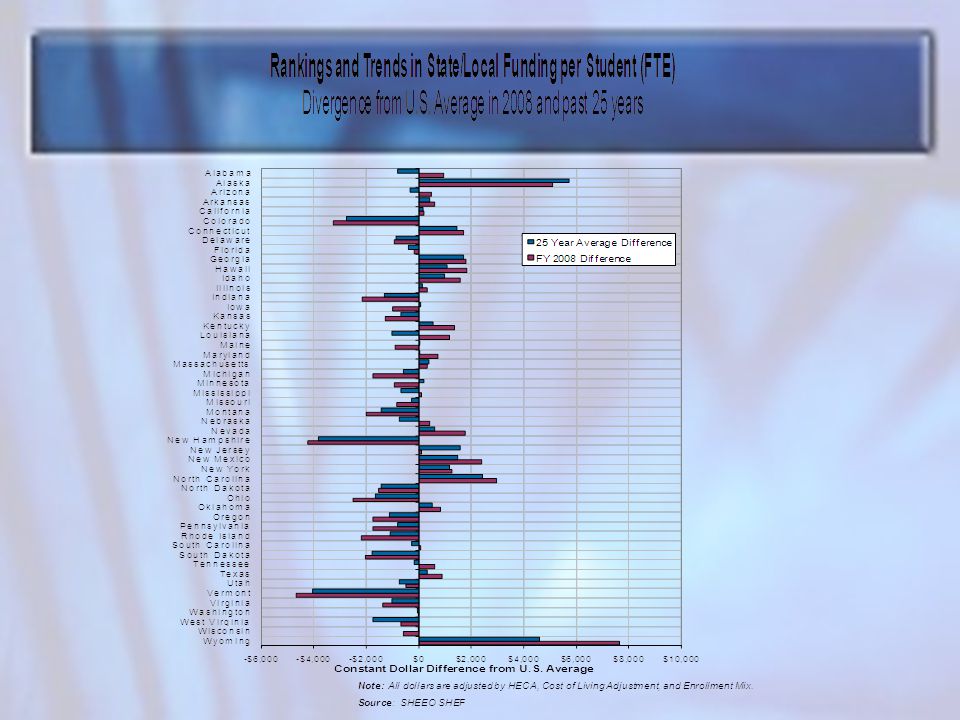
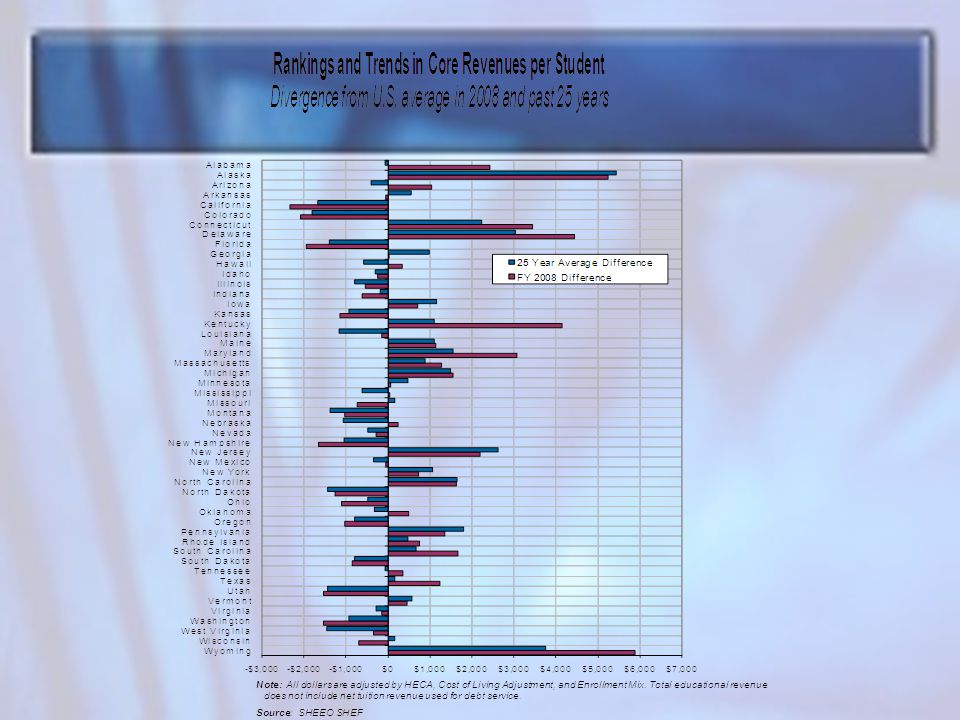
Life could have been worse Public FTE Enrollment, Educational Appropriations and Total Educational Revenue per FTE, U.S., Fiscal 1983-2009 Source: SHEEO, SHEF 2009

23
But not in Colorado Public FTE Enrollment, Educational Appropriations and Total Educational Revenue per FTE, U.S., Fiscal 1983-2008

26
Revenues Per Student from Net Tuition, State, & Local Appropriations Public Research Sources: NCES, IPEDS 2006-07 Finance Files; f0607_f1a and f0607_f2 Final Release Data Files. NCES, IPEDS 2007-08 Institutional Characteristics File; hd2007 Final Release Data File. NCES, IPEDS 2006-07 Enrollment Files; ef2006a, effy2007, and efia2007 Final Release Data Files. Via NCHEMS

27
Revenues Per Student from Net Tuition, State, & Local Appropriations Public Masters and Baccalaureate Sources: NCES, IPEDS 2006-07 Finance Files; f0607_f1a and f0607_f2 Final Release Data Files. NCES, IPEDS 2007-08 Institutional Characteristics File; hd2007 Final Release Data File. NCES, IPEDS 2006-07 Enrollment Files; ef2006a, effy2007, and efia2007 Final Release Data Files. Via NCHEMS

28
Revenues Per Student from Net Tuition, State, & Local Appropriations Public 2-Year Sources: NCES, IPEDS 2006-07 Finance Files; f0607_f1a and f0607_f2 Final Release Data Files. NCES, IPEDS 2007-08 Institutional Characteristics File; hd2007 Final Release Data File. NCES, IPEDS 2006-07 Enrollment Files; ef2006a, effy2007, and efia2007 Final Release Data Files. Via NCHEMS

29
General Operating Revenues Per Student Available to Colorado Community Colleges, 2006-07 Gen Op Revenues = State + Local + Net Tuition Source: NCHEMS NCES IPEDS Finance Survey, 2006-07 Colorado Mtn College Aims CC Red Rocks CC Arapahoe CC CC of Aurora Front Range CC Pikes Peak CC Morgan CC CC of Denver Colorado N’western CC N’eastern Jr College Pueblo CC Otero Jr College Lamar CC $20,000 $18,000 $16,000 $14,000 $12,000 $10,000 $8,000 $6,000 $4,000 $2,000 $0

30
Projected State and Local Budget Surplus (Gap) as a Percent of Revenues, 2016 Source: NCHEMS; Don Boyd (Rockefeller Institute of Government), 2009 Via NCHEMS
 as a Percent of Revenues, 2016 Source: NCHEMS; Don Boyd (Rockefeller Institute of Government), 2009 Via NCHEMS")
31
The White Caps on the Third Wave Prospects look bleak for much more in the short term New Normal suggests a very different future than past. Triage often sacrifices the most vulnerable

32
The Public Policy Response: Here and Elsewhere A stimulus package that discouraged innovation and change A funding structure that inadequately supports equity oriented institutions Mission creep, which reduces teaching productivity Tax cuts over tax investments

33
The Colorado story – Three Huge Converging Waves Demographics present a challenge, all else being equal The finances are perilous We have been educationally competitive, which has made us economically competitive and comparative just, but: Were slipping And the good life has not been equitably distribute Public Policy inconsistent with the times or their needs

34
The Colorado Story – Three Real Opportunities Opportunity One: Our Economic Competitiveness Opportunity Two: Our Changing Demographics Opportunity Three: Our Revenue Base

35
The Colorado Story – Three Real Opportunities Opportunity One: Our Economic Competitiveness Colorado is relatively wealthy Among highest Nationally in per capata income In the Nation that remains the wealthiest country in the World. We have “the financial capacity”

36
The Colorado Story – Three Real Opportunities Opportunity Two: Our Changing Demographics Colorado starts from a reasonably successful base, over all Improvements in serving Hispanic students, will reap huge benefits

37
The Colorado Story – Three Real Opportunities Opportunity Two: Our Changing Demographics Positive Policy Trends Pay for Outcomes Evidence based Many focused on reducing the Gaps Renewed focus on smart need-based student financial aid Preservation New Initiatives Less is More in the Curriculum Reinvention of Remediation (CAT) Broader adoption of the Equity Scorecard Federal Initiatives – SAFRA & AGI
 Broader adoption of the Equity Scorecard Federal Initiatives – SAFRA & AGI")
38
The Colorado Story – Three Real Opportunities Opportunity Three: Our revenue base Colorado Has A Cost Effective System, so investments likely to reap results

39
Productivity: Total Funding per Degree/Certificate (Weighted*, 2006-2007) *Adjusted for value of degrees in the state employment market (median earnings by degree type and level) Sources: SHEEO State Higher Education Finance Survey 2008; NCES, IPEDS Completions Survey; U.S. Census Bureau, American Community Survey (Public Use Microdata Samples)
.")
40
State Tax Capacity & Effort Indexed to U.S. Average Source: State Higher Education Executive Officers (SHEEO) AL AK AZ AR CA CO CT DE GA HI IL IN IA KS KY LA ME MD MA MS MT NE NV NJ NY NC ND OH OK PA RI SC SD UT VT VA WA FL ID MI MN MO NH NM TN TX WV WI WY 0.6 0.7 0.8 0.9 1.0 1.1 1.2 1.3 1.4 1.5 1.6 1.7 0.60.81.01.21.4 State Tax Capacity (Total Taxable Resources Per Capita) State Tax Effort (Effective Tax Rate) US OR
 AL AK AZ AR CA CO CT DE GA HI IL IN IA KS KY LA ME MD MA MS MT NE NV NJ NY NC ND OH OK PA RI SC SD UT VT VA WA FL ID MI MN MO NH NM TN TX WV WI WY State Tax Capacity (Total Taxable Resources Per Capita) State Tax Effort (Effective Tax Rate) US OR.")
41
The Colorado Story – Perfect Storm

42
The Colorado Story – Perfect Storm, or Perfect Opportunity Our Choice

Similar presentations

 Broomfield, Colorado May 15, 2012 Presentation by:>")


 AL AK AZ AR CA CO.>")


