Download presentation
Presentation is loading. Please wait.

1
Ch10 Multivariate Process Monitoring and Control 本章介紹多變量的 control charts: 1. The Holling T 2 chart 2. 多變量的 EWMA control chart 3. 其他管制多變量的 variability 的方法

2
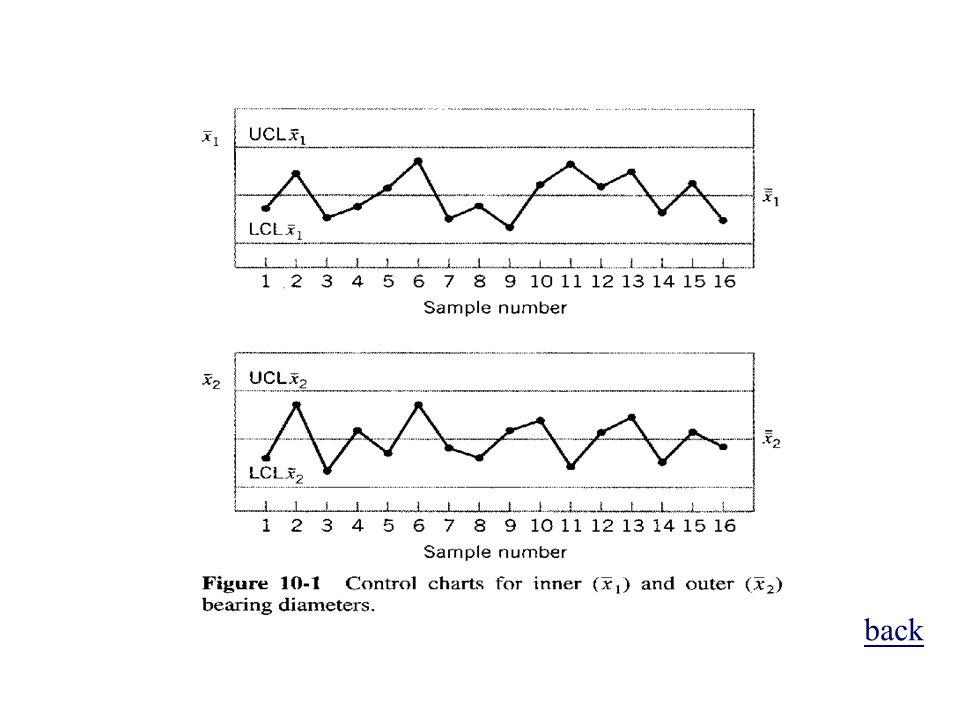
The multivariate quality control problem: 需同時管制兩個以上具有關連性之品質特性時 例如 : 軸承之內徑 (x 1 ) 和外徑 (x 2 ) x 1 和 x 2 分別獨立管制時 : ( 附圖 10-1) 附圖 P( exceeds three-sigma CLs) =.0027 i = 1, 2 製程為 in control 時, P( 和 同時 exceeds CLs) = (.0027) 2 =.00000729 P( 和 同時 plot inside CLs) = (.9973) 2 =.99460792 Process in control : ( 附圖 10-2) 附圖
 和外徑 (x 2 ) x 1 和 x 2 分別獨立管制時 : ( 附圖 10-1) 附圖 P( exceeds three-sigma CLs) =.0027 i = 1, 2 製程為 in control 時, P( 和 同時 exceeds CLs) = (.0027) 2 = P( 和 同時 plot inside CLs) = (.9973) 2 = Process in control : ( 附圖 10-2) 附圖")
3
以 P(Type I error) = 之管制圖個別管制 p 個獨立之 品質特性時, 1. 聯合管制程序之 Type I error 發生的機率為 = 1 - (1 - ) p 2. P(p 個平均值同時 plot in control) = (1 - ) p.
 = (1 - ) p..")
4
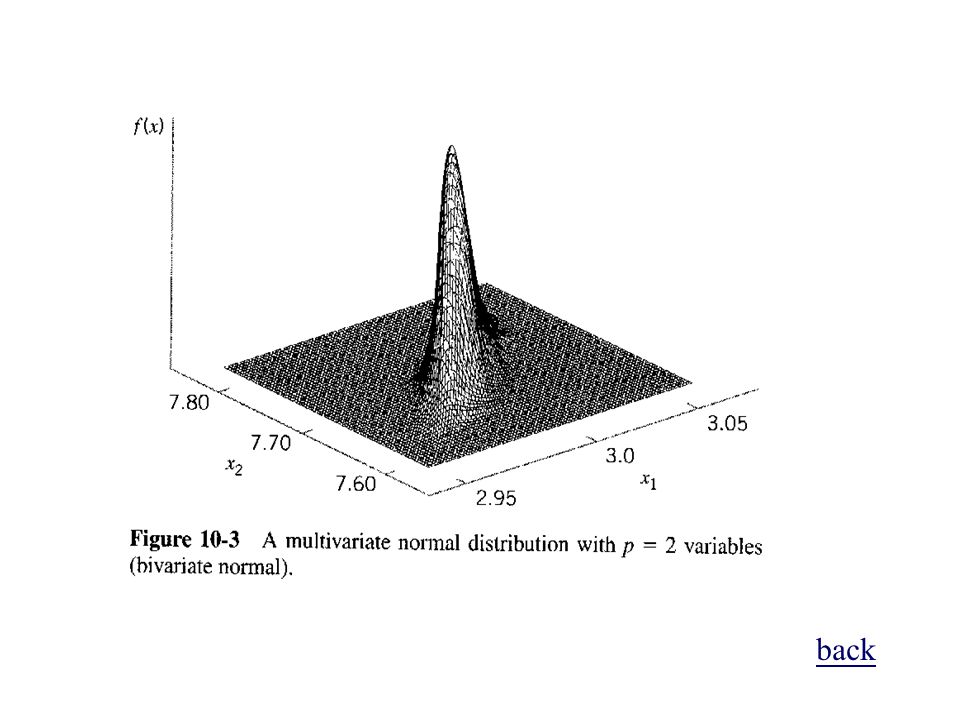
多變量資料的記述 1. The multivariate normal distribution 假設變量 x = [x 1,x 2, …, x p ], 期望值 = [ 1, 2, …, p ], 共變異數矩陣 . 機率密度函數為 ( 附圖 10-3) 附圖
 附圖.")
5
2. The sample mean vector and covariance matrix A random sample x 1,x 2, …, x p, sample mean vector:, sample covariance matrix:, sample variances:, sample covariances:, and

6
back

Similar presentations


 ;而另一些 事件則會受到該事件現階段的狀況影響。>")


 Matrix 1Matrix 2Answer.>")


 一種質性資料, 其觀察值可歸類於數個不相交的項目內, 例 : 性別, 滿意度, …, 一般以各項的統計次數表現. 分析此種資料,通常用卡方檢定 類別資料分析 ----- 卡方檢定 卡方檢定基本理論 一個含有 k 項的試驗,設 p i.>")


