Download presentation
Presentation is loading. Please wait.

2
Aaron C. Clark Eric N. Wiebe Tom Shown Miriam Ferzli Contributions by Rachel McBroom North Carolina State University Department of Mathematics, Science, and Technology Education

3
What is VisTE? Visualization in Technology Education (VisTE) is a standards-based initiative designed to promote the use of graphic visualization among grade 8-12 students to improve their higher order thinking, communication skills, and understanding of science, technology, engineering, and mathematics (STEM) topics.
 is a standards-based initiative designed to promote the use of graphic visualization among grade 8-12 students to improve their higher order thinking, communication skills, and understanding of science, technology, engineering, and mathematics (STEM) topics..")
4
What is VisTE? By using simple and complex visualization tools, students can conduct research, analyze, solve problems, and communicate major topics identified in the new ITEA Standards for Technological Literacy (STL) as well as topics aligned with national mathematics and science standards.
 as well as topics aligned with national mathematics and science standards..")
5
Project Rationale Focuses on helping students achieve technological literacy by… Increasing student interest and competencies in technology Fostering interdisciplinary instruction Teaching communication skills across all content areas Challenging students to evaluate societal impacts of technologies Allowing students to experience practical applications of science and mathematics in a technology education environment

6
VisTE: The Product VisTE is a 12 unit program contained on 3 cd’s. Each unit is a project for students, containing multiple activities Each unit contains activities of varying levels, from introductory to advanced Students research, plan, design, build, and present with each unit Each unit includes a matrix indicating specific standards addressed for that unit Units largely independent of each other Units incorporate a range of software tools as well as hands-on activities

7
VisTE Unit Topics Disc Two Communications Technology: Introduction to 3-D Modeling and Animation Energy and Power Technology Prosthetics Technology Bio-processing Technology Disc Three Biometrics Nano technology Weather imaging Careers Disc One Communications Technology: Introduction to Visualization Medical Technology: Image Processing Biotechnology: The PCR Transportation Technology: Visualizing Rocketry

8
Goals for Student Learning Create visualizations using Basic design skills Graphing image processing 2D and 3D modeling Animation Manipulate and manage data, including the use of spreadsheets Master a wide variety of computer data input and output devices that handle audio, video, static graphic, and alphanumeric-based information

9
Sample Student Work Communications Technology: Introduction to Visualization

11
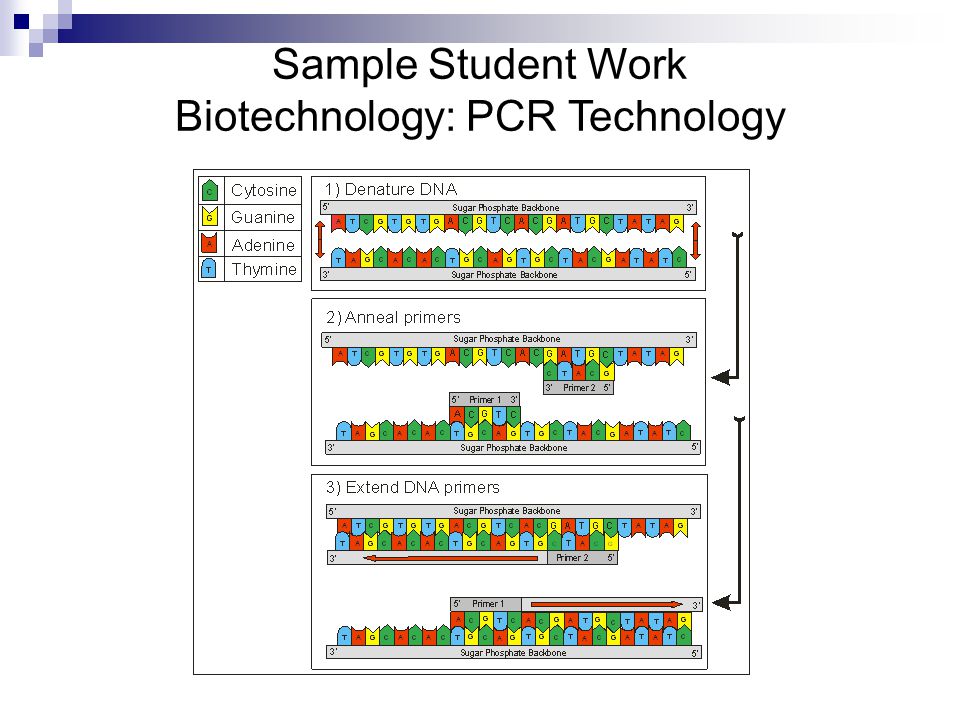
Sample Student Work Biotechnology: PCR Technology

12
Pricing The VisTE series will be sold one cd per physical school building – the product may be networked throughout the building: CD 1 - $299 April 2005 CD 2 - $99 (w/ prior purchase of cd 1) Fall 2005 CD 3 - $99 (w/ prior purchase of cd 1) Spring 2006 All 3 cd’s together - $497 Spring 2006 (District licenses will be negotiable)
 Fall 2005 CD 3 - $99 (w/ prior purchase of cd 1) Spring 2006 All 3 cd’s together - $497 Spring 2006 (District licenses will be negotiable)")
13
Pricing Optional Student CDs Also available, will be 10 packs of student lab CDs, containing all the projects, labs, and worksheets from the main product, but without the instructor support material. This will enable students to work independent from the school. 10 Pack of Student Lab CDs: $75.00 ISBN: 1-4018—8365-6

14
Interested? For more information, please contact Delmar Learning at 1-800-645-3565 Use ISBN: 1-4018-8364-8 for ordering and product information

Similar presentations
 A Project of the International Association for the Evaluation of Educational Achievement (IEA)>")

 Day 2.>")


 April 27, 2005.>")


 So what... › Implications and Impact in NH ›>")


