Download presentation
Presentation is loading. Please wait.

1
Astrophysics Research Projects: massive star winds, x-ray emission, theoretical models, spectroscopy, laboratory plasma astrophysics David Cohen on leave 2007-08…but projects for the next few years

2
The most massive, luminous stars in the galaxy… …have powerful radiation-driven stellar winds. eta Carina

3
The Chandra X-ray Observatory (artist’s conception)
")
4
Model of wind x-ray emission and absorption (visualization: left; resultant X-ray emission line profile: right; data: inset) Contours of constant optical depth (observer is on the left) wavelength red blue brightness
 Contours of constant optical depth (observer is on the left) wavelength red blue brightness")
5
The basic wind-profile model R o =1.5 R o =3 R o =10 =1,2,8 key parameters: R o & * j ~ 2 for r/R * > R o, = 0 otherwise Adjust the model parameters Adjust the model parameters Fit the data Fit the data Derive the physical properties of the wind from the x-ray line profiles Derive the physical properties of the wind from the x-ray line profiles

6
* = 2.0 R o = 1.5 Pup: Fe XVII line at 15.014 Å - Chandra Major science result: less absorption than expected - stellar wind mass-loss rates have been overestimated (Roban Kramer, ‘03); Kramer, Cohen, & Owocki, Ap.J., 592, 532; Cohen et al., MNRAS, 368, 1905.
; Kramer, Cohen, & Owocki, Ap.J., 592, 532; Cohen et al., MNRAS, 368, 1905.")
7
Could clumping in the stellar wind play a role? We’ve been making theoretical models of wind clumping and analyzing its effect on x-ray line profiles. Owocki & Cohen, Ap.J., 648, 565

8
h = (L 3 / ℓ 2 ) = ℓ /f where h, the ‘porosity length’ is the key parameter; ℓ is the clump size and f is the volume fraction filled by clumps
 = ℓ /f where h, the ‘porosity length’ is the key parameter; ℓ is the clump size and f is the volume fraction filled by clumps")
9
h = (L 3 / ℓ 2 ) = ℓ /f h’ = 0.5 h’ = 1.0 h’ = 2.0 h = h’r Models in the same row have the same effect on x-ray line profiles.
 = ℓ /f h’ = 0.5 h’ = 1.0 h’ = 2.0 h = h’r Models in the same row have the same effect on x-ray line profiles.")
10
h = (L 3 / ℓ 2 ) = ℓ /f f = 0.1 f = 0.2 f = 0.05 Models on the same diagonal have the same effect on other mass-loss diagnostics.
 = ℓ /f f = 0.1 f = 0.2 f = 0.05 Models on the same diagonal have the same effect on other mass-loss diagnostics.")
11
Pup 1 Ori C Chandra spectra of massive stars: survey of trends 1 Ori C: hotter plasma, narrower emission lines Pup (O4 I): cooler plasma, broad emission lines Cohen, IAU Symposium 250, Cambridge Univ. Press, 2008

12
Pup 1 Ori C Si XIII Si XIV Mg XI Mg XII H-like/He-like ratio is temperature sensitive

13
Pup 1 Ori C Si XIII Si XIV The young O star – 1 Ori C – is hotter Mg XI Mg XII

14
Laboratory Astrophysics

15
Creating an X-ray photoionized nebula in the laboratory: Imploding wire array experiments on the Z-machine at Sandia National Laboratory Mike Rosenberg’s (‘08) honors thesis
 honors thesis")
16
Swarthmore Spheromak Experiment: magnetic reconnection in solar and space plasmas Using x-ray and UV spectroscopy to diagnose the plasma temperature and kinematics

17
Vernon Chaplin’s (‘07) honors thesis…and Physics of Plasmas paper.
 honors thesis…and Physics of Plasmas paper.")
18
We calculate model UV/x-ray spectra and compare them to the data collected with various spectrometers in the SSX lab

19
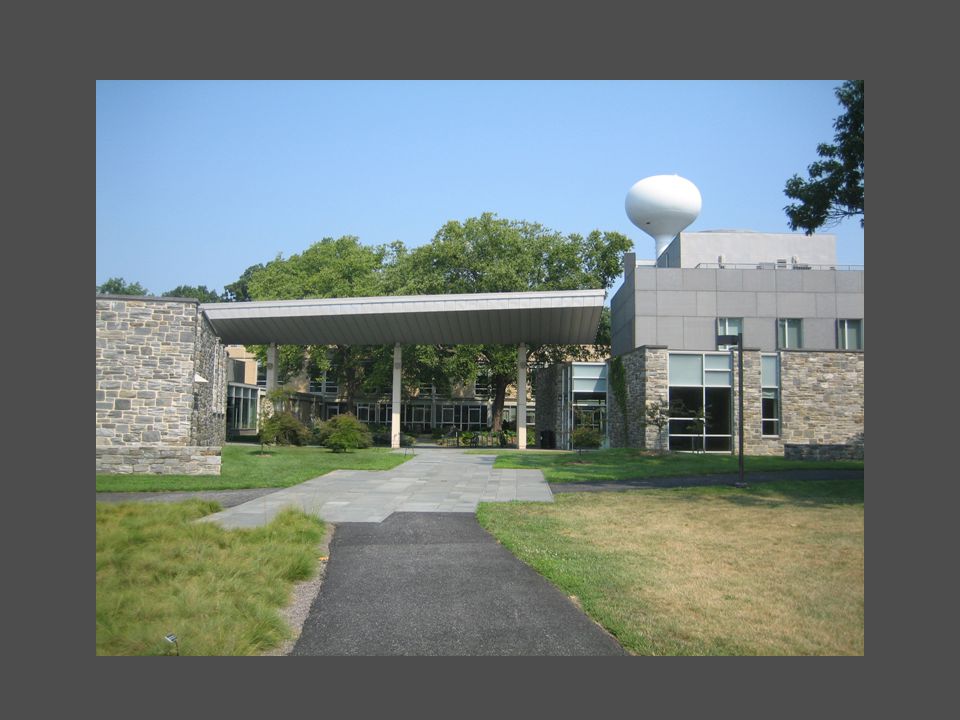
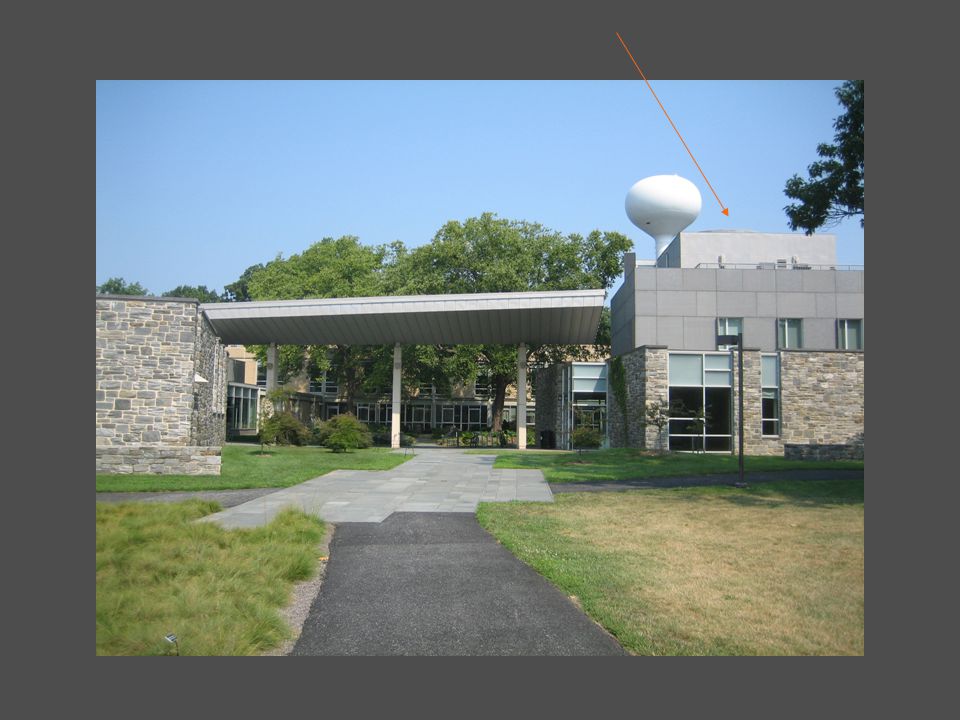
Theoretical modeling: computers, white board Data (mostly high-energy spectroscopy): from space; from the SSX lab (and the Z-machine at Sandia) By next year… optical spectroscopy with our new 24-inch telescope on the roof of the Science Center
: from space; from the SSX lab (and the Z-machine at Sandia) By next year… optical spectroscopy with our new 24-inch telescope on the roof of the Science Center")
25
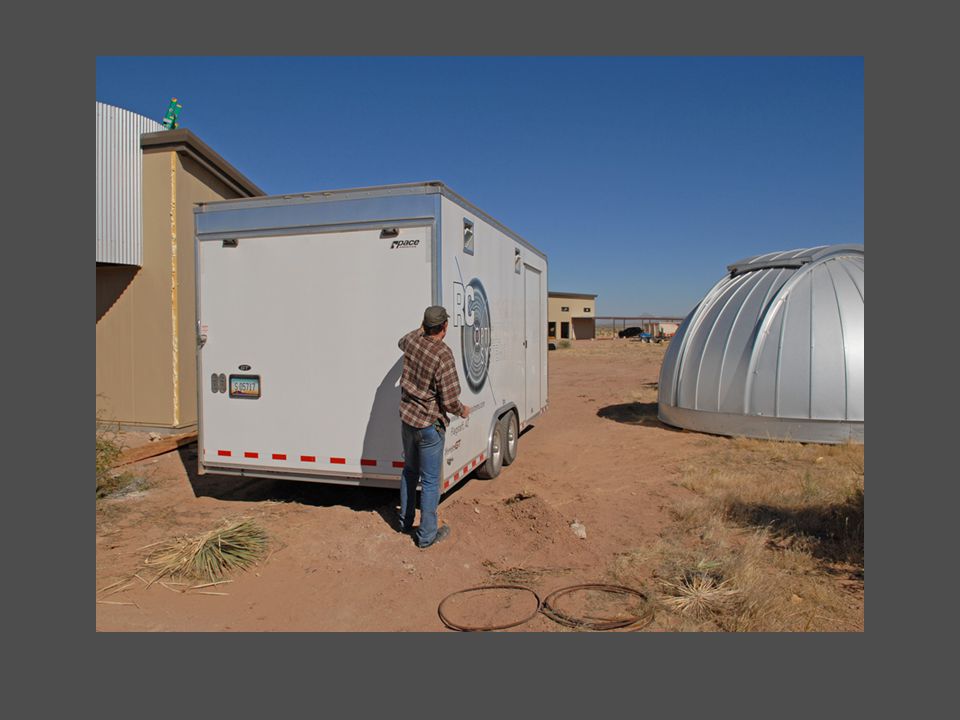
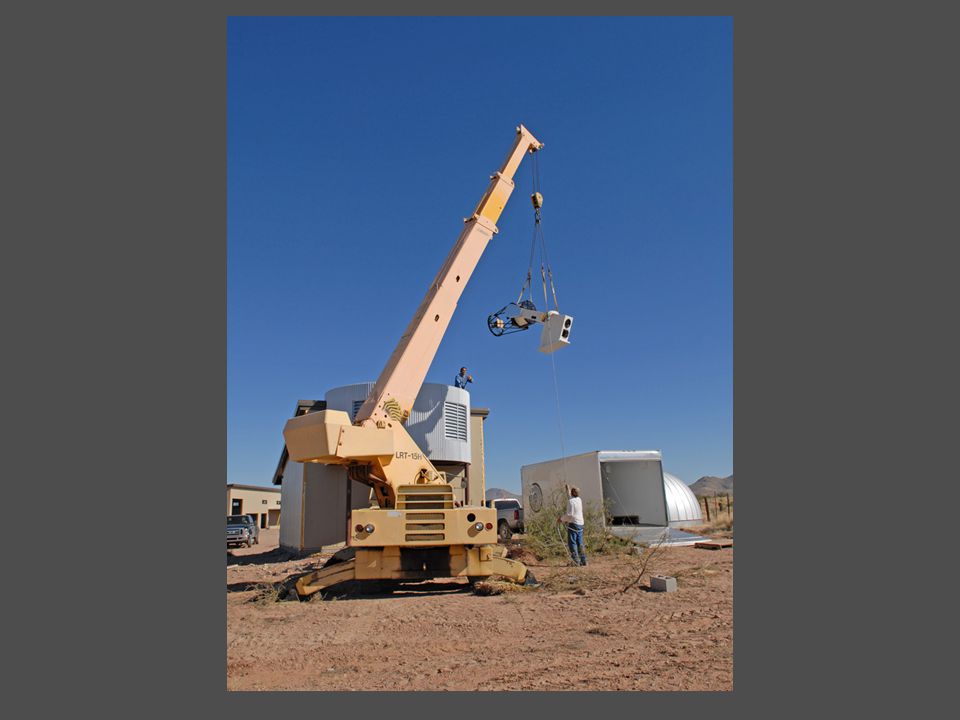
This could be you in summer 2009…but maybe without the flannel shirt.

Similar presentations

 on Solar-B by G. A. Doschek (with contributions from Harry Warren) presented at the STEREO/Solar-B.>")


