Download presentation
Presentation is loading. Please wait.

1
Chandra Emission Line Diagnostics of Sco Carolin N Cardamone Advisor: David Cohen

2
What is the source of the x-rays? Coronal HeatingStellar Wind Shock Heating

3
This feature is resolved into individual emission lines by Chandra. ROSAT Chandra ROSAT data from 1992-4 shows a broad emission feature near 1 keV.

4
Fe XVII lines in Tau Sco

5
A Comparison of the Ne X line in Sco to Capella and Zeta Pup.

6
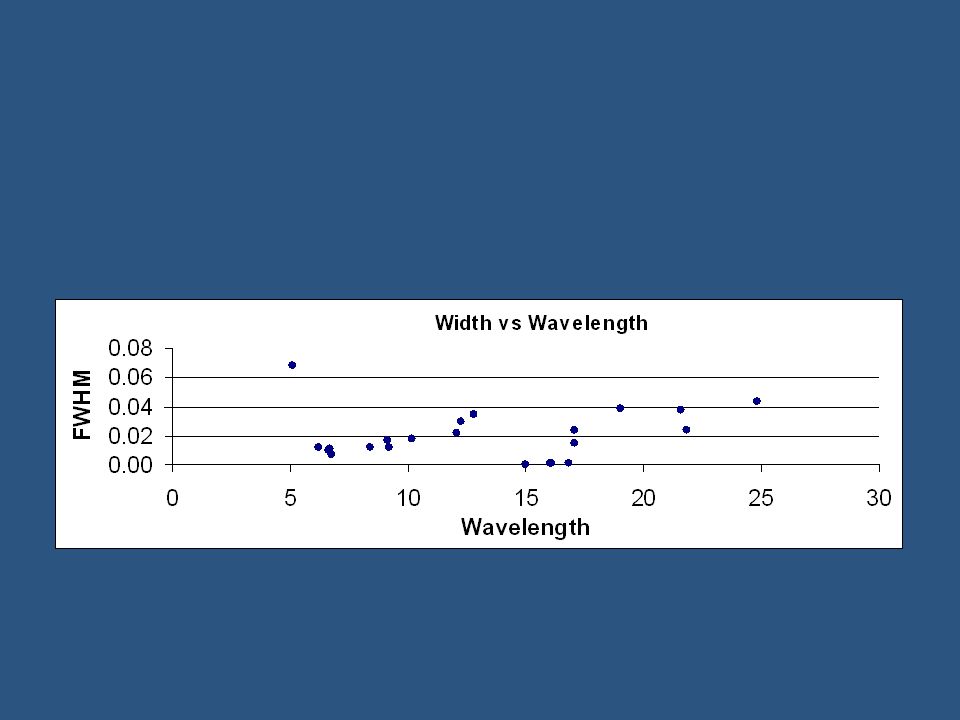
Broad emission lines (large FWHM) are indicative of winds flowing outward from the star. Capella (Coronal)Zeta Pup (Wind?) Line widths indicate velocities.
Zeta Pup (Wind ) Line widths indicate velocities..")
7
Occultation by the star blocks the back (red) side of the wind. We would expect to see mostly blue shifted winds. To earth Line centers indicate bulk motions.

8
ROSAT The line centers are red-shifted. This is a plot of the strongest lines in Sco.

9
ROSAT Conclusions: Line broadening more than thermal seen from coronal sources, less than expected from wind shock. Line broadening more than thermal seen from coronal sources, less than expected from wind shock. Blob infall model (Red-shifted wavelengths) Blob infall model (Red-shifted wavelengths) Hybrid form of wind shock and coronal? Hybrid form of wind shock and coronal?
 Blob infall model (Red-shifted wavelengths) Hybrid form of wind shock and coronal. Hybrid form of wind shock and coronal .")
10
Several Strong lines in Tau Sco

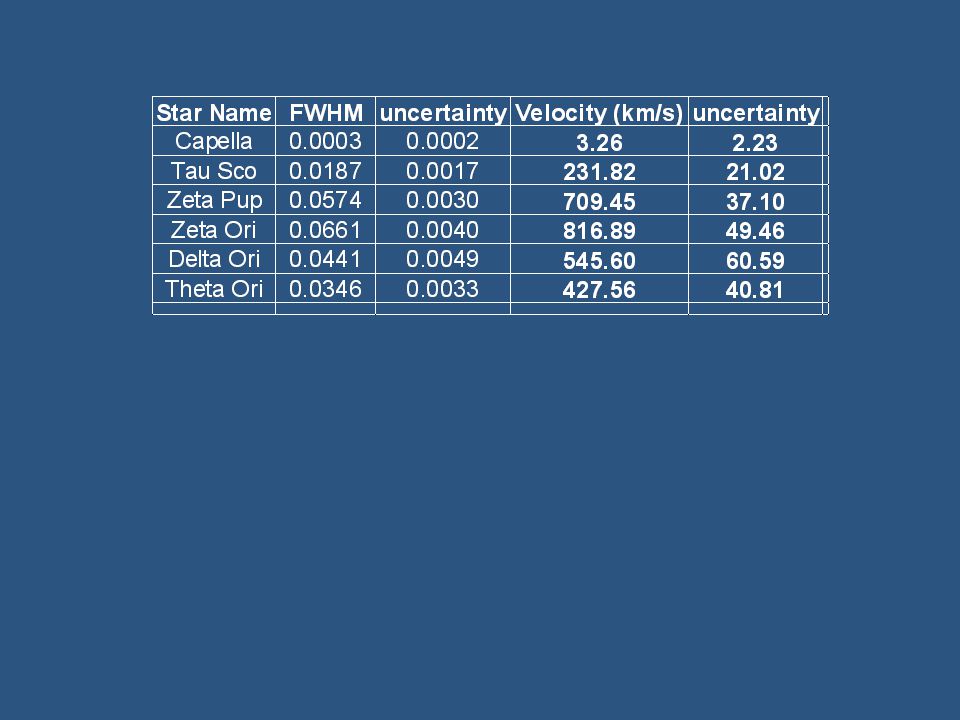
12
Data from the lines of Tau Sco These are the calculated best-fit values found from fitting a Normalized Gaussian plus a Polynomial. Velocities correspond to the half width of the lines This is the temperature required to give the observed width of the line. It assumes width is due entirely to thermal braodening. The predicted fwhm corresponds to the fwhm predicted from a temperature of 10 million degress. Again this assumes width due to thermal broadening. This Amplitude is the total integrated number of counts under the lines, i.e. it is proportional to the line flux.

14
ROSAT Ne X from Tau Sco Overplotted on Capella Tau Sco is slightly wider.

Similar presentations

, ν, Ω S Unknowns: V, T K, N X, M H 2, n H 2 –V velocity field –T K kinetic.>")


>")


 is defined byscaling a basis function P(X i ), shifted by an offset X, to fit a set of data D i with.>")


>")

 ABSTRACT: We present spectral fits for RHESSI and GOES solar.>")

 0.829 Probability of Variability A Large ROSAT Survey.>")
