Download presentation
Presentation is loading. Please wait.

1
IS WRF REALLY IMPROVING? A COMPREHENSIVE VERIFICATION OVER THE PACIFIC NORTHWEST Cliff Mass and David Ovens University of Washington

2
A lot of effort has been expended… We have all worked hard over the past ten years transitioning from MM5 to WRF. In addition, a great deal of effort has gone into improving physics parameterizations, numerics, and adding additional modeling options.

3
But … Does WRF with all its improvements verify better than MM5 for key case studies and over extended verification periods? Do we even have the tools and capabilities to monitoring the evolving quality of our modeling systems? Is it possible that some of the “improvements” have actually detracted from modeling system skill when used with other components?

4
In general, we don’t have satisfactory answers for these questions. Neither NCEP nor DTC nor any national entity appears to have such information. We need the mechanisms and capabilities in place to evaluate and guide our model development

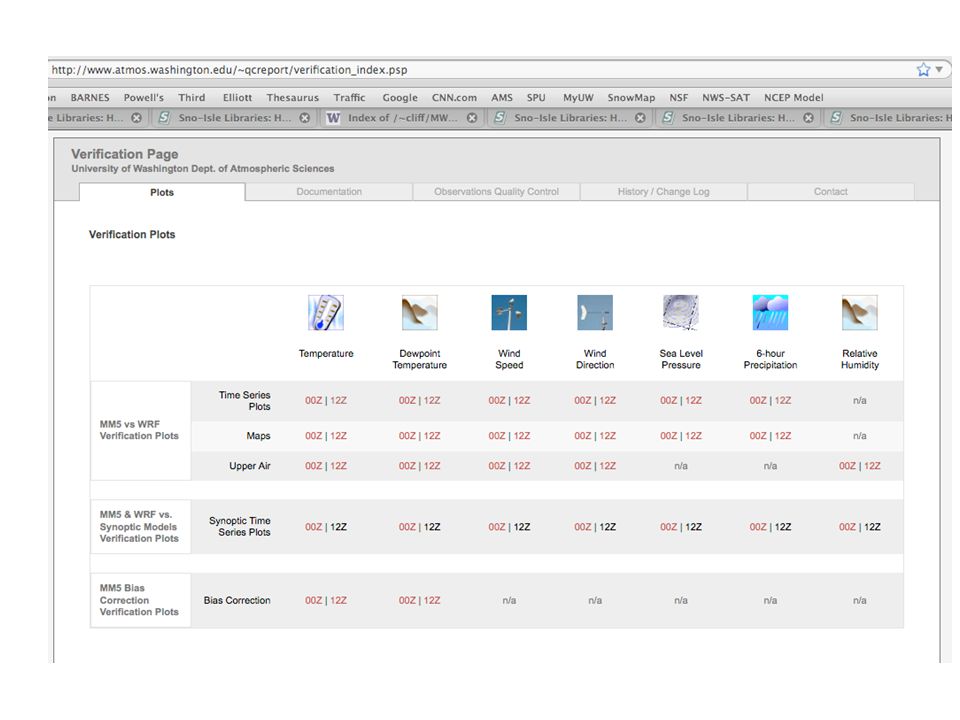
5
What has been the results over the Pacific Northwest where much of this information is available?

6
Northwest U.S. MM5 and WRF Real-time since 1995 Now running: – MM5 (36-12 km) nested in NWS NAM – WRF ARW 3.0 (36-12-4 km) nested in NWS GFS – WRF currently uses Thompson microphysics, YSU PBL, NOAH LSM, RRTM LW, Dudhia SW, K-F PBL – MM5 uses MRF PBL, K-F. Extensive multi-year verification on QC data. Have run extensive tests of WRF V3.1, MM5 driven by GFS, and a collection of varying physics, including with and without LSM
 nested in NWS NAM – WRF ARW 3.0 ( km) nested in NWS GFS – WRF currently uses Thompson microphysics, YSU PBL, NOAH LSM, RRTM LW, Dudhia SW, K-F PBL – MM5 uses MRF PBL, K-F. Extensive multi-year verification on QC data. Have run extensive tests of WRF V3.1, MM5 driven by GFS, and a collection of varying physics, including with and without LSM.")
9
The Analysis Based on this extensive series of runs, let us try to answer (for the NW) the following questions: – What have we gained by moving to WRF? – What have we lost? – What advantages can one realize from V3.1? – Is the NOAH LSM a plus or minus for the key parameters? – Are we making progress?

10
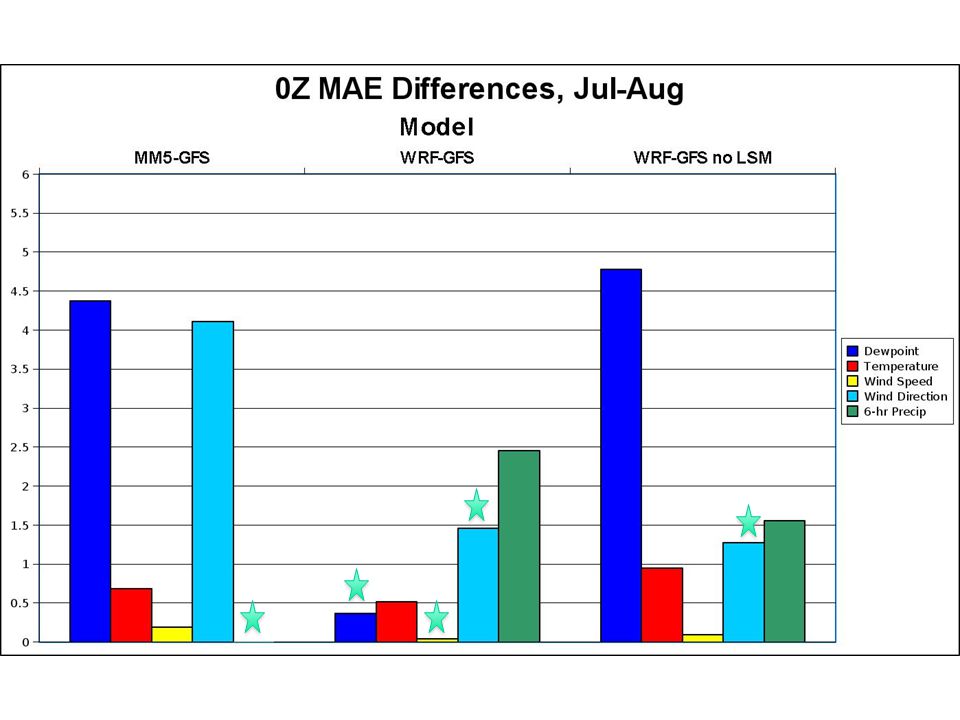
0000 UTC (5 PM) MAE, July-August 2008 With LSM
 MAE, July-August 2008 With LSM")
11
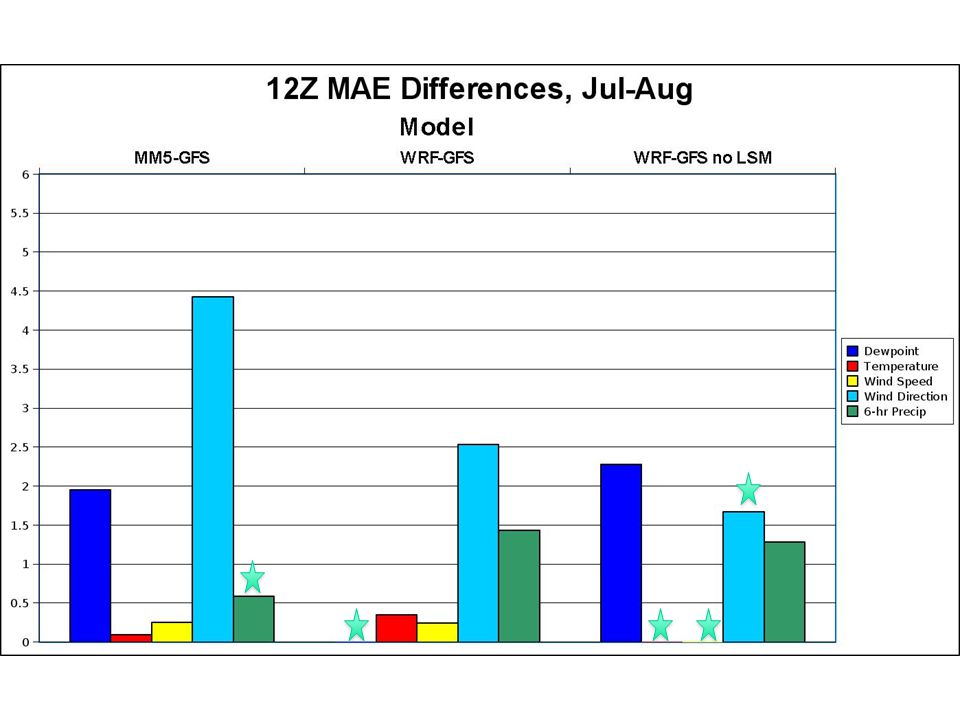
1200 UTC (5 AM) MAE, July-August 2008 With LSM
 MAE, July-August 2008 With LSM")
12
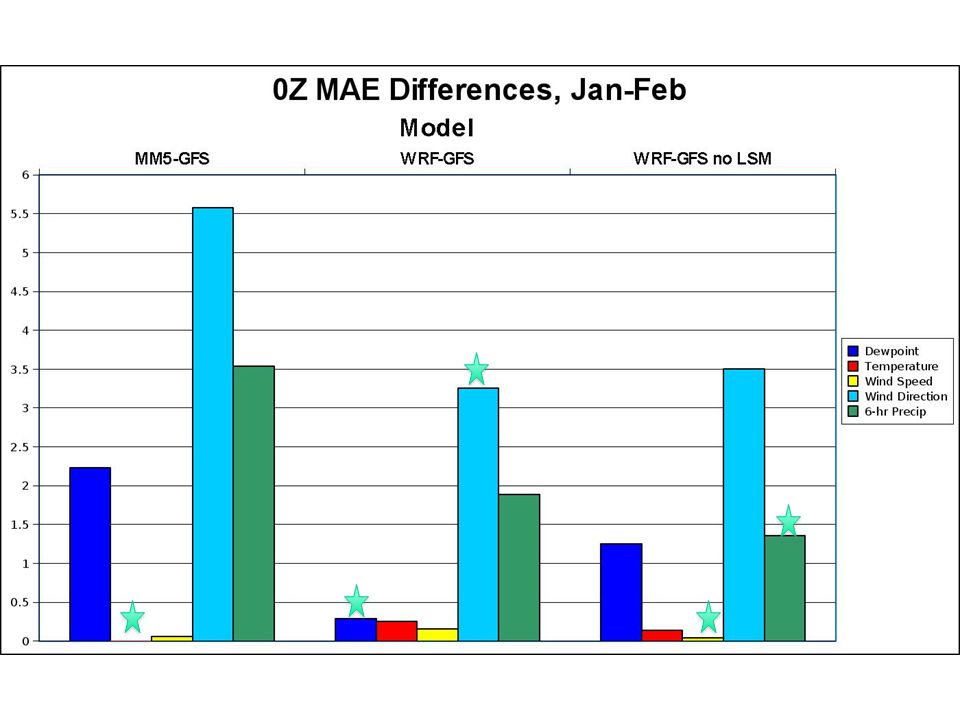
0000 UTC (5 PM) MAE, Jan-Feb 2009 With LSM
 MAE, Jan-Feb 2009 With LSM")
13
1200 UTC (5 AM) MAE, Jan-Feb 2009 With LSM
 MAE, Jan-Feb 2009 With LSM")
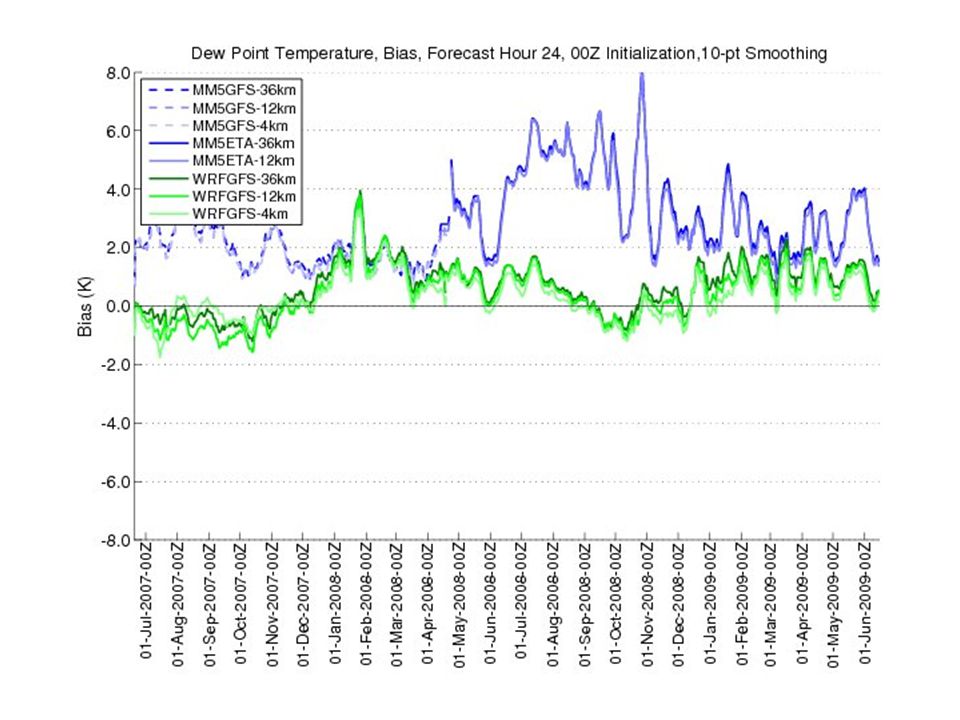
17
What do verification scores tell us about MM5 and WRF? The LSM greatly improves the dewpoint temperature forecast. So WRF with LSM is much better for dewpoint than MM5 without. For temperature, the LSM helps in the afternoon, but hurts in the morning. WRF is better than MM5 for wind direction. For precipitation, summer is better for MM5, winter for WRF. Very little difference in wind speed.

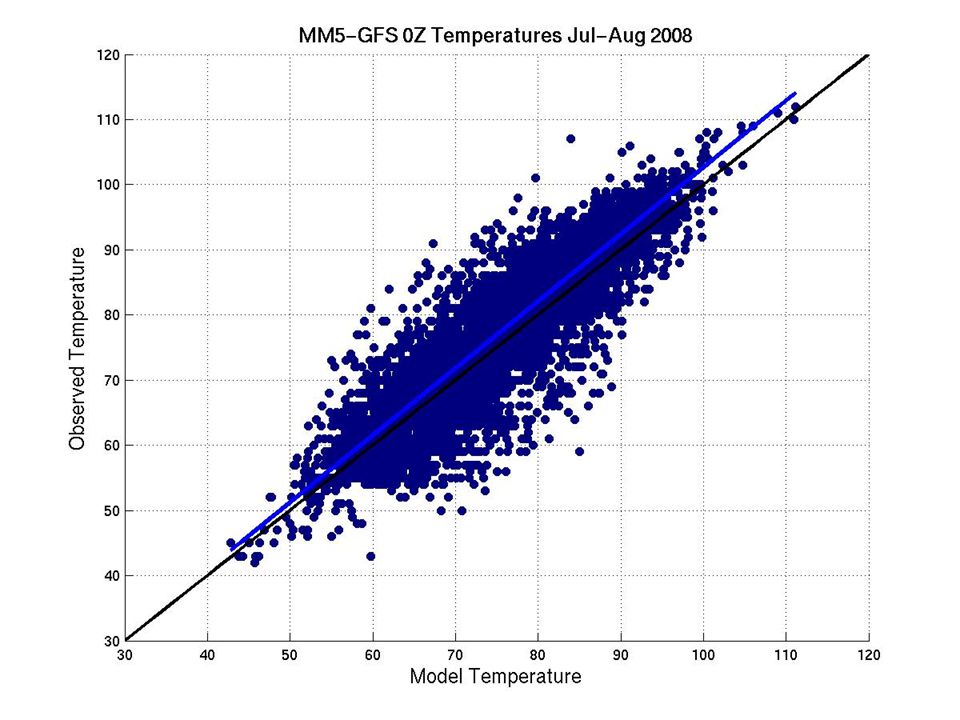
18
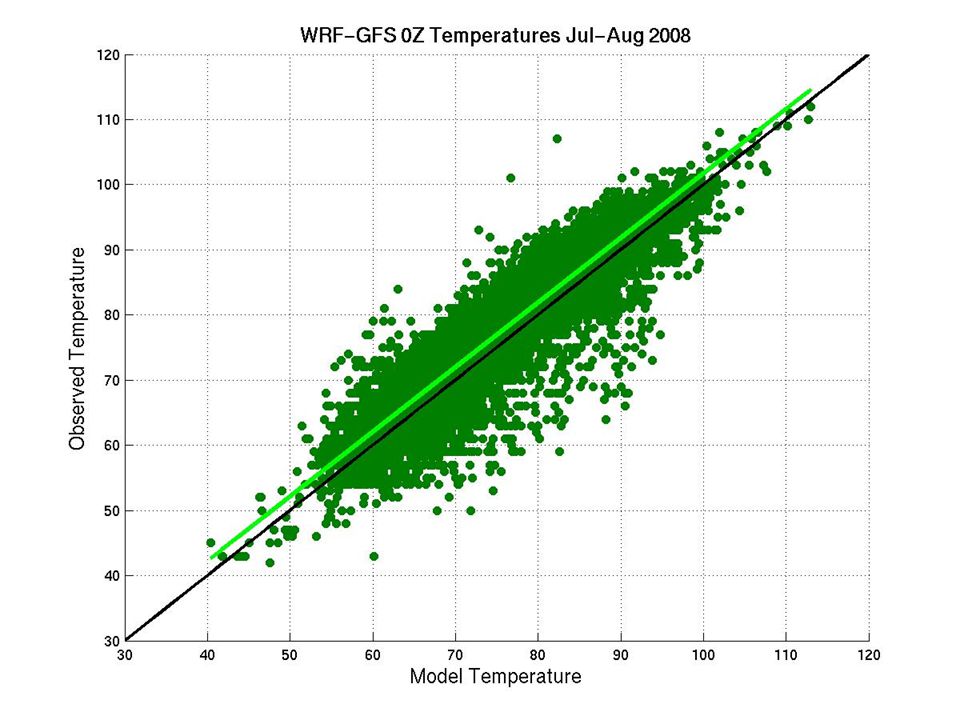
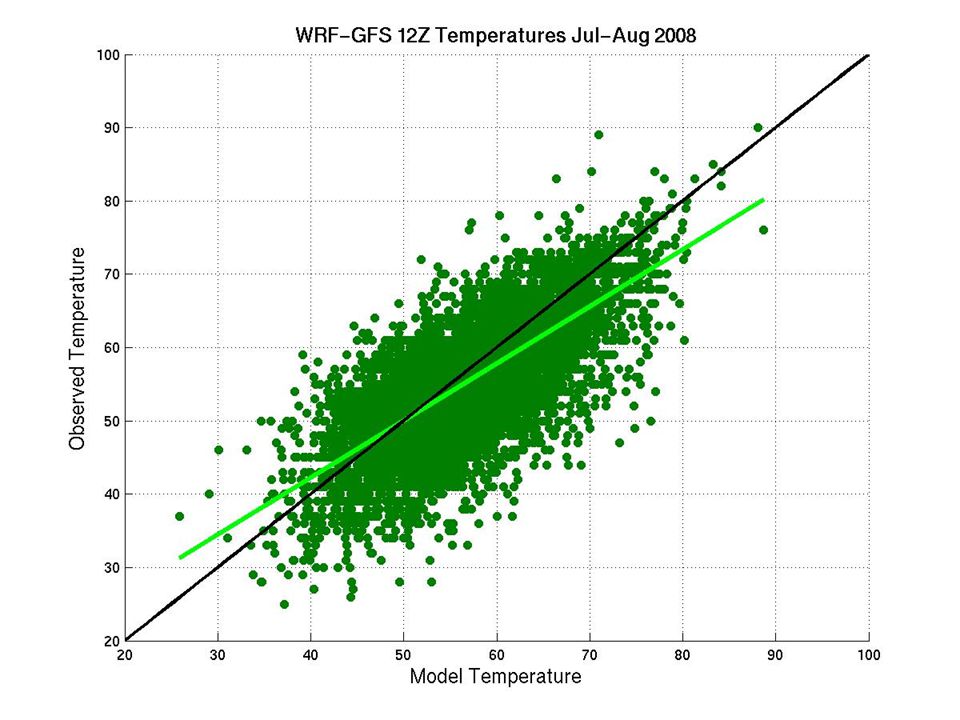
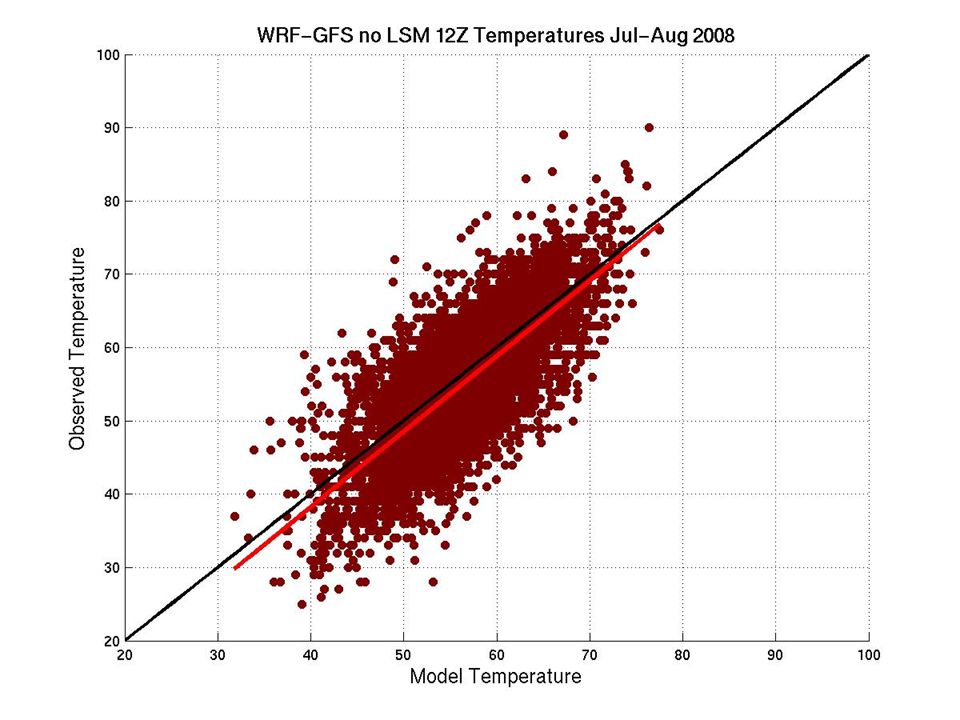
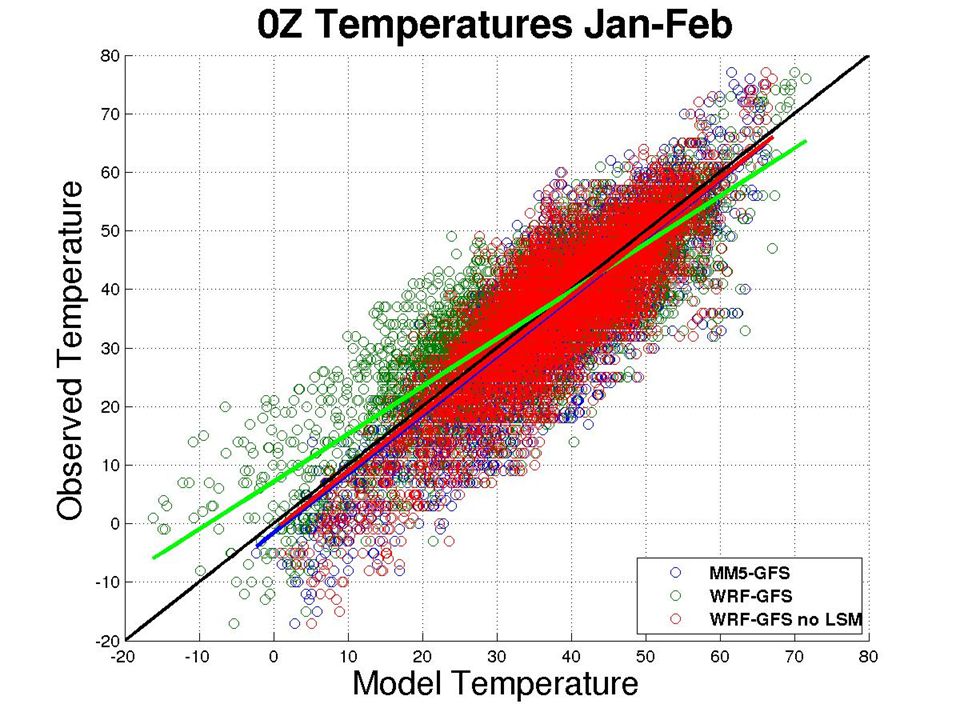
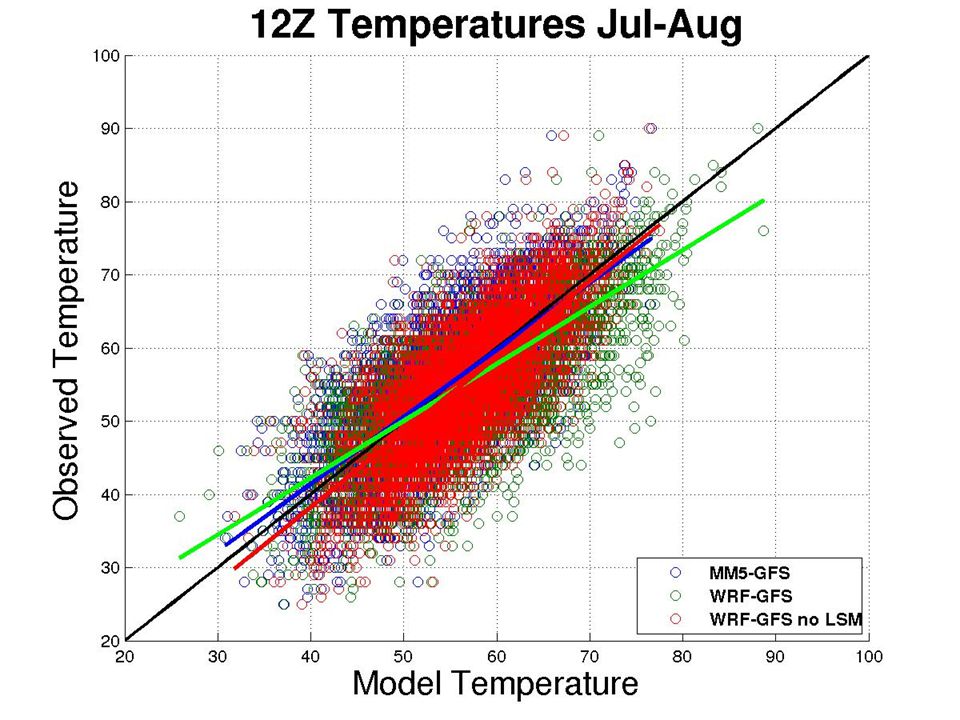
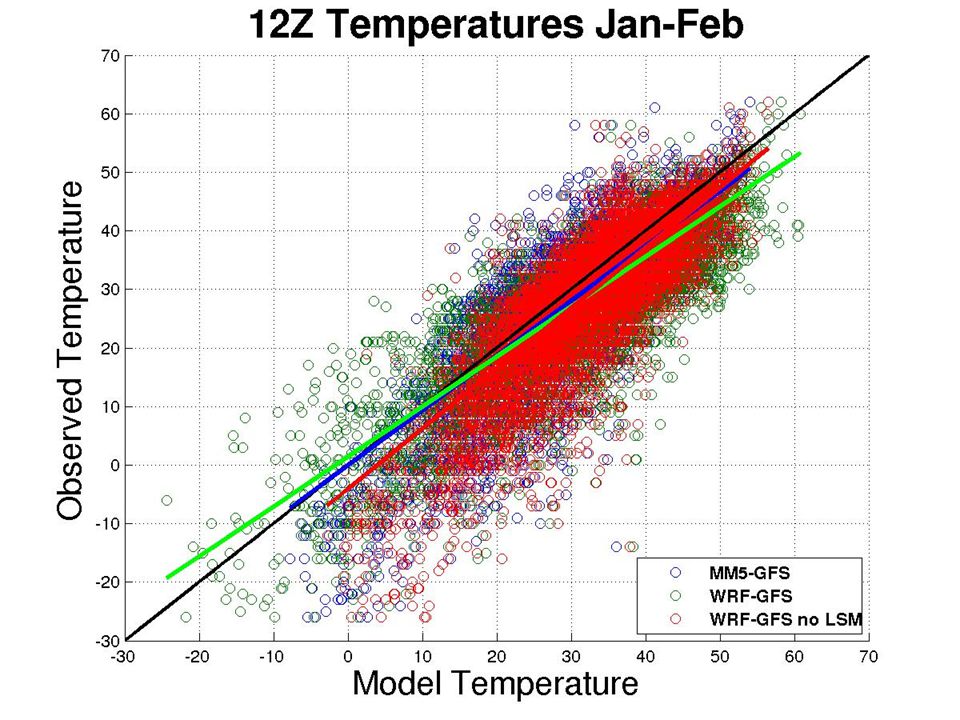
Scatter Diagrams Can Reveal the Subtleties of Model Performance

21
Cold Bias

22
Model Warm Bias for Cold Temps

23
Model Cold Bias

24
Model Warm Bias

31
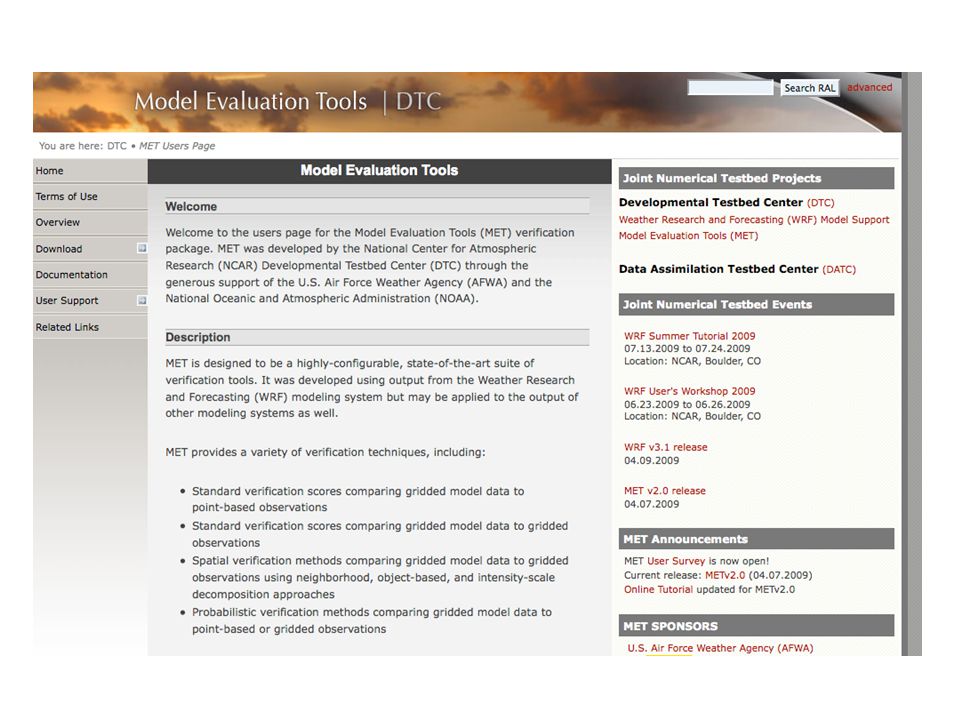
A National Effort for WRF Verification is Required to Guide Our Work We have pieces of the puzzle: The Developmental Testbed Center (DTC) is a natural center for such activities. Powerful verification capabilities have been developed (Model Evaluation Tools, MET) We need a long-term baseline of model performance for “ best combinations” of model physics options or promising option combinations. DTC should take on this key responsibility as an “honest” and unbiased evaluator of model performance.
 We need a long-term baseline of model performance for best combinations of model physics options or promising option combinations. DTC should take on this key responsibility as an honest and unbiased evaluator of model performance..")
34
What do verification scores tell us about WRF? The LSM greatly improves the dewpoint temperature forecast. For temperature, the LSM helps in the afternoon, but hurts in the morning. CAM and the new RRTMG schemes have very similar verification scores.

39
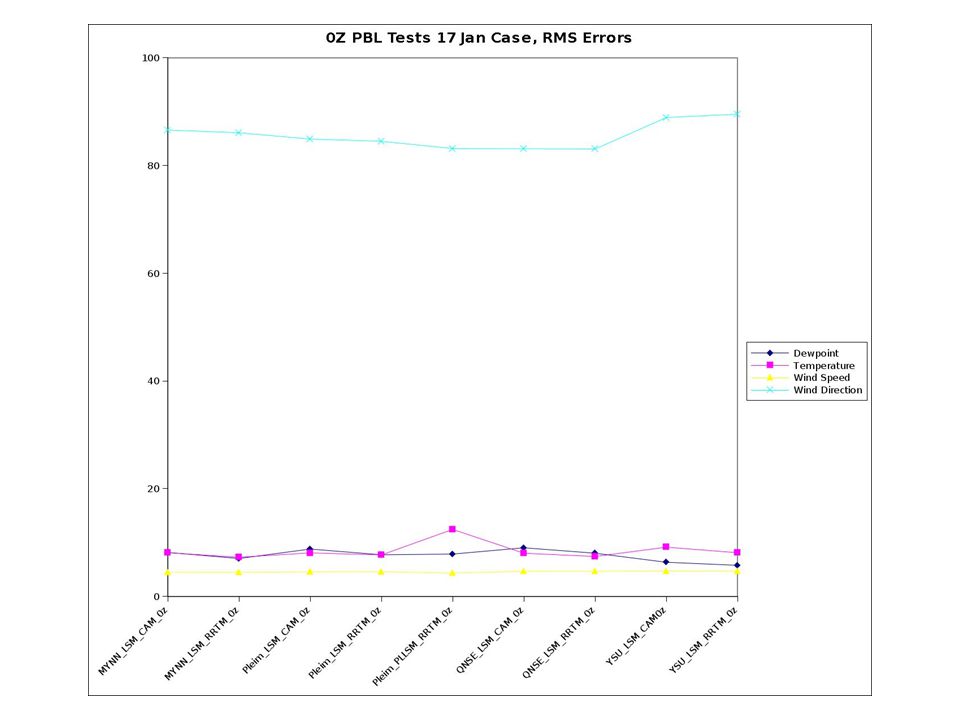
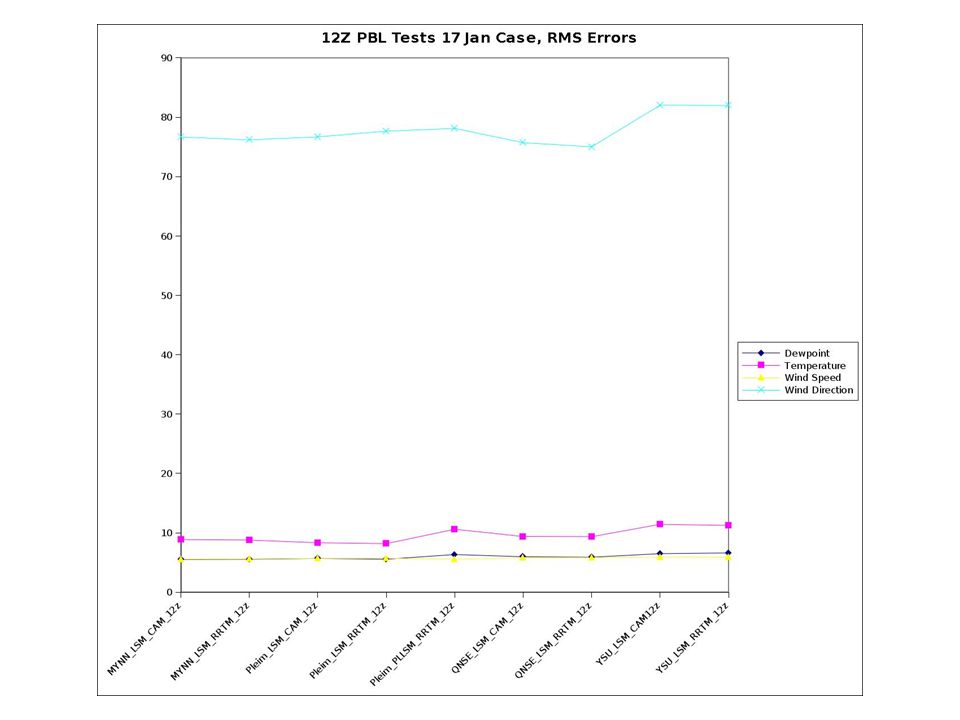
PBL tests with WRF 3.1 3 new PBL schemes (MYNN, QNSE, Pleim-Xiu) have been tested for a stable case, 17-18 Jan 2009. – Our current scheme: YSU = Yonsei University non-local-K scheme with explicit entrainment layer and a parabolic K profile. – MYNN = Mellor-Yamada Nakanishi and Nino Level 2.5 PBL. Predicts sub-grid TKE terms. – QNSE = Quasi-Normal Scale Elimination PBL. A TKE-prediction option that uses a new theory for stably stratified regions. – Pleim-Xiu = Asymmetric Convective Model with non-local upward mixing and local downward mixing. – BouLac = Bougeault-Lacarrere PBL (new in 3.1, not yet tested) designed for use with BEP urban model.
 designed for use with BEP urban model..")
40
PBL tests with WRF 3.1 The LSM is a bigger contributor to temperature errors than the PBL schemes. – No obvious improvement has been noted. – Further tests and analysis is needed.

43
Cases without LSM compared to the case with the best 2-m temperature score.

44
LSM with best 2-m Temperature

45
Cases without LSM compared to the case with the best 2-m temperature score.

46
LSM with best 2-m Temperature

47
2-m Temperatures, LSM vs no LSM LSMNo LSM

48
2-m Temperatures, LSM vs no LSM LSMNo LSM

49
Some Conclusions LSM greatly improves dewpoint temperature forecasts. LSM improves maximum temperature forecasts, but degrades minimum temperature forecasts.

50
LSMNo LSM

51
LSMNo LSM

52
LSMNo LSM

53
LSMNo LSM

54
PBL tests with WRF 3.1 3 new PBL schemes (MYNN, QNSE, Pleim-Xiu) have been tested for a stable case, 17-18 Jan 2009. – Our current scheme: YSU = Yonsei University non-local-K scheme with explicit entrainment layer and a parabolic K profile. – MYNN = Mellor-Yamada Nakanishi and Nino Level 2.5 PBL. Predicts sub-grid TKE terms. – QNSE = Quasi-Normal Scale Elimination PBL. A TKE-prediction option that uses a new theory for stably stratified regions. – Pleim-Xiu = Asymmetric Convective Model with non-local upward mixing and local downward mixing. – BouLac = Bougeault-Lacarrere PBL (new in 3.1, not yet tested) designed for use with BEP urban model.
 designed for use with BEP urban model..")
55
PBL tests with WRF 3.1 The LSM is a bigger contributor to temperature errors than the PBL schemes. – No obvious improvement has been noted. – Further tests and analysis is needed.

58
Cases without LSM compared to the case with the best 2-m temperature score.

59
LSM with best 2-m Temperature

60
Cases without LSM compared to the case with the best 2-m temperature score.

61
LSM with best 2-m Temperature

62
2-m Temperatures, LSM vs no LSM LSMNo LSM

63
2-m Temperatures, LSM vs no LSM LSMNo LSM

64
Some Conclusions LSM greatly improves dewpoint temperature forecasts. LSM improves maximum temperature forecasts, but degrades minimum temperature forecasts.

70
LSMNo LSM

71
LSMNo LSM

72
LSMNo LSM

73
LSMNo LSM

74
LSMNo LSM

75
LSMNo LSM

76
LSMNo LSM

77
LSMNo LSM

Similar presentations


 Research Applications Laboratory (RAL) and Developmental Testbed.>")


 km_opt ignored.>")


 Full range of products available at:>")


