Download presentation
Presentation is loading. Please wait.

1
1 Lecture One Econ 240C

2
2 Outline Pooling Time Series and Cross- Section Review: Analysis of Variance –one-way ANOVA –two-way ANOVA Pooling Examples

3
3 Pooling Often you may have data sets vary both across individuals and also over time. For example, you may have macro data such as GDP but for several countries. You could analyze this data country by country, but it is also possible to pool the data and analyze it jointly rather than individually.

4
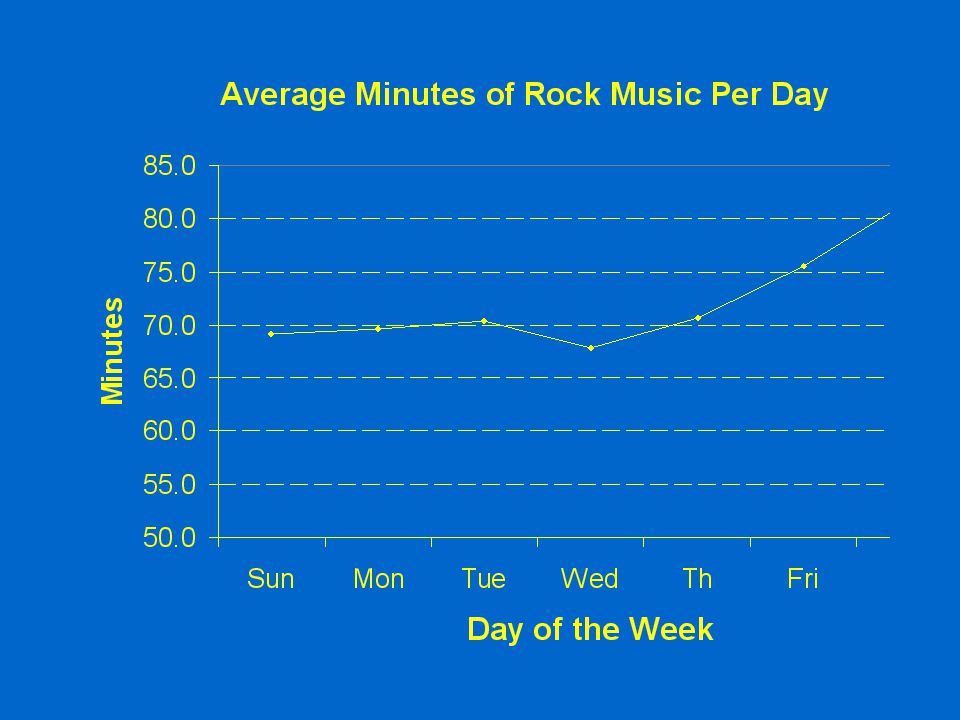
4 The Rock Music Data In this data, individual teenagers are polled about how many minutes of rock music they listen to per day for each of the seven days of the week. There is variation across individual teenagers there is variation for a single teenager over time, i.e. the days of the week

5
5 Example: Rock Music Data Teen Sun.Mon.Tue.Wed.Th.Fri.Sat. 1654032486075110 29085759078120100 330302025306070 4725266100776694 570884773786778 6905110341576987 743726639579073 88889829568105125 9966080106578180 1060927245727790

7
7 One Way ANOVA Across Days of the Week

9
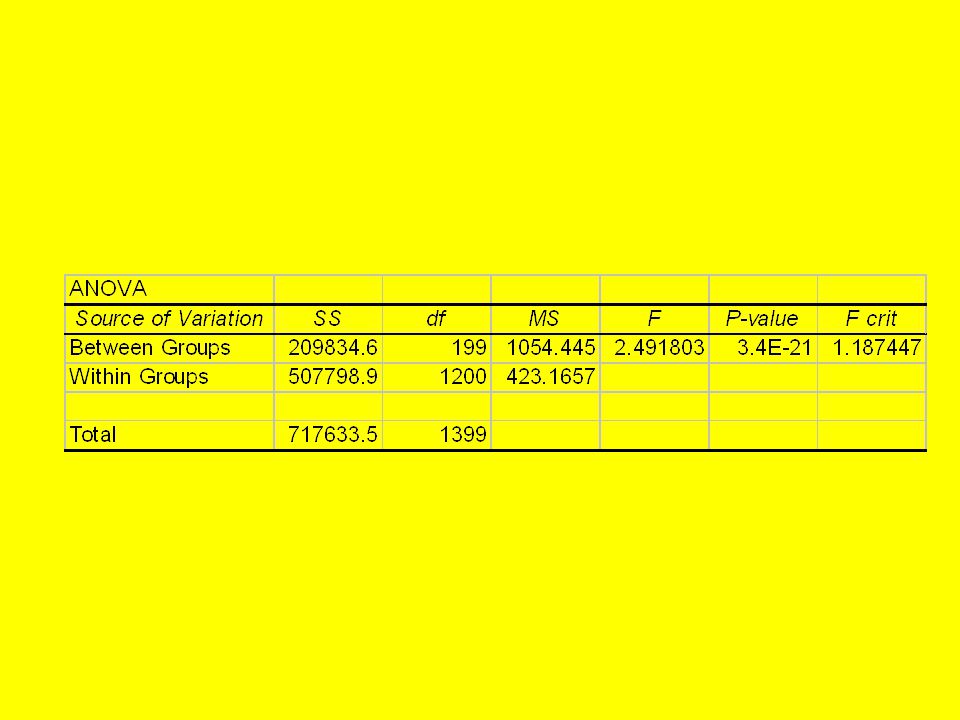
9 One Way ANOVA Across 200 Teenagers

10
Selection: First Ten Teenagers

12
12 Two-Way ANOVA Across both Days and Teens Controlling for both sources of variation reduces the unexplained sum of squares, “within groups” in EXCEL-speak, and hence makes the variation for days of the week and/or for teenagers, more significant since the F-statistic depends on the ratio of explained sum of squares to unexplained sum of squares and the latter is smaller per above.

13
Two-way ANOVA

14
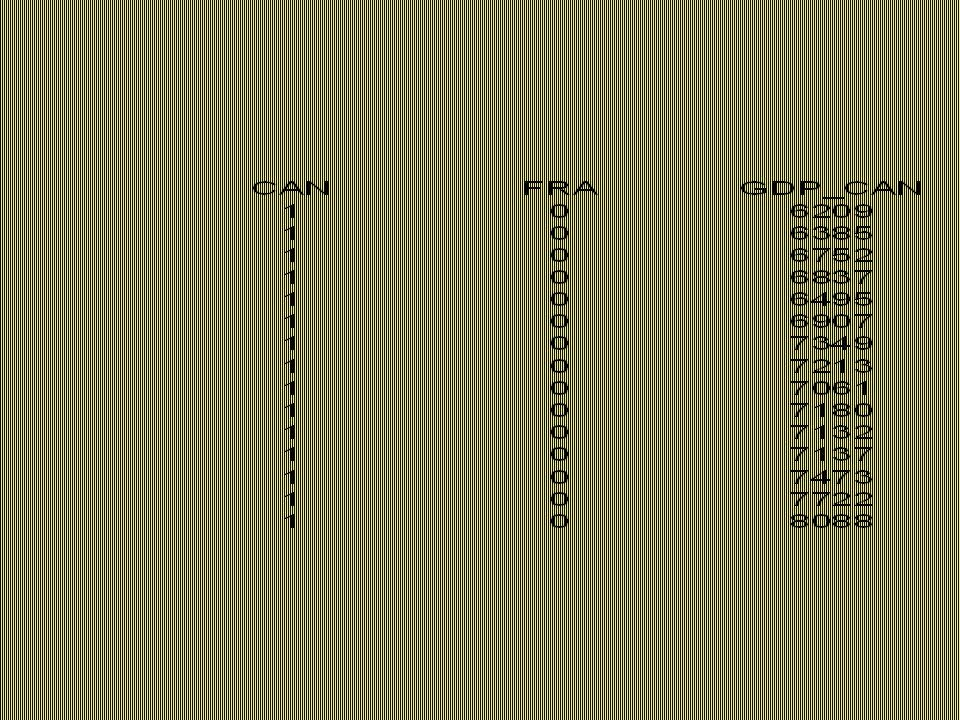
14 Stacked Regressions GDP for two countries Canada and France, 1950-1992 Estimating time trends: GDP i (t) = c i + d i t + e i, Note, on next slide, that there is a separate intercept for Canada, CAN that is one when the data is Canadian and zero when the data is French. Ditto for time and GDP

16
16 Stacked Data Separate intercepts can be typed in as well as separate time trends, but this becomes more laborious for 7 countries than for two. Pooling is a process in Eviews for automating stacked regressions

17
17 A Stacked Regression Time Trend (GDP_CAN + GDP_FRA) = c CAN CAN + d CAN TIME_CAN + c FRA FRA + d FRA TIME_FRA
 = c CAN CAN + d CAN TIME_CAN + c FRA FRA + d FRA TIME_FRA")
18
Dependent Variable: GDPSTACKED Method: Least Squares Sample: 1 86 Included observations: 86 Variable CoefficientStd. Errort-StatisticProb CAN4899.908183.341326.725620 FRA3804.796183.341320.752540.0000 TIME_CAN295.6356 7.51625939.332810.0000 TIME_FRA257.8192 7.51625934.301540. R-squared 0.973 Mean dependent var10163. Adjusted R-squared 0.972S.D. dependent var3640.218 S.E. of regression 611.6406 Akaike info criterion15.71556 Sum squared resid3067654 Schwarz criterion15.82972 Log likelihood-671.769 Durbin-Watson stat0.296751

19
19 Stacked Regression Results Note the intercept for Canada is 4899.908 with a standard error of 183.3; the time trend is 295.6356 with a standard error of 7.51; What would result if we estimated each country separately, as illustrated for Canada on the next slide. The estimated intercept and slope is the same but the standard errors are larger and t-stats lower.

20
Dependent Variable: GDP_CAN Method: Least Squares Sample: 1 43 Included observations: 43 Variable CoefficientStd. Errort-StatisticProb. CAN4899.908228.282621.464220.0000 TIME_CAN 295.6356 9.35867531.589470.0000 R-squared 0.960535 Mean dependent var11108.26 Adjusted R-squared 0.960 S.D. dependent var3787.652 S.E. of regression761.568 Akaike info criterion16.15403Sum squared resid23779447 Schwarz criterion16.23595 Log likelihood-345.3117 Durbin-Watson stat0.263534

21
21 Pooling in EViews So that is the motivation for pooling and in Lab One on Wednesday we will learn how to accomplish pooling using Eviews.

Similar presentations


 Method: Least Squares Sample (adjusted): 1960 2003 Included observations: 44 after adjustments.>")
 Slideshow: tests of nonstationarity: example and further complications Original.>")


 White noise input output Random walkSynthesis 1/(1 – bz) White noise input output.>")


