Download presentation
Presentation is loading. Please wait.

1
Project One Fall 2008

2
II a: plot

3
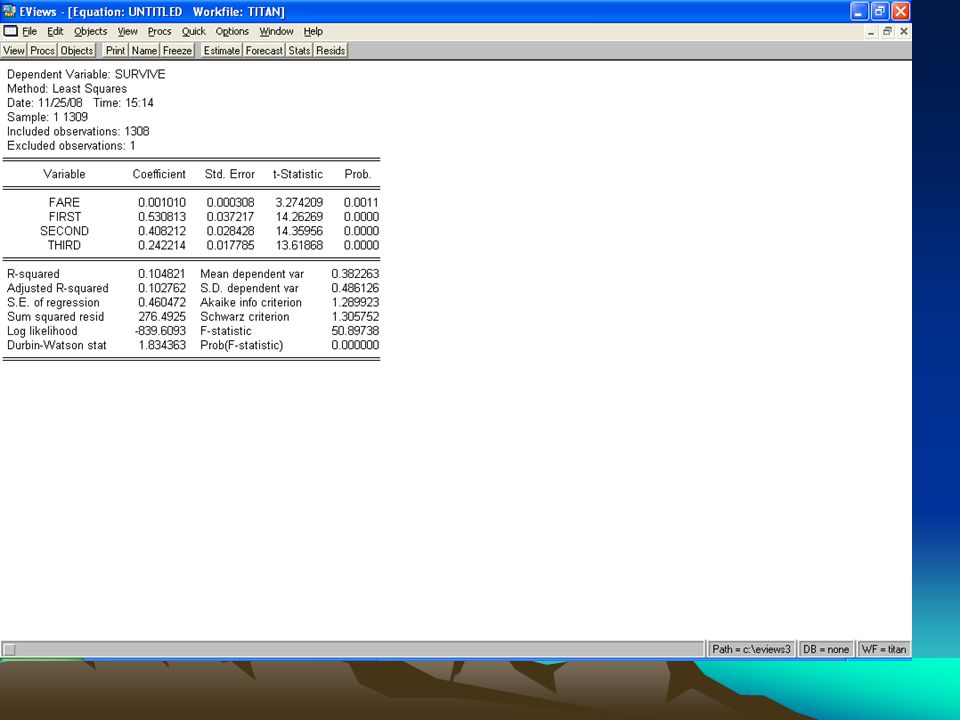
IIb: Survive = a + b*female + c*fare + e i. Is regression statistically significant?, yes, F-stat & probability ii. Interpret constant term when female and fare are zero: intercept for male iii. Is coefficient on fare statistically significant? Yes, t-stat and probability iv. Interpret the coefficient on fare: Probability of survival increases by 0.14 for every 100 £ v. Is the constant term significantly different from coefficient on female?

4
Estimation Command: ===================== LS SURVIVE FARE FEMALE C Estimation Equation: ===================== SURVIVE = C(1)*FARE + C(2)*FEMALE + C(3) Substituted Coefficients: ===================== SURVIVE = 0.001422273828*FARE + 0.5077490703*FEMALE + 0.1540123972 View menu in Equation window: representations
*FARE + C(2)*FEMALE + C(3) Substituted Coefficients: ===================== SURVIVE = *FARE *FEMALE View menu in Equation window: representations")
5
View menu: Coefficient tests, Wald Wald Test: Equation: Untitled Null Hypothesis:C(1)=C(2) F-statistic447.5543Probability0.000000 Chi-square447.5543Probability0.000000
=C(2) F-statistic Probability Chi-square Probability")
6
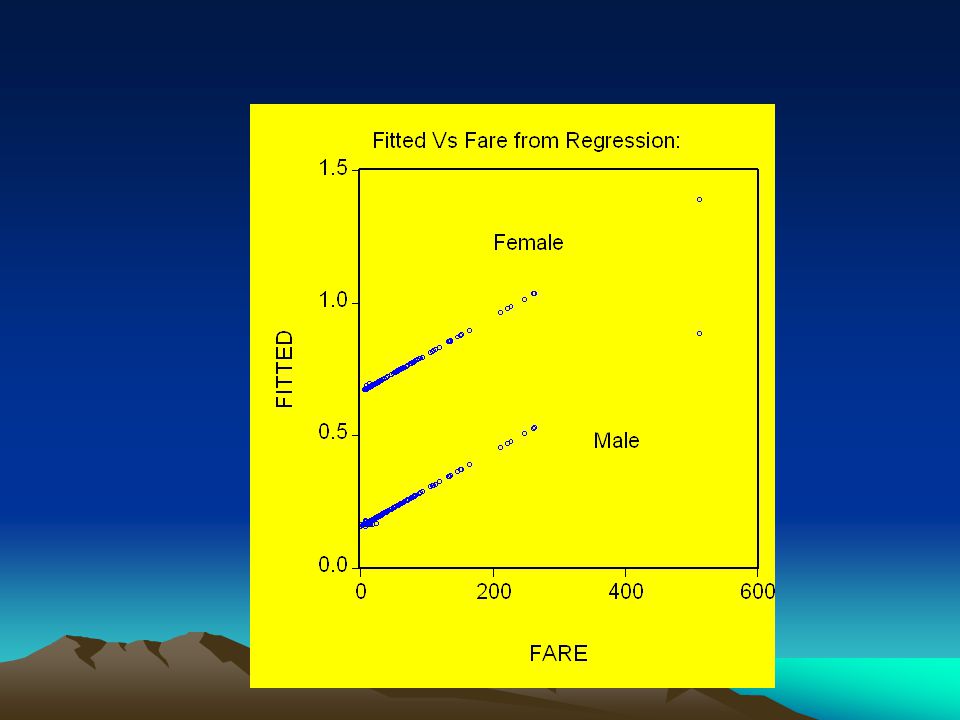
IIc. Plot the fitted value of survive Vs. Fare: View Menu, Actual, Fitted, Residual Table

7
Select fare and Fitted and from Quick menu, Graph: scatter diagram

10
Confusing without labels

11
2d. Add age to the regression 2e: is it women and children first?

12
Investigating Class Class variable: 1, 2, 3 Genr first = 1*(class=1) + 0*(class>1) Genr third = 1*(class=3) + 0*(class<3) Genr second = 1-first-second
 + 0*(class>1) Genr third = 1*(class=3) + 0*(class<3) Genr second = 1-first-second")
14
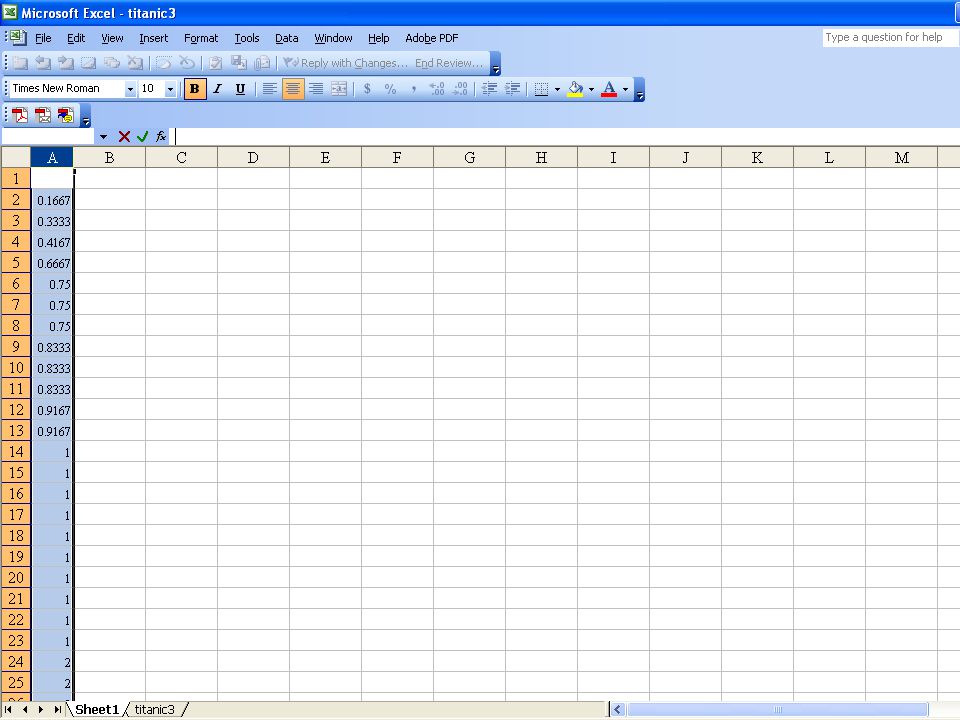
View: actual …, select & copy fitted

15
Regression: Survive vs. “class” & fare

16
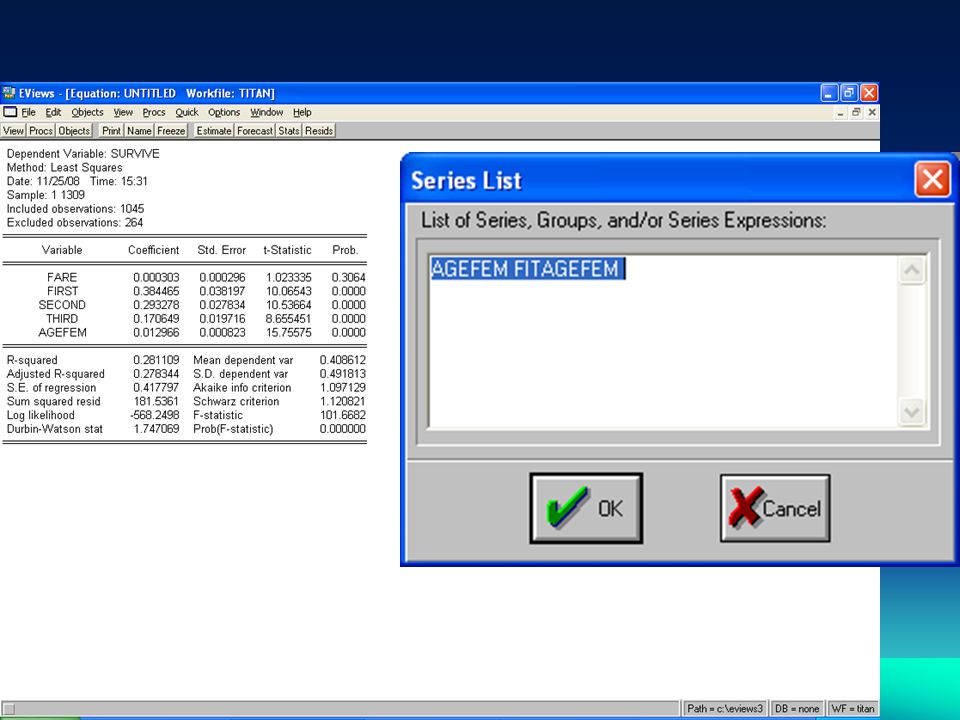
Investigate Age and Gender Agefem=age*female

17
Plot of Survive Vs. Age for Females

18
Regression

20
Regression: survive Vs. “class”, fare, Age of female

21
Babies

22
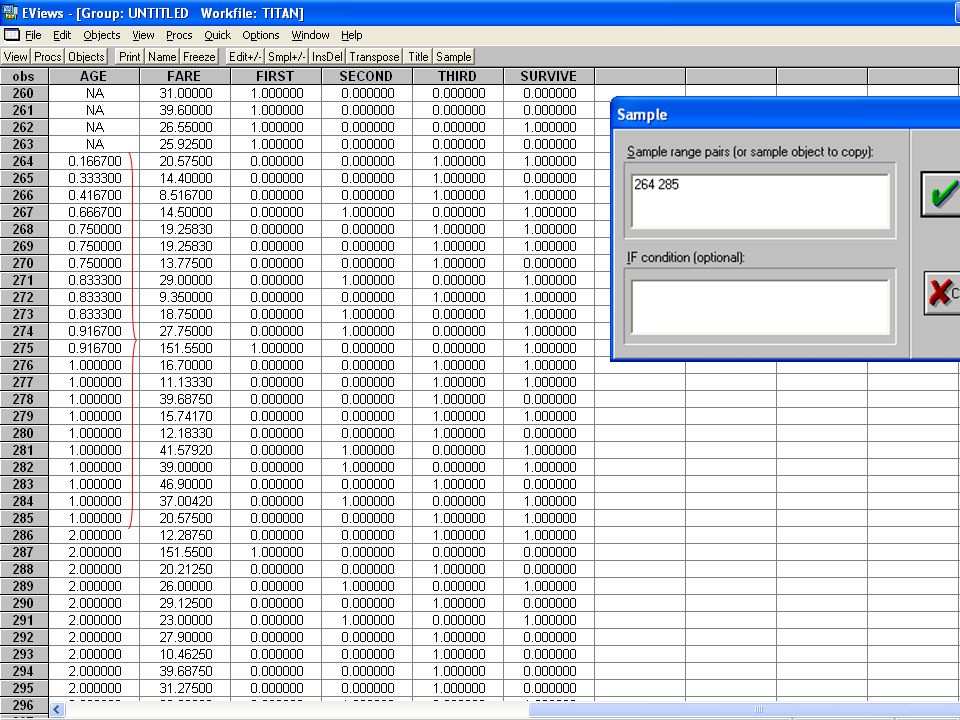
Sort on Babies: Procs

24
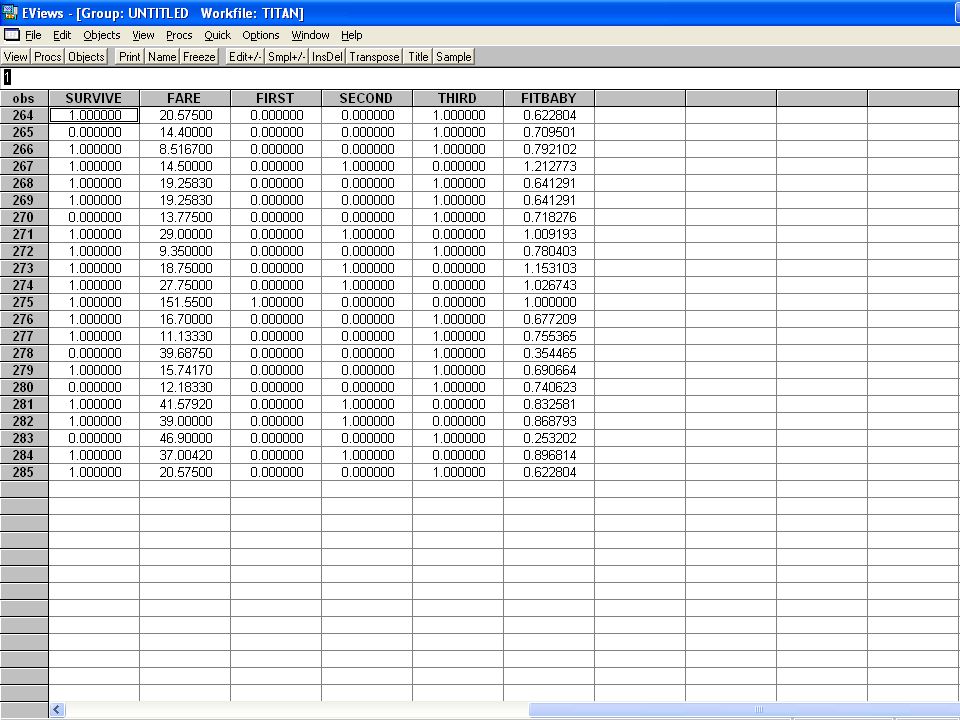
Infants

Similar presentations


>")


