Download presentation
Presentation is loading. Please wait.

1
ADVANCES IN MONITORING METHODS FOR AIRBORNE PARTICLES Philip K. Hopke Department of Chemical Engineering, Clarkson University, Potsdam, NY 13699-5705 USA hopkepk@clarkson.edu

2
Air Quality Standards In 1997, the U.S. Environmental Protection Agency promulgated new National Ambient Air Quality Standards (NAAQS) for airborne particulate matter. –New standards were established for PM 2.5 –Revised standards were set for PM 10
 for airborne particulate matter. –New standards were established for PM 2.5 –Revised standards were set for PM 10.")
3
Air Quality Standards The PM 2.5 standards were set as: –Annual arithmetic average standard 15 µg m -3 Averaged over three years –Each quarter must have 75% collection –Quarterly averages are averaged over the 3 years Value >15.1 µg m -3 is in non-attainment.

4
Air Quality Standards The PM 2.5 standards were set as: –24-Hour standard 65 µg m -3 98 th Percentile Standard based on 3-years of data –Determine the 98 th percentile value for each of the three years –Average these three values –If it is greater than 66 µg m -3, the site is in non-attainment

5
Air Quality Standards The PM 2.5 standards were set to be: Measured with a standard design Federal Reference Method sampler Samplers deployed based on population density Measurements at least every third day Teflon filters –Equilibrated and weighed prior to and after exposure.

6
Air Quality Standards The PM 10 standards were set to be: –Maintain the 1987 annual arithmetic mean value of 50 µg m -3 –Set a new 24-hour standard of 150 µg m -3 which is the same as the 1987 value, but now as the 99 th percentile value –Three years of data needed as in the PM 2.5 standard

7
Air Quality Standards Lawsuit was filed against the Administrator by the American Truckers Associations with a number of co- plaintiffs Alleged that the EPA had exceeded their authority by creating the PM 2.5 standard as well as raising a number of points with respect to the new 8-hour O 3 standard that was also promulgated in 1997.

8
Air Quality Standards The PM 10 NAAQS was promulgated to protect public health from coarse particles that would not be part of PM 2.5, The suit alleged PM 10 to be illegal since it included PM 2.5 and the effects of the two cannot be adequately separated. PM 10 is thus not an effective indicator of coarse particle exposure

9
Air Quality Standards A 3 judge panel of the Court of Appeals for the Third Circuit (Washington, DC) upheld the entire suit by a 2 to 1 majority EPA chose to contest the decision except for the part of regarding the invalidation of the PM 10 standard.
 upheld the entire suit by a 2 to 1 majority EPA chose to contest the decision except for the part of regarding the invalidation of the PM 10 standard.")
10
Air Quality Standards The Supreme Court found for the EPA and remanded the case back to the Court of Appeals with specific instructions regarding the outcome The Court of Appeals then dismissed all of the remaining parts of the suit.

11
Air Quality Standards Thus, at this time the NAAQS in the United States include the –1997 PM 2.5 standard (both annual average and 24-hour standards). –1997 eight-hour ozone standard –1987 PM 10 NAAQS remains in effect since it was not part of the lawsuit and thus, is not affected –However, a new coarse particle standard will be set in this round of NAAQS review.

12
PM 2.5 Monitoring Program & PM2.5 Program Objectives: Why Monitor? & Comparison With Air Quality Standards & Development of Emission Control Strategies & Support Modeling & Emissions & Continued Assessment of Strategies and Trends & Public Awareness & Research On: & Atmospheric Processes and Emissions & Source-Receptor Relationships & Health Effects/Exposure

13
Supersites Mass Monitoring Network >1100 Sites 7 sites 300 State Sites + 150 IMPROVE Speciation Network EPA PM 2.5 Monitoring Network

14
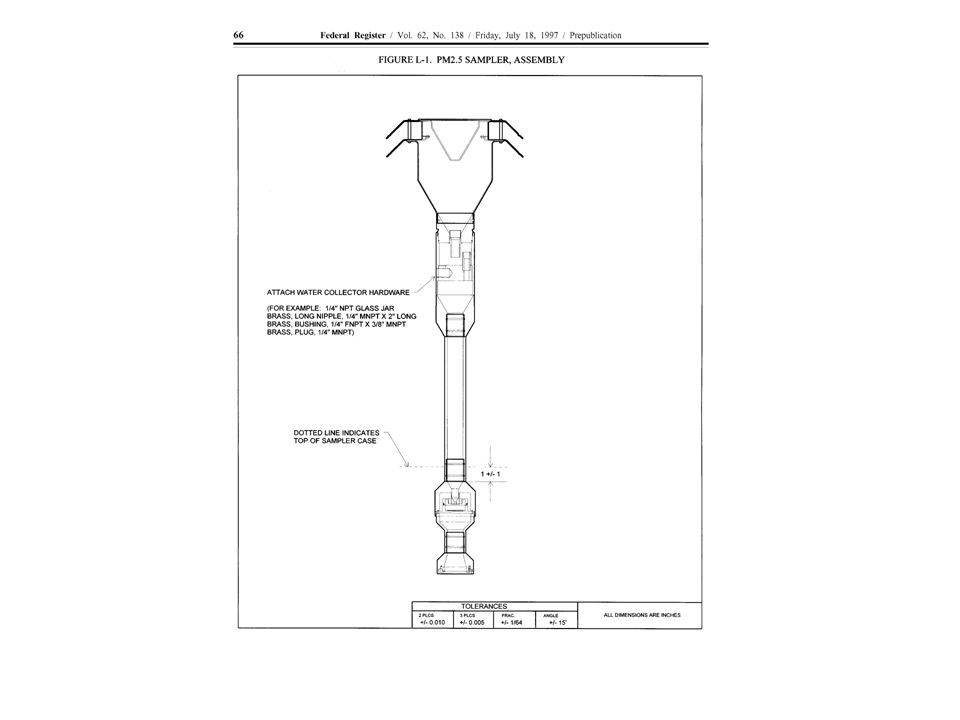
Airborne Mass Concentration Measurement Approved method is the Federal Reference Sampler Equivalent manual samplers can be developed from the same sampler plans Very difficult to develop an equivalent continuous sampler because of the stringent requirements

17
FRM Sampler Designed to –Have sharp cutpoint –Volumetric flow control –Have high precision However, it has –Unknown loss of semivolatile components Ammonium nitrate Organic compounds Thus, it has unknown accuracy and it is only right by REGULATION!

18
FRM Monitoring Network

19
FRM Sampler

20
Problems with FRM Accuracy Cost –High labor and time cost Equilibration Transport to site Weighing Only 33% of the days sampled even when everything goes right!

21
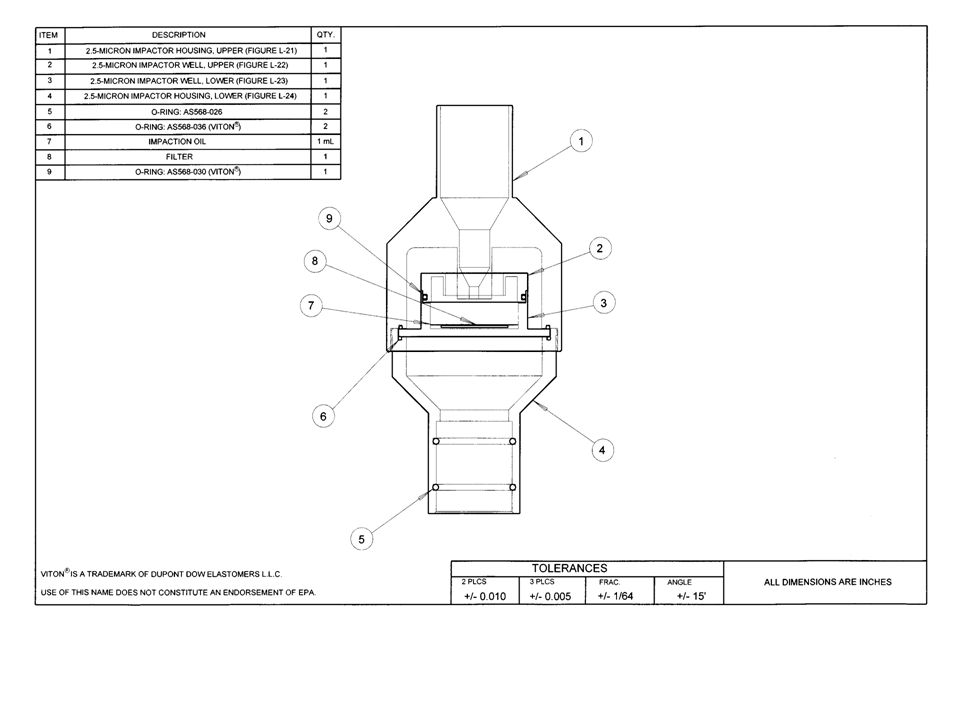
Problems with FRM WINS impactor uses oil to prevent particle bounce –Freezes in the winter although a replacement oil type has now been approved. WINS impactor can now be replaced by the sharp cut cyclone –No oil –Less maintenance

22
Continuous Mass Monitors Need systems that provide continuous measurements of the particle mass –Lower operating costs –Complete data More accurate determination of attainment status –Provide better data for epidemiology and atmospheric process understanding.

23
Continuous Mass Monitors Need a response to collected particle mass –TEOM –Beta Attenuation Monitors –Pressure across over a filter Commercial systems are available

24
Continuous Mass Monitors Problem is not with the detector, but deciding what to measure Water associated with the particle is assumed to be non-toxic and thus, should be removed. Desire to match the FRM measured values

25
Continuous Mass Monitors How to remove the water without removing semivolatiles? Do we want to match the FRM when we know it is inaccurate? What is currently available?

26
30ºC TEOM with SES Operate TEOM at 30ºC Sample Equilibration System uses a Nafion dryer to remove water

27
Continuous Aerosol Mass Monitor (CAMM) Pressure drop over a filter Uses Nafion® dryer Attempts to match FRM values Has a serious problem if there is much mass in the 1.5 to 2.5 µm range.
 Pressure drop over a filter Uses Nafion® dryer Attempts to match FRM values Has a serious problem if there is much mass in the 1.5 to 2.5 µm range.")
29
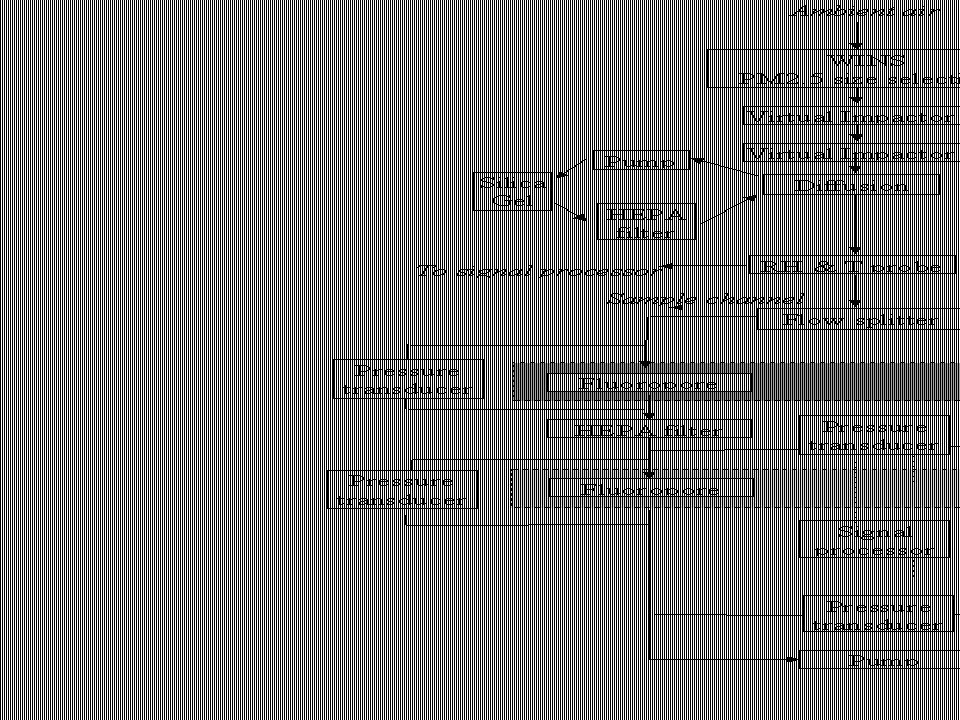
Research Systems Real-time Aerosol Mass System (RAMS) –Developed by Delbert Eatough at BYU –Uses a concentrator to increase the S/N ratio –Dual monitoring system The problem is to deal with both the positive and negative artifacts Adsorption of organics on filter Volatilization of ammonium nitrate and SVOCs
 –Developed by Delbert Eatough at BYU –Uses a concentrator to increase the S/N ratio –Dual monitoring system The problem is to deal with both the positive and negative artifacts Adsorption of organics on filter Volatilization of ammonium nitrate and SVOCs")
32
Differential Systems RAMS is too large and too complex to be a useful monitoring tool. However, suggested the idea of a differential system in which comparisons are made between collection of gases and particles and removal of particles. This comparison permits the estimation of artifacts, both positive and negative

33
Differential TEOM

34
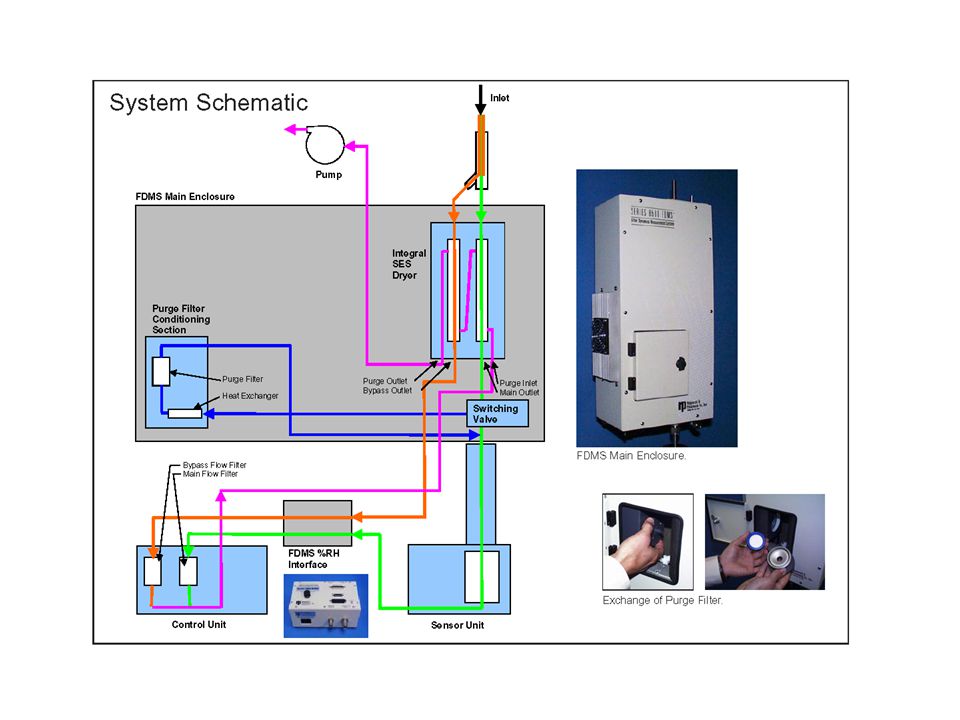
Filter Dynamics Measurement System (FDMS) The Filter Dynamics Measurement System quantifies both the volatile and non-volatile components of particulate matter (PM), and reporting the combination as a mass concentration result by measuring the volatile portion of the sample independently from the total incoming sample, and accounting for this fraction in calculating the PM mass concentration.
 The Filter Dynamics Measurement System quantifies both the volatile and non-volatile components of particulate matter (PM), and reporting the combination as a mass concentration result by measuring the volatile portion of the sample independently from the total incoming sample, and accounting for this fraction in calculating the PM mass concentration.")
36
Continuous Mass Monitors XYInterceptsloper # samples Precision RAAS 2 RAAS-0.570.981.0 33 And-BAM 3 And-BAM0.690.980.98 99 Met-BAM 4 Met BAM-1.190.981.0 105 FDMS 5 FDMS0.881.040.99 55 CAMM 6 CAMM2.320.970.9196 Accuracy RAASAnd-BAM-1.321.020.98 102 RAASMet-BAM-1.581.031.0 102 RAASFDMS3.731.010.99 102 RASSCAMM9.790.680.8793 2

37
Continuous Mass Monitors New guidelines are being developed to permit regional relationships to be developed between the continuous monitor and a collocated FRM. We should start to see a significant number of continuous monitors in the compliance monitoring network within the next 1 to 2 years.

38
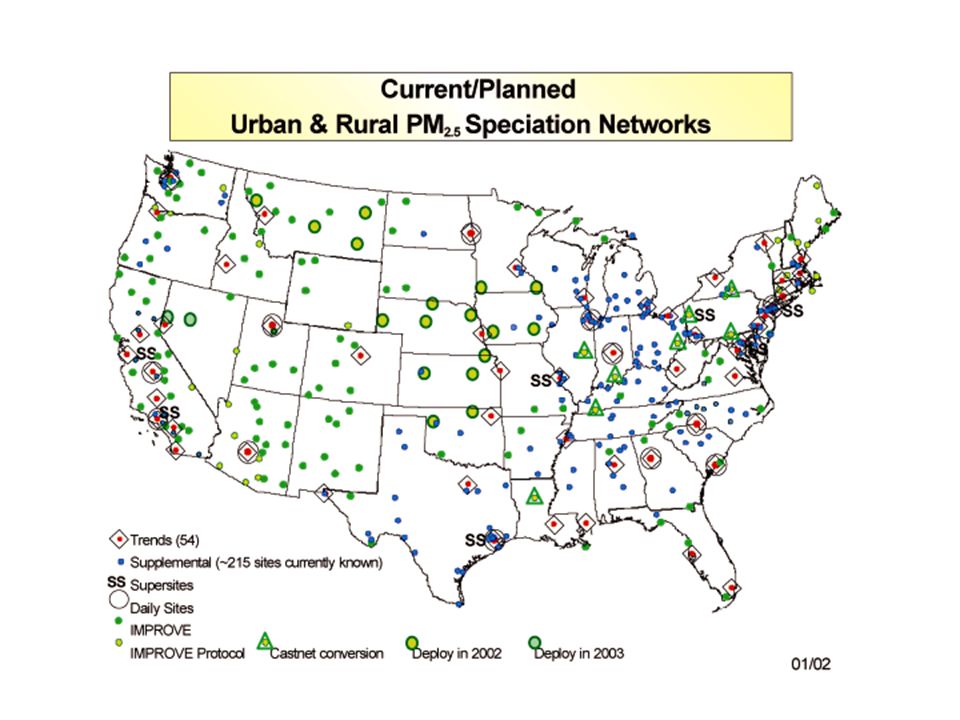
Speciation Network Chemical composition data to support ~190 PM 2.5 filter-based chemical speciation monitoring sites operating, or identified and scheduled to start operating, by December 31, 2001 110 IMPROVE sites and 34 IMPROVE protocol sites

41
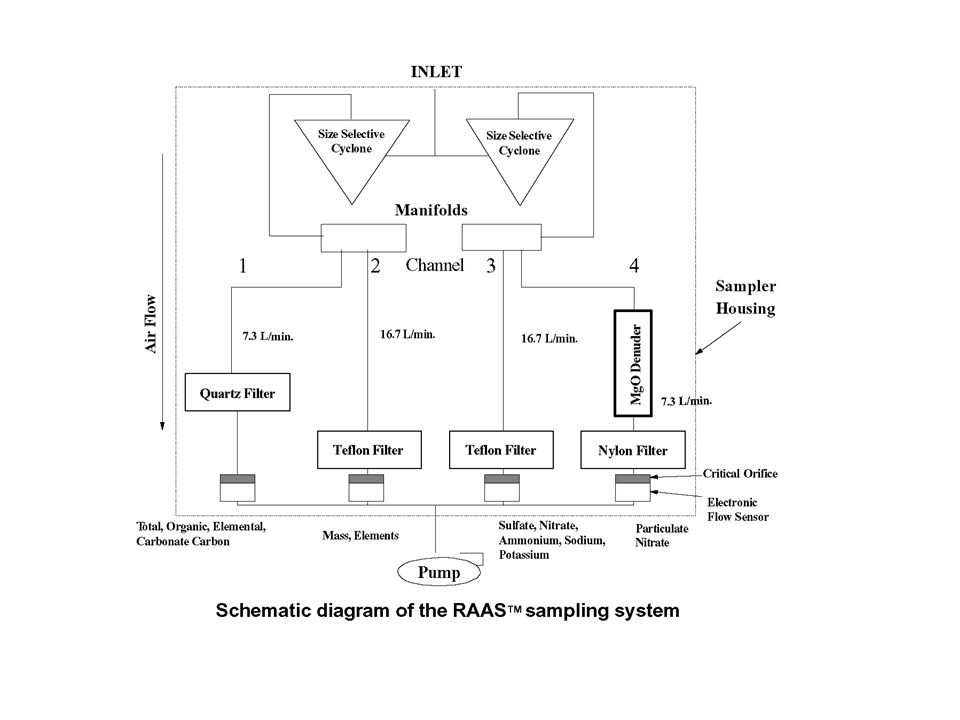
Speciation Network XRF for elements Ion Chromatography for major anions and cations OC/EC using a modified NIOSH 5040 method

42
Speciation Network Data Trends in composition over time Source apportionment for State Implementation Plan development Potential for epidemiology on chemical species or apportioned source contributions

43
Continuous Chemical Data Improved time resolution permits identification of atmospheric process details, Identification of plumes from point sources, Improved source resolution, and Better air quality planning.

44
Continuous Chemical Measurements Continuous measurement of chemical constituents (commercial systems) –Sulfate –Nitrate –OC/EC –Single Particle Mass Spectrometry Research Systems –Particle into Liquid System (PILS) –Semi-continuous Elements in Aerosol System (SEAS)
 –Sulfate –Nitrate –OC/EC –Single Particle Mass Spectrometry Research Systems –Particle into Liquid System (PILS) –Semi-continuous Elements in Aerosol System (SEAS)")
45
Illustrative Results Rochester, NY Sampled through a 4” duct inlet

46
Illustrative Results

47
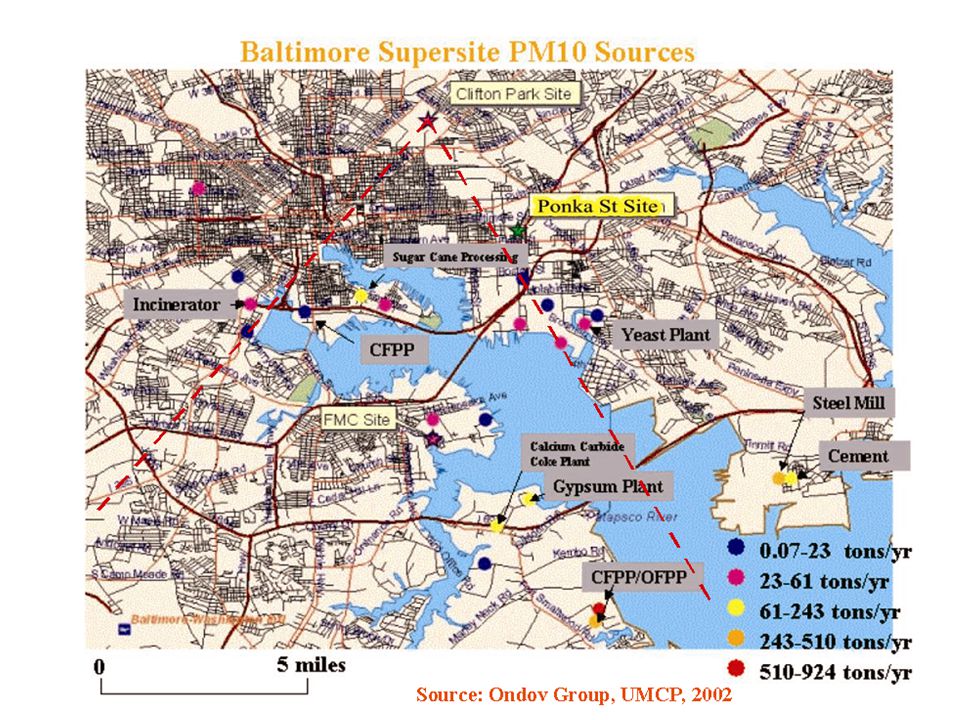
Developed by John Ondov at the University of Maryland at College Park Uses steam injection to cause hygroscopic growth Collected samples can then be analyzed Half-hour time resolution is possible Semi-continuous Elements in Aerosol System (SEAS)
")
49
SEAS

51
QUESTIONS? Thank you for inviting me

Similar presentations


 9 th Semi-Annual.>")


