Download presentation
Presentation is loading. Please wait.

1
Lecture Accounting for the environment: Examples Lecturer: Dr. Justus Wesseler, Wageningen University Literature:Perman et al. (2003), Ch.18 Eric Neumayer: Resource accounting in measures of unsustainability
, Ch.18 Eric Neumayer: Resource accounting in measures of unsustainability.")
2
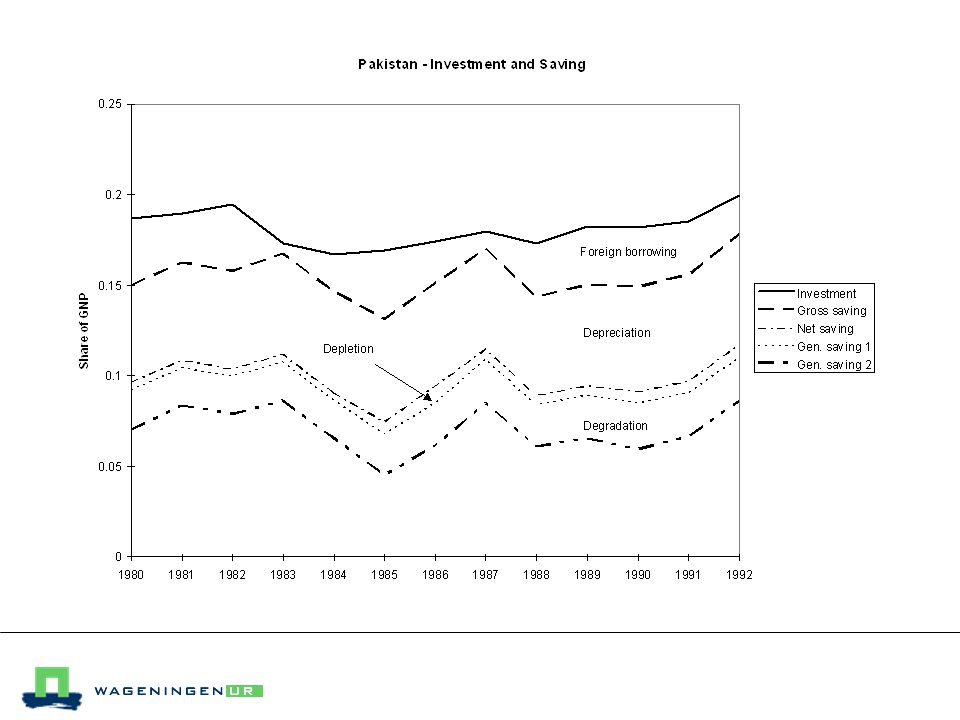
Savings and investment play a central role in the economics of development, but the traditional measures in the national accounts ignore depletion of environmental assets. To correct this, genuine saving is defined as net saving less the value resource depletion and the value of environmental degradation

4
The gross savings rate in any country is determined by a whole range of micro- and macroeconomic policies that affect savings behavior by individuals and institutions. In seeking to alter rates of saving, the questions for the policy-maker include: Is the level of government current expenditure appropriate and sustainable? Dissaving by the government sector depresses the aggregate saving rate. Does the tax system penalize or encourage saving? Consumption taxes, income taxes and payroll taxes all have different incentive effects for savers. Does monetary policy set positive real interest rates? Negative real interest rates are an obvious disincentive to save. Do government policies support a viable financial sector? This affects both incentives to save and the efficiency with which savings are channeled into investments.

5
% Energy cons. increase 1960- 84 due to Energy consumption per person populationincome19601984 Africa 3367612 Asia 1882820 South America 37631628 Europe 168472124 North America 5149 Canada 164286 United States 236281 World 46543855 Source: Pearce & Warford 1993, Table 6-6

6
Figure 2. Shares of National Wealth Box 1. The Wealth of Nations ‘Back of the envelope’ calculations of the wealth of nations were presented in Monitoring Environmental Progress (World Bank 1995). By taking the present value of the stream of income generated over the expected lifetime of the current population, a crude total wealth measure for each country was derived. Separate estimates were made of the value of natural resources and produced assets, permitting the calculation of a value of human capital as a residual. While the resulting figures for individual countries do not bear close scrutiny, broad trends across regions and income categories can be seen, as shown in the figure below.
. By taking the present value of the stream of income generated over the expected lifetime of the current population, a crude total wealth measure for each country was derived. Separate estimates were made of the value of natural resources and produced assets, permitting the calculation of a value of human capital as a residual. While the resulting figures for individual countries do not bear close scrutiny, broad trends across regions and income categories can be seen, as shown in the figure below..")
7
The basic message from this analysis is that development can be conceived as a process of portfolio management: -> countries have a given natural endowment -> that may be transformed into other forms of wealth; ->natural resource exporters aiming to develop their economies need to balance human resources and produced assets in this process of transformation. What is remarkable about Figure 2 is that produced assets make up a near-constant proportion of total wealth across different country groupings. If there is a lack in developing countries it is in human resources.

12
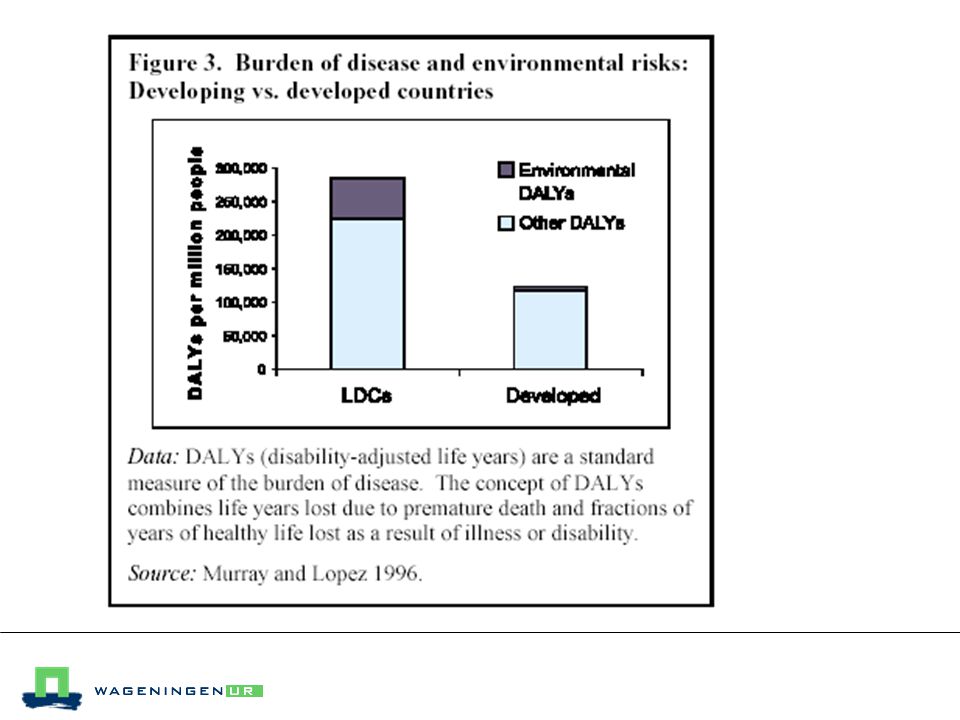
Percent of all DALYs in each country group Environmental Health Group SSAIndiaAsia & Pacific ChinaMNALCRFSEEMEAll LDCs Water supply and Sanitation 10983.585.51.517 Vector diseases (malaria) 90.51.500.30003 Indoor air pollution5.5653.51.70.5004 Urban air pollution1224.533312 Agro-industrial waste 1111.51222.51 All causes26.518.517.51314116.54.518 Table 1. Burden of disease from major environmental risks

13
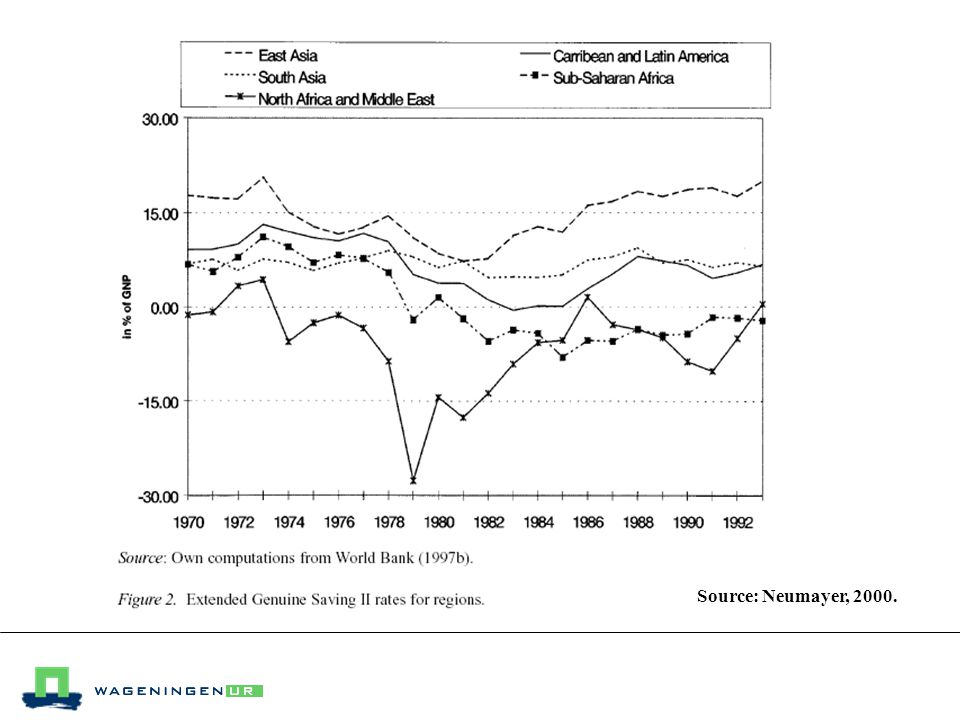
Note: GS is a broad measure for weak sustainability positive GS is a necessary but not sufficient condition for sustainability Considering the problem of resource depletion and environmental degradation, persistently negative genuine savings rate must lead eventually to declining well-being (World Bank). Extended GS II as used by the WB: = GD investment - net foreign borrowing + plus net official transfers + education expenditures - depreciation of man-made capital - resource rents from the depletion of natural resources - damage cause by CO 2 -emissions as a proxy for other pollutants

14
Source: Neumayer, 2000.

16
World Bank method: P: resource price AC: average cost of resource extraction R: resource depletion Repetto method: D: discovery El-Serafy’s method: r: discount rate n: number of remaining years of the resource stock if production was the same in the future as in the base year

17
Reasoning for El-Serafy’s method: -> receipts from non-renewable resource extraction should not fully count as ‘sustainable income’ -> extraction leads to lower resource stock -> depreciation of the resource capital stock -> receipts form the stock will end at some finite time, ‘sustainable income’ by definition must last for ever ‘sustainable income’ is that part of resource receipts which if received infinitely would have a present value equal to the present value from the finite resource receipts. The PV of resource receipts RC at the discount rate r over the expected life-time n of the resource stock is equal to:

18
Setting the two equations equal and solving for SI: The correction term, representing the user cost or the depreciation of the resource stock, would be: The ‘El-Serafy’ method does not assume efficient resource pricing according to Hotelling’s rule (does not depend on an optimization process).
.")
19
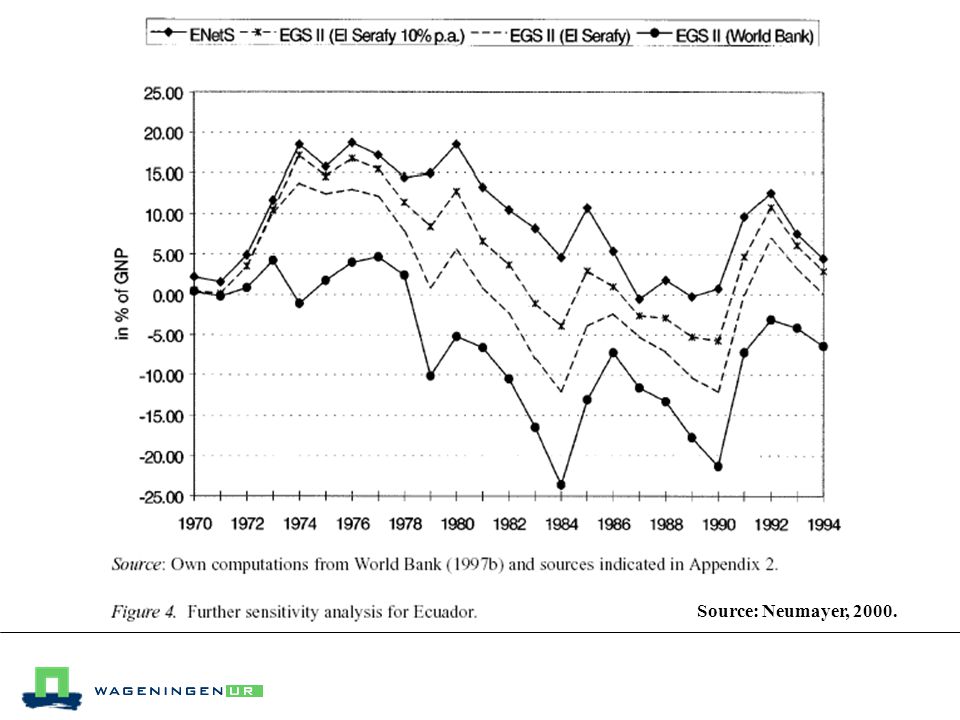
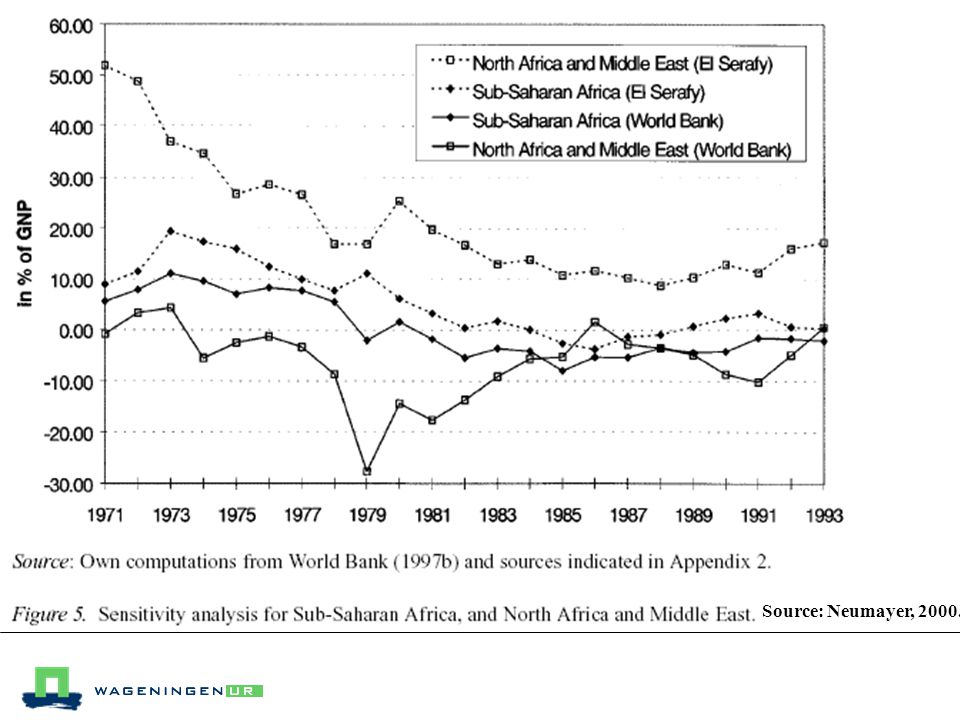
Source: Neumayer, 2000.

Similar presentations


, Ch.18.>")
 The value of all final goods and services.>")


