Download presentation
Presentation is loading. Please wait.

2
5 PART 2 GDP and the Standard of Living MONITORING THE MACROECONOMY
CHAPTER

3
C H A P T E R C H E C K L I S T When you have completed your study of this chapter, you will be able to Define GDP and explain why the value of production, income, and expenditure are the same for an economy. 1 Describe how economic statisticians measure GDP in the United States. 2 Distinguish between nominal GDP and real GDP and define the GDP deflator. 3 Explain and describe the limitations of real GDP as a measure of the standard of living. 4

4
5.1 GDP, INCOME, AND EXPENDITURE
GDP Defined Gross domestic product or GDP The market value of all the final goods and services produced within a country in a given time period. Value Produced Use market prices to value production. Focus your students on the definition of GDP--the market value of all the final goods and services produced within a country in a given time period. Ask your students to go through the definition and pull out the essential parts. You will get this list: market value, final goods and services, produced, within a country, and time period. Explain that the words chosen in this definition were selected carefully. First, if the phrase “market value” had been left out, there would be room for lots of problems. Notice that when the government reports this figure, it doesn’t announce how many trains, planes, and automobiles the country has produced but rather it announces a monetary value. Using monetary values affords us the opportunity to be able to get around the problem of aggregation when the items in question are markedly different. We solve it by allowing the marketplace to determine the weights. The second item on the list is “final goods and services.” The explanation here is straightforward: We are distinguishing between final products and intermediate products. Intermediate goods are goods that are bought by one firm to be used in the production of another good that will be ultimately consumed. If we include these intermediate goods, then we would double count the nation’s output. Now we come to the word “produced.” This word is to make clear that sales are not important. If we only counted sales, then the GDP figures would understate production because not all output is sold. Some of it becomes inventory. Next is the phrase “within a country.” This phrase is to make clear that we don’t count output that wasn’t produced on a nation’s soil regardless of who was responsible for producing it. Lastly, is the phrase “time period.” Here we want to make unambiguous that we are only talking about production that occurred in a certain period. This phrase leaves no doubt that production of a good or service produced in a previous time period (even if perhaps sold in the present time period) does not count in this period’s GDP.
 does not count in this period’s GDP.")
5
5.1 GDP, INCOME, AND EXPENDITURE
What Produced Final good or service A good or service that is produced for its final user and not as a component of another good or service. Intermediate good or service A good or service that is produced by one firm, bought by another firm, and used as a component of a final good or service. GDP includes only those items that are traded in markets.

6
5.1 GDP, INCOME, AND EXPENDITURE
Where Produced Within a country When Produced During a given time period.

7
5.1 GDP, INCOME, AND EXPENDITURE
Circular Flows in the U.S. Economy Consumption expenditure The expenditure by households on consumption goods and services. Investment The purchase of new capital goods (tools, instruments, machines, buildings, and other constructions) and additions to inventories.
 and additions to inventories.")
8
5.1 GDP, INCOME, AND EXPENDITURE
Government expenditure on goods and services The expenditure by all levels of government on goods and services. Net exports of goods and services The value of exports of goods and services minus the value of imports of goods and services.

9
5.1 GDP, INCOME, AND EXPENDITURE
Exports of goods and services Items that firms in in the United States produce and sell to the rest of the world. Imports of goods and services Items that households, firms, and governments in the United States buy from the rest of the world.

10
5.1 GDP, INCOME, AND EXPENDITURE
Total expenditure is the total amount received by producers of final goods and services. Consumption expenditure: C Investment: I Government expenditure on goods and services: G Net exports: NX Total expenditure = C + I + G + NX

11
5.1 GDP, INCOME, AND EXPENDITURE
Labor earns wages, capital earns interest, land earns rent, and entrepreneurship earns profits.

12
5.1 GDP, INCOME, AND EXPENDITURE
Expenditure Equals Income Because firms pay out everything they receive as incomes to the factors of production, total expenditure equals total income. That is: Y = C + I + G + NX The value of production equals income equals expenditure.

13
5.1 GDP, INCOME, AND EXPENDITURE
Figure 5.1 shows the circular flow of income and expenditure.

15
The Expenditure Approach
5.2 MEASURING U.S. GDP The Expenditure Approach Measures GDP by using data on consumption expenditure, investment, government expenditure on goods and services, and net exports. You might like to tell your students that measuring real GDP is actually very cheap. The BEA (in the Department of Commerce) employs fewer than 500 economists, accountants, statisticians, and IT specialists at an annual cost of less that $70 million. It costs each American less than 0.25¢ (a quarter of a cent) to measure the value of the nation’s production. For some further perspective, the National Oceanic and Atmospheric Administration (also in the Department of Commerce), whose mission is to “describe and predict changes in the Earth’s environment, and conserve and manage wisely the nation’s coastal and marine resources so as to ensure sustainable economic opportunities,” employs more than 11,000 scientists and support personnel at an annual cost of $3.2 billion!
 employs fewer than 500 economists, accountants, statisticians, and IT specialists at an annual cost of less that $70 million. It costs each American less than 0.25¢ (a quarter of a cent) to measure the value of the nation’s production. For some further perspective, the National Oceanic and Atmospheric Administration (also in the Department of Commerce), whose mission is to describe and predict changes in the Earth’s environment, and conserve and manage wisely the nation’s coastal and marine resources so as to ensure sustainable economic opportunities, employs more than 11,000 scientists and support personnel at an annual cost of $3.2 billion!")
16
5.2 MEASURING U.S. GDP Expenditures Not in GDP Used Goods
Expenditure on used goods is not part of GDP because these goods were part of GDP in the period in which they were produced and during which time they were new goods. Financial Assets When households buy financial assets such as bonds and stocks, they are making loans, not buying goods and services.

17
The Income Approach 5.2 MEASURING U.S. GDP
Measures GDP by summing the incomes that firms pay households for the factors of production they hire. The U.S. National Income and Product Account divide incomes into two big categories: Wages Interest, rent, and profits Most of the income data used by the BEA comes from the IRS. Expenditure data comes from a variety of sources. In recent years, the first estimates of GDP, which are based on companies reported profits, have been revised downward when data on company profits as reported to the IRS became available. Enron-style accounting has contaminated the initial estimates of GDP but not the final estimates. You can make a nice point with one example of creative accounting. For some years, in its reports to shareholders AOL recorded its advertising expenditure as investment and amortized it over a number of years. First, you can explain that the correct treatment of this item is as an expenditure on intermediate goods and services by AOL and as a charge against AOL profit. The expenditure on AOL services is the value of AOL’s production. And AOL’s expenditure on advertising is part of the value of the production of the advertising agencies used by AOL. You can go on to explain that AOL accounting practice would misleadingly swell GDP by causing some double counting. On the expenditure approach, AOL’s advertising expenditure shows up as investment in the national accounts. On the income approach, because the expenditure is not a cost, it swells profit, so AOL’s corporate profit increases by the same amount as its “investment.” If AOL filed its income tax return in this same way, the national income accounts wouldn’t get corrected. But when AOL files its tax returns, it calls its advertising a cost and lowers its profits by that amount, the BEA picks up these numbers from the IRS and the national accounts get adjusted appropriately.

18
5.2 MEASURING U.S. GDP Wages Wages, called compensation of employees in the national accounts, is the payment for labor services. It includes net wages and salaries plus fringe benefits paid by employers such health care insurance, social security contributions, and pension fund contributions.

19
5.2 MEASURING U.S. GDP Interest, Rent, and Profit
Interest, rent, and profit, called net operating surplus in the national account, is the sum of the incomes earned by capital, land, and entrepreneurship. Interest is the income households receive on loans they make minus the interest they pay on their borrowing. Rent includes payments for the use of land and other rented inputs. Profit includes the profits of corporations and small businesses.

20
Net domestic product at factor cost
5.2 MEASURING U.S. GDP Net domestic product at factor cost The sum of wages, interest, rent, and profit. Net domestic product at factor cost is not GDP. We need to make two adjustments to arrive at GDP: One from factor cost to market prices One from net product to gross product At an intuitive level, the equality between income and expenditure is not a difficult concept to get across. It makes sense to students that whatever someone spends must ultimately end up as income to someone else. The problem comes when we put this into practice. The reason has to do with the fact that there are two non-income charges against GDP (depreciation and indirect taxes less subsidies). If they are ignored, then when using the income approach the figure obtained will be less than the figure obtained using the expenditure approach. As always we are faced with a tradeoff. You can proceed immediately to introduce depreciation and indirect taxes less subsidies and do a comprehensive job. It will be accurate, but your simple and powerful point that income equals expenditure will be lost. The second alternative is to wait and let the intuitive equality sink in. This procedure has the benefit of preserving the expenditure/income equality without prematurely exhausting your students. The downside is that you delay the inevitable. You will eventually have to explain the discrepancy sometime.
. If they are ignored, then when using the income approach the figure obtained will be less than the figure obtained using the expenditure approach. As always we are faced with a tradeoff. You can proceed immediately to introduce depreciation and indirect taxes less subsidies and do a comprehensive job. It will be accurate, but your simple and powerful point that income equals expenditure will be lost. The second alternative is to wait and let the intuitive equality sink in. This procedure has the benefit of preserving the expenditure/income equality without prematurely exhausting your students. The downside is that you delay the inevitable. You will eventually have to explain the discrepancy sometime.")
21
5.2 MEASURING U.S. GDP From Factor Cost to Market Price
The expenditure approach values goods at market prices; the income approach values them at factor cost. Indirect taxes (such as sales taxes) make market prices exceed factor cost. Subsidies (payments by government to firms) make factor cost exceed market prices. To convert the value at factor cost to the value at market prices, we must: Add indirect taxes and subtract subsidies
 make market prices exceed factor cost. Subsidies (payments by government to firms) make factor cost exceed market prices. To convert the value at factor cost to the value at market prices, we must: Add indirect taxes and subtract subsidies.")
22
5.2 MEASURING U.S. GDP From Gross to Net The expenditure approach measures gross product; the income approach measures net product. Gross profit is a firm’s profit before subtracting the depreciation of capital. Net profit is a firm’s profit after subtracting the depreciation of capital. Depreciation is the decrease in the value of capital that results from its use and from obsolescence.

23
5.2 MEASURING U.S. GDP Income includes net profit, so the income approach gives a net measure. Expenditure includes investment. Because some new capital is purchased to replace depreciated capital, the expenditure approach gives a gross measure. To get gross domestic product from the income approach, we must add depreciation to total income. After making these two adjustments the income approach almost gives the same estimate of GDP as the expenditure approach.

24
5.2 MEASURING U.S. GDP

25
Statistical discrepancy
5.2 MEASURING U.S. GDP Statistical Discrepancy The income approach and the expenditure approach do not deliver exactly the same estimate of GDP—there is a statistical discrepancy. Statistical discrepancy The discrepancy between the expenditure approach and income approach estimates of GDP, calculated as the GDP expenditure total minus the GDP income total.

26
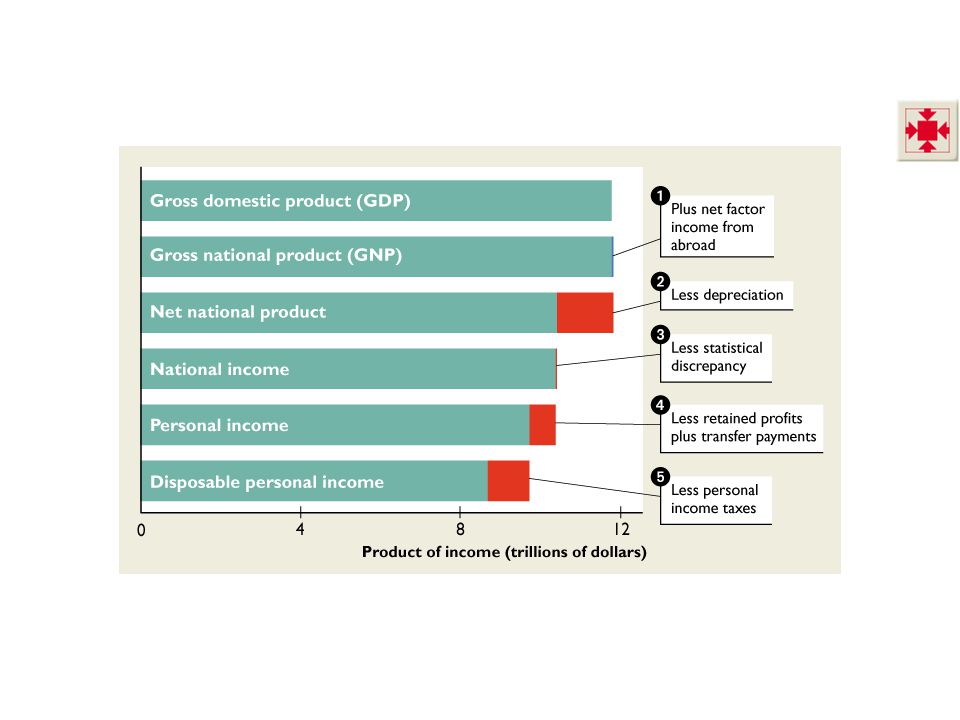
GDP and Related Measure of Production and Income
5.2 MEASURING U.S. GDP GDP and Related Measure of Production and Income Gross national product or GNP The market value of all the final goods and services produced anywhere in the world in a given time period by the factors of production supplied by residents of the country. U.S. GNP = U.S. GDP + Net factor income from abroad

27
Disposable Personal Income
5.2 MEASURING U.S. GDP Disposable Personal Income Consumption expenditure is one of the largest components of aggregate expenditure and one of the main influences on it is disposable personal income. Disposable personal income Income received by households minus personal income taxes paid.

28
5.2 MEASURING U.S. GDP Figure 5.2 shows the relationship between GDP, GNP, and disposable personal income.

30
5.3 NOMINAL GDP VERSUS REAL GDP
Calculating Real GDP Real GDP The value of the final goods and services produced in a given year expressed in the prices of the base year. Nominal GDP The value of the final goods and services produced in a given year expressed in the prices of that same year. The method of calculating real GDP changed in recent years, we describe the two methods.

31
5.3 NOMINAL GDP VERSUS REAL GDP
Traditional Method of Calculating Real GDP We’ll calculate real GDP in an economy that produces only apples and oranges. The current year is 2006, and the base year is 2000. Because 2000 is the base year, real GDP and nominal GDP are the same in 2000. Let’s use the traditional method to calculate real GDP in 2000 and 2006.

32
5.3 NOMINAL GDP VERSUS REAL GDP
GDP Data for 2000: To calculate real GDP in 2000, sum the values of apples and oranges produced in 2000 using prices in 2000. Value of apples = 60 apples x $0.50 = $30 Value of oranges = 80 oranges x $0.25 = $20 Nominal GDP in 2000 = $30 + $20 = $50

33
5.3 NOMINAL GDP VERSUS REAL GDP
GDP Data for 2006: To calculate real GDP in 2006, sum the values of apples and oranges produced in 2006 using prices in 2000. Value of apples = 160 apples x $0.50 = $80 Value of oranges = 220 oranges x $0.25 = $55 Real GDP in 2006 = $80 + $55 = $135

34
5.3 NOMINAL GDP VERSUS REAL GDP
Chained-Dollar Method of Calculating Real GDP The chained-dollar method does not use the base-year prices. The chained-dollar method uses the prices of current year and the preceding year. We show the calculation in fives steps. We’ve included this material on the chained-dollar method because it is the method actually used today. But it might be too technical for your students. Not much is lost by sticking with the traditional method.

35
5.3 NOMINAL GDP VERSUS REAL GDP
Step 1:Calculate the value of production in both 2005 and 2006 using the prices of 2005. In 2005: Value of apples = 100 apples x $1.50 = $150 Value of oranges = 200 oranges x $0.75 = $150 Nominal GDP in 2005 = $150 + $150 = $300

36
5.3 NOMINAL GDP VERSUS REAL GDP
Value of apples = 160 apples x $1.50 = $240 Value of oranges = 220 oranges x $0.75 = $165 2006 Quantities at 2005 prices = $240 + $165 = $405

37
5.3 NOMINAL GDP VERSUS REAL GDP
Using 2005 prices: Value of production in 2005 is $300. Value of production in 2006 is $405. So using 2005 prices, the value of production increased by $105 or 35 percent in 2006.

38
5.3 NOMINAL GDP VERSUS REAL GDP
Step 2:Calculate the value of production in both 2005 and 2006 using the prices of 2006. In 2005: Value of apples = 100 apples x $1.00 = $100 Value of oranges = 200 oranges x $2.00 = $400 2005 Quantities at 2006 Prices = $100 + $400 = $500

39
5.3 NOMINAL GDP VERSUS REAL GDP
Value of apples = 160 apples x $1.00 = $160 Value of oranges = 220 oranges x $2.00 = $440 Nominal GDP in 2006 = $160 + $440 = $600

40
5.3 NOMINAL GDP VERSUS REAL GDP
Using 2006 prices: Value of production in 2005 is $500. Value of production in 2006 is $600. So using 2006 prices, the value of production increased by $100 or 20 percent in 2006.

41
5.3 NOMINAL GDP VERSUS REAL GDP
Step 3: Calculate the average of these increases in production: 35 percent with 2005 prices 20 percent with 2006 prices The average of 35 percent and 20 percent is 27.5 percent—our estimate of the real GDP growth rate between 2005 and 2006. Table 5.6(a) summarizes this calculation.
 summarizes this calculation.")
42
5.3 NOMINAL GDP VERSUS REAL GDP

43
5.3 NOMINAL GDP VERSUS REAL GDP
Step 4 Repeat the calculations for each year going back to the base year, so we have an estimate of the real GDP growth rate from the base year of 2000. Step 5 Starting from real GDP (nominal GDP) in the base year use the real GDP growth rates to calculate real GDP each through to 2006. Table 5.6(b) this calculation.
 in the base year use the real GDP growth rates to calculate real GDP each through to Table 5.6(b) this calculation.")
44
5.3 NOMINAL GDP VERSUS REAL GDP

45
5.3 NOMINAL GDP VERSUS REAL GDP
Calculating the GDP Deflator GDP deflator An average of current prices expressed as a percentage of base-year prices. GDP deflator measure the price level. GDP deflator = (Nominal GDP Real GDP) 100.
 100.")
46
5.3 NOMINAL GDP VERSUS REAL GDP
We calculated the in 2006: Nominal GDP = $600 and real GDP = $145 GDP deflator = (Nominal GDP ÷ Real GDP) x 100 So in 2006: GDP deflator = ($600 ÷ $145) x 100 = 414.
 x 100. So in 2006: GDP deflator = ($600 ÷ $145) x 100 = 414.")
47
5.4 THE USE AND LIMITATIONS OF REAL GDP
We use estimates of real GDP for two main purposes: To compare the standard of living over time To compare the standard of living among countries The Standard of Living Over Time To compare living standards we calculate real GDP per person—real GDP divided by the population. Table 5.8 shows two calculations

48
5.4 THE USE AND LIMITATIONS OF REAL GDP

49
5.4 THE USE AND LIMITATIONS OF REAL GDP
Long-Term Trend Figure 5.3 shows the long-term trend in U.S. real GDP per person. Real GDP per person doubled on the 33 years from 1965 to 1998.

50
5.4 THE USE AND LIMITATIONS OF REAL GDP
Short-Term Fluctuations Fluctuations in the pace of expansion of real GDP is called the business cycle. The business cycle is a periodic irregular up-and down movement of total production and other measure of economic activity. The four stages of a business cycle are expansion, peak, recession, and trough.

51
5.4 THE USE AND LIMITATIONS OF REAL GDP
The shaded periods show the recessions– periods of falling production that lasts for at least six months.

53
5.4 THE USE AND LIMITATIONS OF REAL GDP
Standard of Living Across Countries To compare living standards across countries, we must convert real GDP into a common currency and common set of prices, called purchasing power parity. Goods and Services Omitted from GDP Household production Underground production Leisure time Environment quality A discussion of omissions from GDP can arouse students’ interest. For example, you might point out that if one of your students mows her/his own lawn, the value of the student’s production doesn’t show up in GDP. But if you hire the student to mow your lawn (and if your student reports the income earned correctly to the IRS), the value of the student’s production does show up in GDP. Why don’t we measure all lawn mowing as part of GDP? Some reasons are cost of collecting data and the degree of intrusiveness we’d be willing to tolerate. But note how little we spend on collecting the GDP data and how relatively inexpensive it would be to add some questions about domestic production to either the Labor Force Survey or the Family Expenditure Survey. You might like to explain how the omission of illegal goods and services also leads to some misleading comparisons. For instance, the day before prohibition ended, the production of illegal beer was not counted as part of GDP. But the day after prohibition ended, the production of now legal beer counted. Ask your students to suggest two good reasons why illegal goods and services are omitted. First, the data are hard but not impossible to obtain. Second, there may be the moral position that illegal activities should not be included in GDP. This latter observation can lead to an interesting discussion. Ask the students if they think that the production of, say, marijuana should be included in GDP. Some, maybe even many, of them will see no problem with this. Then ask about the production of murder-for-hire. The response, we hope, will be significantly different. Does such a good have any value?
, the value of the student’s production does show up in GDP. Why don’t we measure all lawn mowing as part of GDP Some reasons are cost of collecting data and the degree of intrusiveness we’d be willing to tolerate. But note how little we spend on collecting the GDP data and how relatively inexpensive it would be to add some questions about domestic production to either the Labor Force Survey or the Family Expenditure Survey. You might like to explain how the omission of illegal goods and services also leads to some misleading comparisons. For instance, the day before prohibition ended, the production of illegal beer was not counted as part of GDP. But the day after prohibition ended, the production of now legal beer counted. Ask your students to suggest two good reasons why illegal goods and services are omitted. First, the data are hard but not impossible to obtain. Second, there may be the moral position that illegal activities should not be included in GDP. This latter observation can lead to an interesting discussion. Ask the students if they think that the production of, say, marijuana should be included in GDP. Some, maybe even many, of them will see no problem with this. Then ask about the production of murder-for-hire. The response, we hope, will be significantly different. Does such a good have any value")
54
5.4 THE USE AND LIMITATIONS OF REAL GDP
Household Production Real GDP omits household production, it underestimates the value of the production of many people, most of them women. Underground Production Hidden from government to avoid taxes and regulations or illegal. Because underground economic activity is unreported, it is omitted from GDP.

55
5.4 THE USE AND LIMITATIONS OF REAL GDP
Leisure Time Our working time is valued as part of GDP, but our leisure time is not. Environment Quality Pollution is not subtracted from GDP. We do not count the deteriorating atmosphere as a negative part of GDP. If our standard of living is adversely affected by pollution, our GDP measure does not show this fact.

56
5.4 THE USE AND LIMITATIONS OF REAL GDP
Other Influences on the Standard of Living Health and Life Expectancy Good health and a long life do not show up directly in real GDP. Political Freedom and Social Justice A country might have a very large real GDP per person but have limited political freedom and social justice. A lower standard of living than one that had the same amount of real GDP but in which everyone enjoyed political freedom. You can generate a productive classroom discussion on the topic of this slide.

57
GDP in YOUR Life As you listen to the news, look for references to GDP. How is GDP used in daily life? Is the news about nominal GDP or real GDP? Is the term used correctly? Using U.S.GDP person, how does your income compare to the average income? How do you think your standard of living compares with that of a student in France or China? Do you produce more market goods than nonmarket good? How can you value your nonmarket production? Is your production counted in the nation’s output?

Similar presentations


 Measures What? Newly produced final goods and services. Where? Goods and services produced within.>")


>")


 Outline: 1.Functions of NIA 2.Gross Domestic Product (GDP) 3.The Value Added approach to GDP 4.The Expenditure Approach.>")
