Download presentation
Presentation is loading. Please wait.

1
April 18, 2005 Questions, clarifications on the simulation –How do you handle Carsons? –Will the Committee Reports be Graded? Party Concepts (the five party periods) Jacobson Median Voter Wednesday’s Readings
 Jacobson Median Voter Wednesday’s Readings.")
2
Are they a distinct generation? DARE Generation HIP HOP Generation September 11 Generation Net Generation Generation Y Millennial Generation (roughly birth through those half-way through college)
.")
3
millennials From the “Me” Generation to the “We” Generation

4
Millennials – shaped by five factors 1.The end of the Cold War 2.The Information Revolution 3.The new economy 4.Our increasingly diverse society 5.The events of September 11, 2001

5
millennials tend to be Socially liberal (though they reject liberal and conservative labels) Fiscally conservative (they’re savers) Personally responsible
 Fiscally conservative (they’re savers) Personally responsible")
6
Personally responsible – and more spiritual than their parents or older siblings

7
Millennials – from “me” to “we” Volunteerism is at an all-time high. 1989: 55% of young people reported helping an elderly neighbor “sometime in their life.” 1999: that number was up to 87% 2003: 72% of college students had volunteered in a community organization within the previous year, 58% within the previous month.

8
key words UNITY ENVIRONMENT COLLABORATION LEADERSHIP TEAMWORK FAITH COMMUNITY AUTHENTICITY

9
remember Attitudes toward hierarchical authoritarian institutions (such as the church and the military) are most pliable during the early teens and tend to be fixed by the early twenties.
 are most pliable during the early teens and tend to be fixed by the early twenties.")
10
Politics? Remoteness is, well, remote – and unwanted. 511,000 elected officials in the U.S. Rising levels of participation and a “can do” attitude.

11
Rising levels of participation and a “can do” attitude ??? Turnout in the 2004 election. –Highest, as a %, since 1972 –77% of students at 4-year colleges voted. Associated with change in attitudes…

12
College Students’ Political Values Defy Traditional Labels; Attitudes toward Social and Moral Issues Defining a Generation

13
“The Traditional Right” Support Bush 72%-17% US should use preemptive strike Gay relationships are “morally wrong” Religion should play more important role in government Oppose affirmative action Tax cuts are best way to stimulate economy LiberalConservative Secular Religious “Traditional Conservatives” 16%

14
“The Traditional Left” LiberalConservative Secular Religious Support Kerry 79%-8% US should not use preemptive strike Support gay rights Pro-immigration Pro-affirmative action Oppose tax cuts as economic policy Basic health insurance is a right “Traditional Liberals” 32%

15
“The Secular Center” “Secular Centrists” 29% LiberalConservative Secular Religious Split evenly for President (42% Bush, 41% Kerry) Strongly supports gay rights Supports free trade Believes strongly in separation of church and state Oppose affirmative action Less supportive of environment Less likely to believe basic health insurance is a right
 Strongly supports gay rights Supports free trade Believes strongly in separation of church and state Oppose affirmative action Less supportive of environment Less likely to believe basic health insurance is a right")
16
“The Religious Center” “Religious Centrists” 23% Lean Bush 51%-34% Support affirmative action Support the environment Gay relationships are “morally wrong” Religion should play more important role in government Highest concentration of African Americans and Latinos LiberalConservative Secular Religious

17
The Political Personality of a New Generation “Traditional Liberals” 32% “Traditional Conservatives” 16% “Religious Centrists” 23% “Secular Centrists” 29% LiberalConservative Secular Religious

18
Politically Inactive L CS Pessimistic Optimistic LCRS Democrat Republican LCRS Liberal Conservative LCRS R Politically Active L=Traditional Liberals C=Traditional Conservatives R=Religious Centrists S=Secular Centrists

19
Gay Rights Conservative CR S Gay Rights Liberal Not Religious Religious LCRS Foreign Policy Liberal Foreign Policy Conservative LCRS Economic Policy Liberal Economic Policy Conservative LCRS Domestic Policy Liberal Domestic Policy Conservative LCRS L

20
The Power of the Median Voter Anthony Downs. 1957. An Economic Theory of Democracy. New York: Harper & Row

21
The Power of the Median Voter Anthony Downs. 1957. An Economic Theory of Democracy. New York: Harper & Row

22
The Power of the Median Voter As long as the distribution of preferences is unimodal, rational parties maximize votes by staking out policy positions that reflect the interests of the median voter. (Downs 1957) If politicians are “faithful agents,” fidelity can be measured by how the median voter’s preferences constrain politicians. Rational extremists will not abstain. (Downs 1957) However, extremists become alienated in one-party dominant systems, yielding off-median party positions as areas become more one-party dominant. (Hinich, Ledyard, Ordeshook 1972)
 If politicians are faithful agents, fidelity can be measured by how the median voter’s preferences constrain politicians. Rational extremists will not abstain. (Downs 1957) However, extremists become alienated in one-party dominant systems, yielding off-median party positions as areas become more one-party dominant. (Hinich, Ledyard, Ordeshook 1972).")
23
The U.S. is politically centrist There is a rough balance between the two major parties. A Downsian legislature would be –unimodal and –have faithful agents representing the ideological preferences of their constituents. The Power of the Median Voter

24
Ideology in the U.S. Congress is bipolar Political parties matter The Power of the Median Voter

25
T he percentage of moderates has dwindled as the Congress has polarized. (Poole & Rosenthal 1997, King 1998, 1999)
.")
26
Democrats Republicans Median Elections map A onto B Elections A B The Power of the Median Voter

27
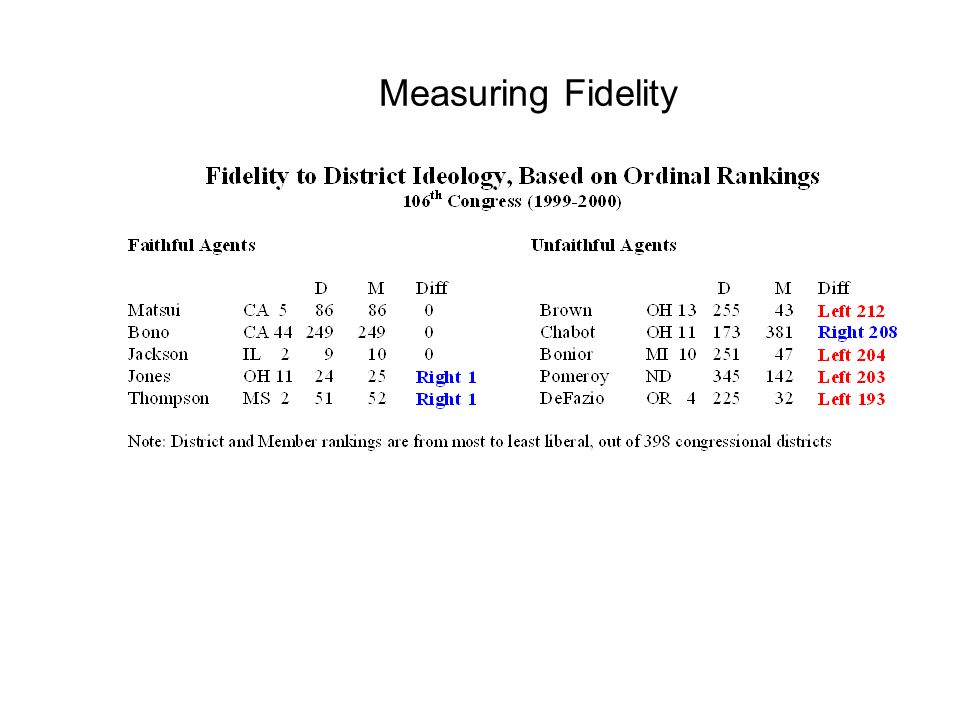
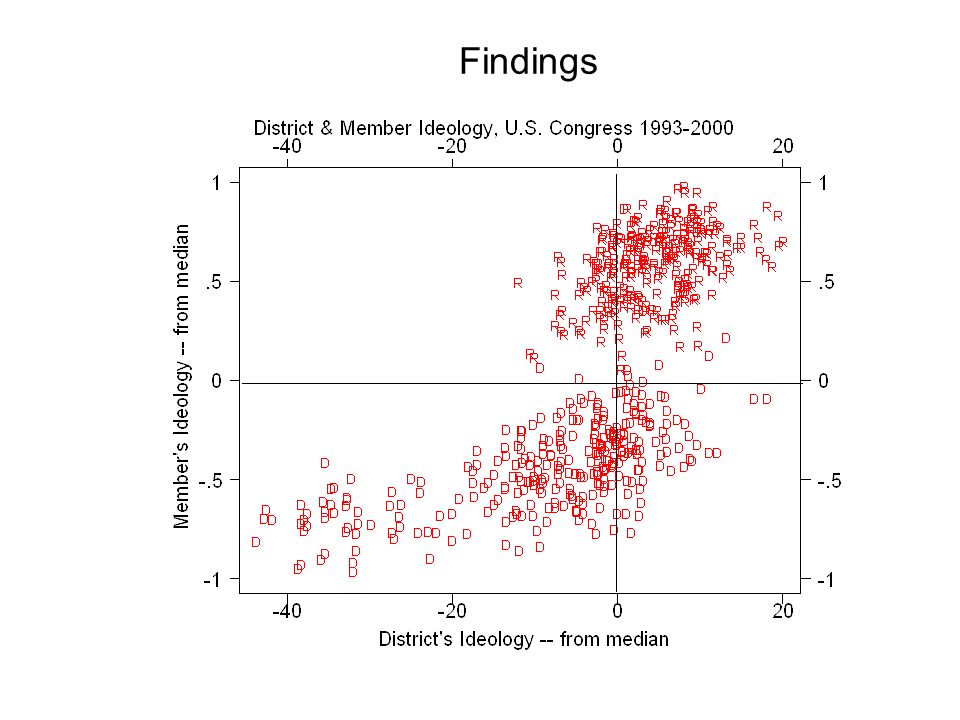
Measuring Fidelity to the Median Voter in the U.S. Congress Take a district’s ideology (Clinton Vote, ‘92, ‘96) Take a member’s ideology (DW-Nominate scores) Two measures to make district and member ideology commensurate: (1) rank ordering (2) using each member’s predicted ideology from a best fit curve. Fidelity is the difference between the district and member scores. Higher absolute numbers mean worse fidelity. Drop Districts with inconsistent borders from 103rd through 106th Congresses, also Drop “home” Districts, leaving 398 districts.
 Take a member’s ideology (DW-Nominate scores) Two measures to make district and member ideology commensurate: (1) rank ordering (2) using each member’s predicted ideology from a best fit curve. Fidelity is the difference between the district and member scores. Higher absolute numbers mean worse fidelity. Drop Districts with inconsistent borders from 103rd through 106th Congresses, also Drop home Districts, leaving 398 districts..")
28
Measuring Fidelity

29
Source: Boston Globe, Tuesday, February 13, 2001 Massachusetts 9th Congressional District is the 75th most liberal, of 398. Congressman Joe Moakley’s Ordinal DW- Nominate Scores for the 1990s were, 77 (103rd), 79 (104th) 88th (105th, 98th (106th) Accordingly, Congressman Moakley’s Fidelity scores were 2, 4, 13, and 23, an average of 11 from 1993 through 2000. Measuring Fidelity
, 79 (104th) 88th (105th, 98th (106th) Accordingly, Congressman Moakley’s Fidelity scores were 2, 4, 13, and 23, an average of 11 from 1993 through Measuring Fidelity.")
30
Fidelity is an exceptionally good indicator of longevity in Congress –of the 50 most faithful representatives, 38 served throughout the 1990s. –of the 50 least faithful, 16 served throughout the 1990s. Measuring Fidelity

32
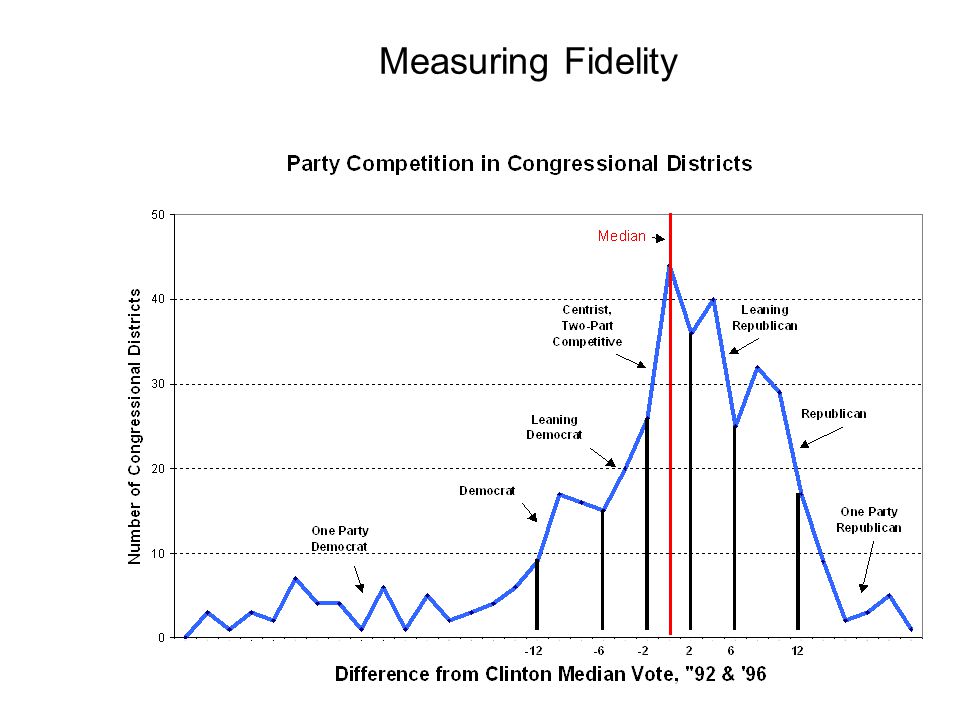
4 of 5 most faithful representatives came from party-dominant districts.

33
Measuring Fidelity 4 of 5 most faithful representatives came from party-dominant districts. 4 of 5 least faithful representatives came from two-party competitive districts.

34
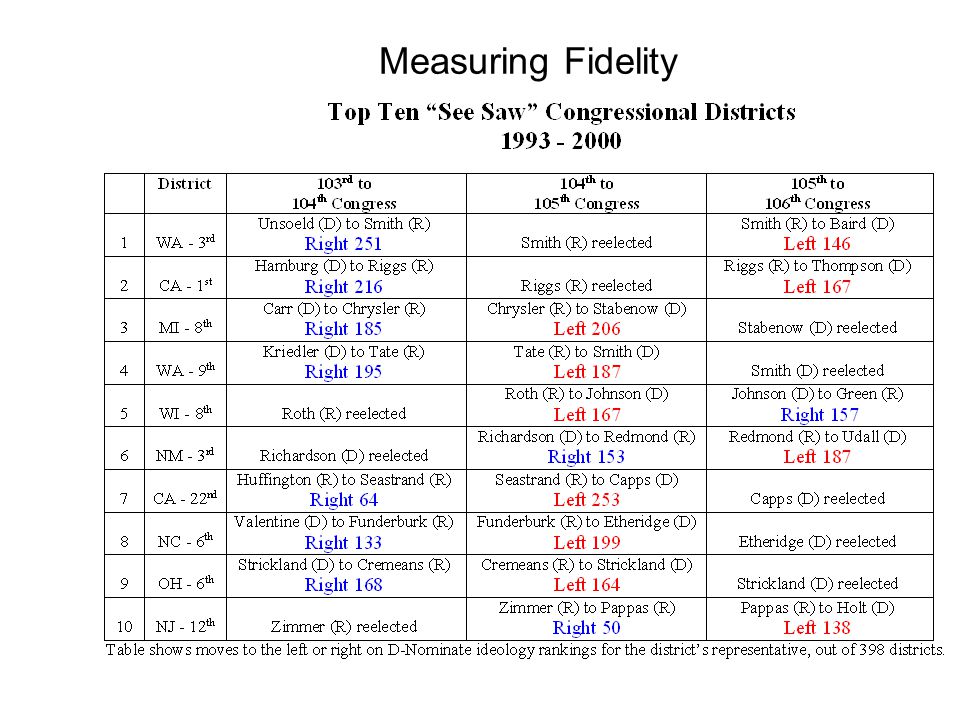
Measuring Fidelity

35
The Ohio 6th is a “see saw” district, switching between extremes

36
Measuring Fidelity

39
Findings

43
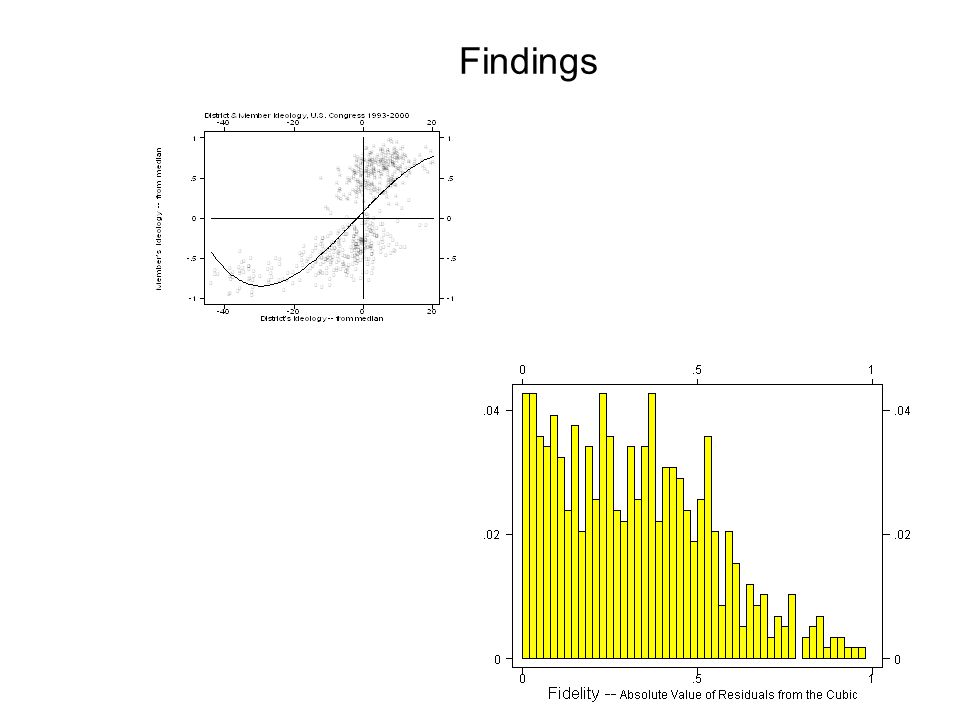
Measures of Fidelity based on the model –Average 0.32 –Range 0 to 0.96 –Includes 587 Observations for the 8 years studied

44
Findings Measures of Fidelity based on the model –Average 0.32 –Range 0 to 0.96 –Includes 587 Observations for the 8 years studied Fidelity varies member by member

45
Findings Measures of Fidelity based on the model –Average 0.32 –Range 0 to 0.96 –Includes 587 Observations for the 8 years studied Fidelity varies member by member –Tenure (number of terms served), more fidelity
, more fidelity")
46
Findings Measures of Fidelity based on the model –Average 0.32 –Range 0 to 0.96 –Includes 587 Observations for the 8 years studied Fidelity varies member by member –Tenure (number of terms served), more fidelity –Turnout (general election PEV), more fidelity
, more fidelity –Turnout (general election PEV), more fidelity")
47
Findings Measures of Fidelity based on the model –Average 0.32 –Range 0 to 0.96 –Includes 587 Observations for the 8 years studied Fidelity varies member by member –Tenure (number of terms served), more fidelity –Turnout (general election PEV), more fidelity –Leadership positions, less fidelity
, more fidelity –Turnout (general election PEV), more fidelity –Leadership positions, less fidelity")
48
Expectations

49
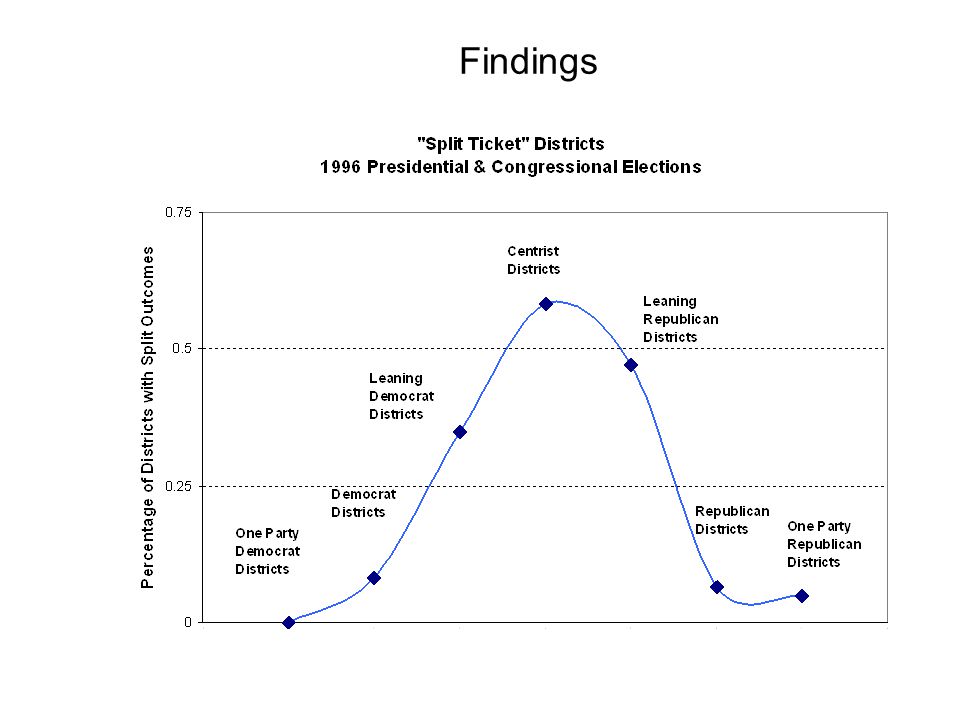
Residuals from a cubic model regressing district’s ideology on member’s ideology. Graph shows the average of the absolute values of the within-category residuals. The maximum value of the residual value is 1. Findings -- Upside Downs

50
Centrist districts were the source of the Gingrich revolution Conservatives replaced liberals 71% came from centrist districts Liberals replaced conservatives 29% came from centrist districts Liberals replaced liberals 50% came from centrist districts Conservatives replaced conservatives 44% came from centrist districts Findings -- Upside Downs

51
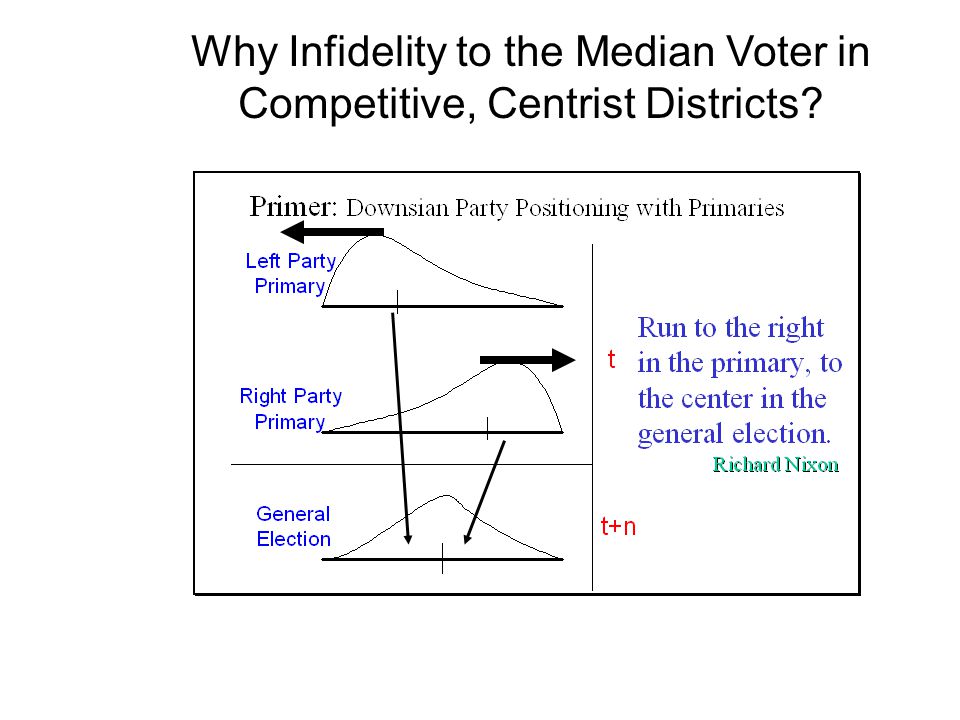
Why Infidelity to the Median Voter in Competitive, Centrist Districts? Political participation is a choice, not the simple result of distance in utilities. activated.Activists are regular folk who become activated. People are more likely to become activated when –they have the most to lose –their chances of winning are greatest

52
Why Infidelity to the Median Voter in Competitive, Centrist Districts? People are more likely to become activated when –they have the most to lose –their chances of winning are greatest

53
Source: King (1997) Why Infidelity to the Median Voter in Competitive, Centrist Districts? Polarization in the Mass Public

54
Why Infidelity to the Median Voter in Competitive, Centrist Districts? Source: Center for the Study of the American Electorate (1999)
.")
55
Why Infidelity to the Median Voter in Competitive, Centrist Districts?

56
Burden (1998)
")
57
Why Infidelity to the Median Voter in Competitive, Centrist Districts?

59
Wing-nuts are most likely to become activated in competitive districts. This drives policies within the primaries to extremes.

60
The Politics of Congressional Elections Gary C. Jacobson

61
Representation Policy Congruence Strong relationship, especially on general dimensions and regarding core constituency Interests & Causes e.g. Minority Members Representation by Referendum “Throw the bums out!” Contract with America Descriptive Representation Overwhelmingly white male

62
Policy Consequences Particularism Narrowly Targeted Benefits Impacts almost all proposals “Pork” is actually a small part of the budget Serving the Organized Organization Target Lists Individual Responsiveness ≠ Collective Responsibility Parties are the only mechanism for collective accountability Collective Action Problem

63
Congressional Parties Party Leaders Reward Cooperation Punish Defection 1950s-1960s: Democrats Divided 1970s-1980s: Party Control Strengthened 1995 and beyond: Very Strong Leadership Polarization Party Unity Ideological Polarization Polarization in Presidential Support Divided Electorate Regional Divide

Similar presentations


>")
>")


 initiative? If the legislature.>")