Download presentation
Presentation is loading. Please wait.

1
Brad Lester, Brad Schoolman, Brandon Ng, Bryan Wessale, Christopher Schumacher AEM Spaceflight with Ballooning

2
Mission Overview Objectives 1.To send a sub-orbital payload up to between 80,000 and 90,000 ft carrying equipment for data collection. 2. To test the affect of altitude on solar intensity through the use of solar panels. We expect to prove that with increased altitude comes increased intensity leading to greater voltage output from the panels. 3. To test how frequency changes with atmospheric pressure. We expect frequency to increase because there is less resistance. 4. To analyze the chaos and shredding of the balloon at point of burst. We expect to show how the balloon pops and at what velocity.

3
*Frequency of sound waves (microphone) *Voltage output as a function of altitude (solar panels) *Rate of shredding (video camera) *Pressure and Temperature (HOBO data recorder and required sensor)
 *Voltage output as a function of altitude (solar panels) *Rate of shredding (video camera) *Pressure and Temperature (HOBO data recorder and required sensor)")
4
Chris S. Provides leadership and direction. Integral in design and conception. Also works slightly on build. Worked on temperature and pressure analysis and calibrating the HOBO data. Delegates components of the documentation to group members. Is responsible for the first couple of slides. Brandon N. Co-leader, Main builder, tester, and document writer. Directly assists in design. Was responsible for the pressure calibration and the preflight testing slides. Bryan W. Built and designed payload box. Finished putting the pieces together with our devices before launch day. Was responsible for the temperature calibration. Is also responsible for the Science Results slide. Brad S. Works slightly on design and building of the payload box. Works mainly on presentation. Brad was responsible for the day of the flight slides. Brad L. Provides some conceptual and design ideas. Helped build box and went on the chase. Was responsible for analysis of the audio files and the “burst” analysis. Was also responsible for the expected science results slide.

6
Four independent systems; -Flight Computer System -Camcorder -Audio recorder -Solar Array System Objects must be physically connected by wires in order to work requiring close proximity between the components

7
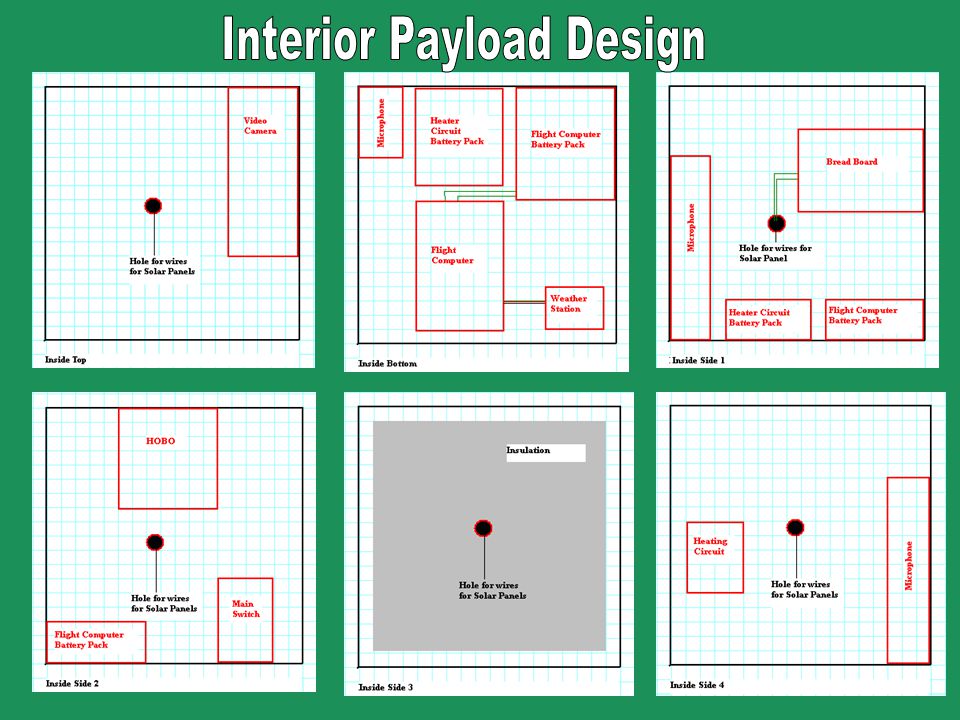
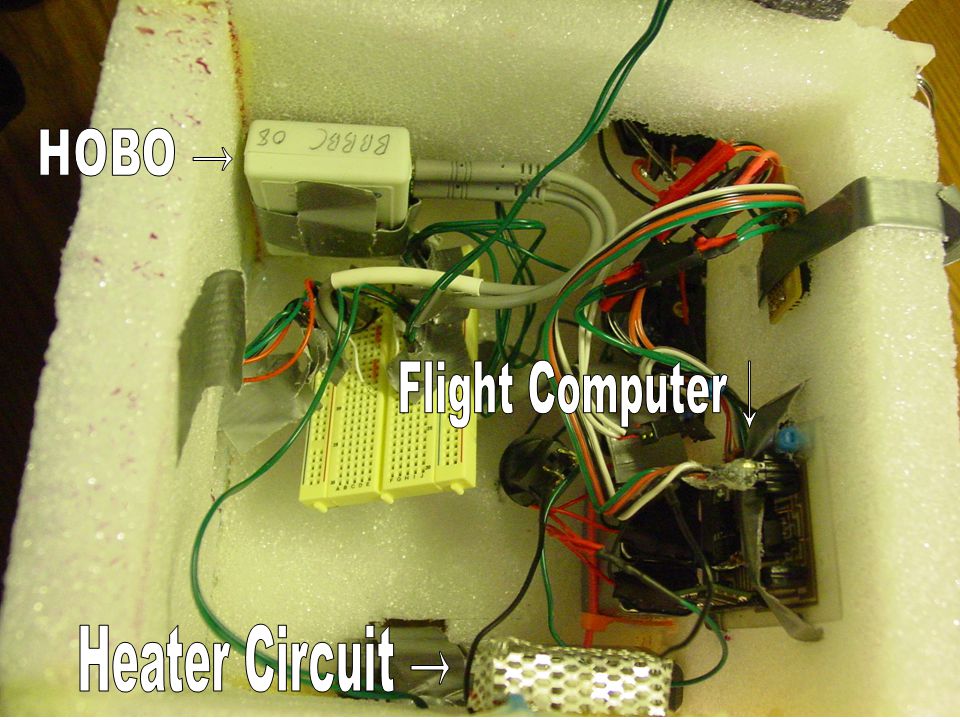
Planned Layout *Matched what was needed for out payload *Did not include a method of securing the components to the payload itself *There was plenty of room within the payload Actual Layout *Required less space than was initially thought necessary *Components that need a connection are placed close to one another. Interior post-flight featuring the flight computer, heating circuit, and microphone

9
The construction was one of the more time consuming enterprises that we as group encountered. It involved many thoughts such as distance needed to travel in order to connect the components All components fit inside the payload with a considerable amount of access room.

11
Things to Note: There is plenty of room inside of the payload even if if contains all components. This can lead to things becoming lose and damaging themselves. The opening to the box is not actually the top because we needed the camera to remain stationary for the duration

12
*Hobo collected all of our data for the following experiments: - Voltage Test One (Solar panels on top) Tested voltage output (computer program) - Voltage Test Two (Solar panels on the sides) Tested voltage output (computer program) - Internal Temperature - Internal Pressure *We used a HOBO ® which has two input jacks for use in out tests, of which only two are recorded by the HOBO ®. *The HOBO ® recorded data every 7 seconds from initiation of the program

13
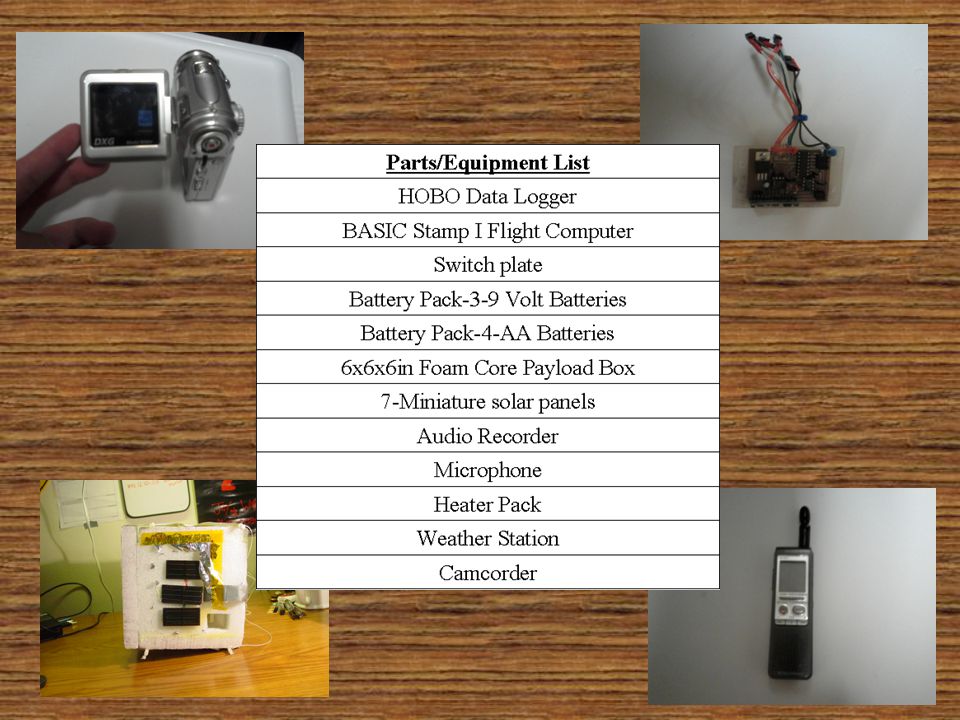
Mass and Cost Budget costmass (kg)QuantityTotal Cost Total Mass (kg) DXG DXG-569V 5MPixel HD video camera with SD memory card $210.000.1761$2100.0176 External (lithium) battery pack for video camera $ 10.000.0801 $ 10.000.080 BASIC Stamp I flight computer and switch plate $ 56.000.0631 $ 56.000.063 Battery pack for flight computer $ 5.000.1101 $ 5.000.110 Weather station sensor pack $ 29.000.0121 $ 29.000.012 6" x 6" x 6" payload box built out of styrofoam $ 8.000.2051 $ 8.000.205 miniature solar panels $ 8.000.0087 $ 56.000.056 HOBO data logger (thermometer and relative humidity sensor built in) $105.000.0271 $ 105.000.027 HOBO temperature sensor probe $ 28.000.0101 $ 28.000.010 Heater circuit and switch $ 5.000.0271 $ 5.000.027 Battery pack for heater $ 6.000.1501 $ 6.000.150 Microphone Recorder $ 45.000.1601 $ 45.000.016 Microphone Attachment $ 25.000.0071 $ 25.000.007 Extra Wires$ 13.00.4001$ 13.00.400 $ 571.001.3965
QuantityTotal Cost Total Mass (kg) DXG DXG-569V 5MPixel HD video camera with SD memory card $ $ External (lithium) battery pack for video camera $ $ BASIC Stamp I flight computer and switch plate $ $ Battery pack for flight computer $ $ Weather station sensor pack $ $ x 6 x 6 payload box built out of styrofoam $ $ miniature solar panels $ $ HOBO data logger (thermometer and relative humidity sensor built in) $ $ HOBO temperature sensor probe $ $ Heater circuit and switch $ $ Battery pack for heater $ $ Microphone Recorder $ $ Microphone Attachment $ $ Extra Wires$ $ $")
14
Payload Pre-flight Testing Heater Circuit Testing

15
Pre-Flight Testing Cont. Thermal Testing – Microphone Payload box cooled to -90 degrees celsius. Microphone stayed in operation for the three minutes of testing.

16
Pre-Flight Testing Cont. Solar Panels – Linked in series, Uncovered 4 panels – Generated about 2 volts under florescent room light 3 Panels – Generated about 1.5 volts under florescent room light

17
Pre-Flight Testing Cont. Switch Plate Testing – Light flickered on and off Re-soldered wires to switch – Pull cord had a resistance of infinity Re-soldered pull cord to the correct spefications

18
Pre-Flight Testing Cont. Flight Computer – Pressure Sensor Recorded pressure increases as actual pressure on the sensor increased – Temperature Sensor Did not record any changes as actual temperature increased – Professor Flaten made changes » Test 2 recorded changes as actual temperature increased

19
Pre-Flight Testing Cont. Other Pre-Flight tests that would have been valuable – Solar panel testing with Mylar covers – Battery longevity testing – Payload thermal testing

20
Expected Science Results Temperature vs. Altitude Initial expectation Temperature falls as altitude increases Expectation after research Temperature falls to -50 degrees Fahrenheit at about 50,000ft

21
Expected Science Results Pressure vs. Altitude Expectation – Pressure falls with altitude

22
Expected Science Results Sound vs. Altitude Initial expectation – Pitch will change as altitude increases – Sound will become more quiet

23
Expected Science Results Balloon size, blackness of sky vs. Altitude Expectation of Balloon – Balloon will expand as altitude increases – Obvious, with decrease in pressure Expectation of blackness – Blackness starts at center of camera, opens up

24
Expected Science Results Voltage output of Solar Panels vs. Altitude Expectation – Less molecules in the air – Less “stuff” in the way – More sunlight will hit solar panels – More energy generated

25
Flight Day Overall it was a decent flight. Some things needed to be fixed before the flight. We got everything to work, and everything was strapped in.

26
Preflight Styrofoam didn’t work well as far as sealing the box.

27
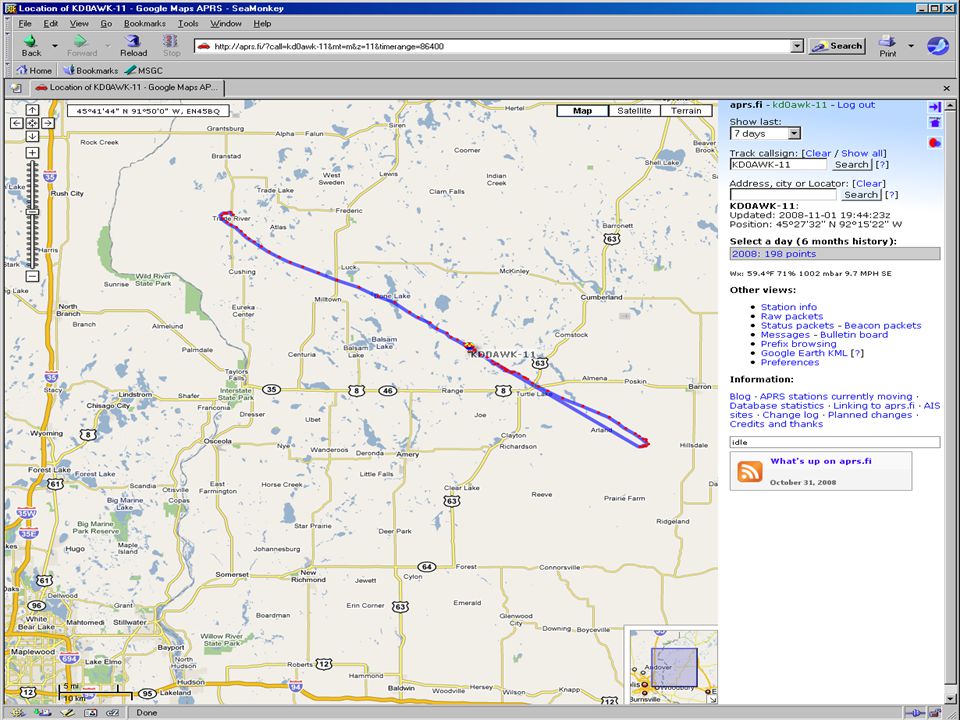
The Chase

29
Post-Flight Great landing. The status of the equipment was about half-and-half. Nothing was very cold. Some wires had popped out. The filters on the solar panels were completely torn apart.

30
Technical Difficulties After the flight, the camera seemed to be “frozen”. For some reason, the camera didn’t seem to have recorded anything. Still having trouble with the video. The batteries in the recording device had died but we managed to get a long enough recording.

31
Science Results

33
Pressure Data Conclusion: Our pressure data relatively fit to the change in altitude. The pressure decreased when altitude increased, and the pressure increased when the altitude decreased. The pressure and altitude graphs both roughly peaked around 105 minutes to 115 minutes. Conclusion: Our pressure data relatively fit to the change in altitude. The pressure decreased when altitude increased, and the pressure increased when the altitude decreased. The pressure and altitude graphs both roughly peaked around 105 minutes to 115 minutes.

34
Roughly peak flight, around 105 minutes, pressure reaches minimum value. Balloon reaches peak altitude around 115 minutes.

35
Temperature Data Conclusion: Not all, but some of our temperature data graph did fit our graph of altitude. As the altitude increases from the flight time of 0 minutes to around 55 minutes, the temperature decreases. But around 55 minutes the temp increases till around 105 minutes, which is around peak altitude. This might be because the heater could have started to take affect. But after the balloon popped the temp decreased dramatically, about 60 degrees C, but then slowly rose for the rest of the flight.

36
Balloon reaches peak altitude around 115 minutes. Around 105 minutes near peak altitude of flight.

37
Audio Experiment Initial Hypothesis : As altitude increased the frequency of the sound beacon would shorten, giving the sound beacon a higher pitch. Conclusion : Experiment didn’t show the expected results. As the altitude increased the frequency stayed the same, except for the volume of the beacon. As the altitude increased the volume decreased. Experiment Problems : Our audio recorder ran out of battery power, but luckily the video recorder recorded the audio for the flight.

38
Solar Panel Experiment Hypothesis : Record the voltage input change of the solar panels as the altitude increased. Conclusion : The experiment was inconclusive. The solar panels tapped out at a voltage around 2.456 V, when the max was supposed to be around 5 V. So the full test of was not able to be carried out fully. Faults : The Mylar foil over the panels might not have been placed on properly, or the settings for the HOBO might not have been set up correct.

39
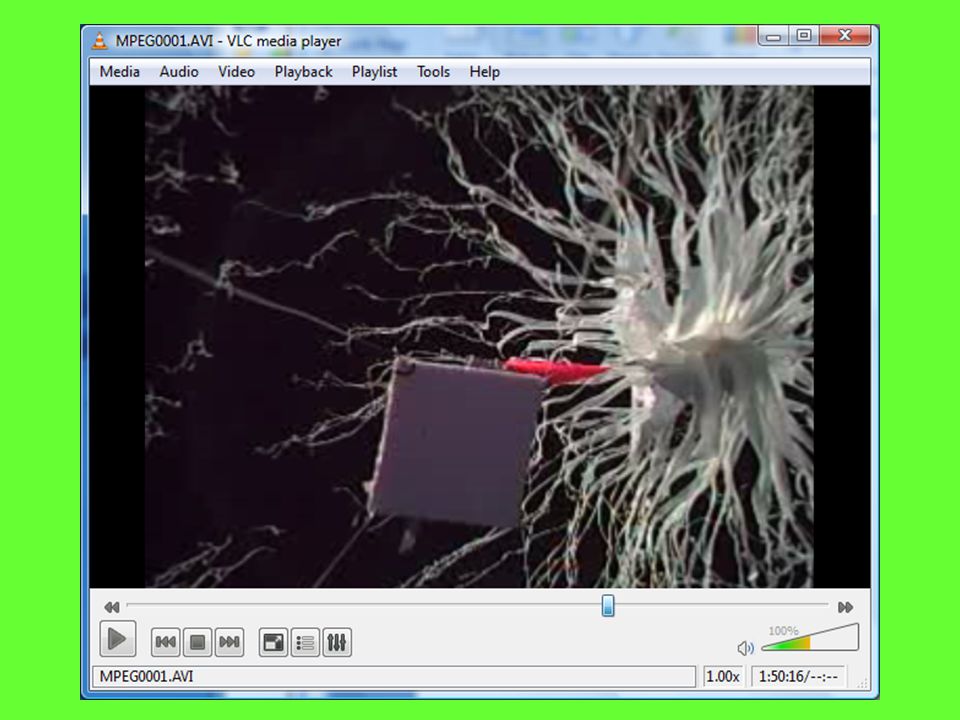
Visual Experiment Hypothesis: Our video camera was to be used to help out the Rockettes on their experiment of the ideal gas law. We placed the camera upwards, facing the balloon to watch the expansion of the balloon, and for the popping of the balloon.

40
The balloon starts the pop from a single point and starts to tear across the balloon.

41
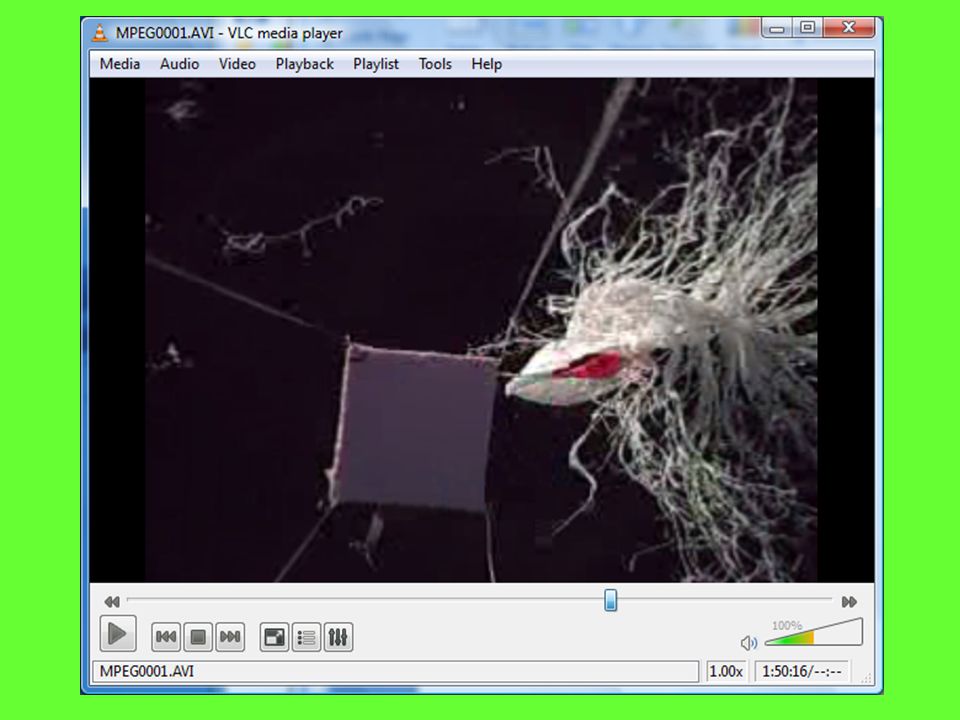
As the Balloon pops, the general shape of the balloon is still kept. The balloon still tears across it in one direction.

44
Visual Experiment Conclusion: We concluded that by the end of ascension, the balloon increased in size to around 30 ft in diameter. The average velocity of the balloon popping is distance/time. The whole popping of the balloon took less than one frame (1/30 of one second) to go 30 ft. Which would give the popping a velocity of over 900 ft/sec.
 to go 30 ft. Which would give the popping a velocity of over 900 ft/sec..")
45
Solar Panels: We had inconclusive data as to the meaning of our data because the voltage maxed out at slightly over 2.5 V when the panels were rated for 5 V output when saturated. Audio Recording: We disproved our hypothesis that frequency would change as altitude increased. Instead we proved that volume is what decreases as altitude increases. This is because there is less air for the sound waves to travel through. Video Recording: We showed that the burst rate of the balloon was significantly fast reaching velocities greater than 900 ft/s as can be best guessed from still photos. Temperature and Pressure Recordings: We showed that temperature primarily decreases as altitude increases, with few variations. We also proved showed that pressure is continually decreasing as altitude increases.

46
1.Solar Panels: Another option would be to try different kinds of Mylar and other filters to determine which the best would be for trying to measure the change in intensity of solar radiation as altitude increases. 2.Audio Recorder: A way to take this experiment further would be to test for the change in volume of a consistent noise (siren). This would yield far better data for determining the relationship between air density and sound. 3.Video Recorder: A useful video that might be valuable is a video of the payloads from the bottom of the topmost payload that would record the movements of the payloads. This would determine the abuse and chaos that ensues as both during assent and during the fall.
. This would yield far better data for determining the relationship between air density and sound. 3.Video Recorder: A useful video that might be valuable is a video of the payloads from the bottom of the topmost payload that would record the movements of the payloads. This would determine the abuse and chaos that ensues as both during assent and during the fall..")
48
Always ask for what exactly is expected of you before you decide to do it. Taking on less is always better than taking on more than you can handle or expected.

49
Always set an alarm for important meetings. No matter how important they may seem you still might forget about them.

50
It takes less work to get something done early, than do get something done late. Give yourself a break and get-er-done.

51
A special thanks goes out to Scott Balaban, our mentor and advisor, who helped us plan out several important aspects of our experiment.

Similar presentations