Download presentation
Presentation is loading. Please wait.

1
WP5 - Estimated Time of Arrival: verification of the F-Man approach and identification of effects on fleet management Athens -Greece 23-25 Sept 2004 National Technical University of Athens

2
CONTENT National Technical University of Athens 1.Verification of the ETA approach > Method #1 – Using statistical records > Method #2 - Through F-man pilot 2.Identification of the ETA effects in fleet management

3
Ideal Data required National Technical University of Athens Data Requirements for verification of ETA approach Statistical data (e.g. for 5 years) from international transport cases where scheduled arrival/departure times as well as actual arrival/departure times should be recoded in all itinerary stations (the knowledge of the reason of delay could be also quite useful).
 from international transport cases where scheduled arrival/departure times as well as actual arrival/departure times should be recoded in all itinerary stations (the knowledge of the reason of delay could be also quite useful)..")
4
Data availability National Technical University of Athens Available data: 1. National corridor: Alcantara–Lisboa–Entrocamento–Pamhilhosa-Gaia–Leixoes. Available records: 287 Period: Jan 2002 to March 2004. Data adequate for elaboration: 259 2. Three international corridors (portuguese part) (I) Bobadela (PT)- Irún (SP) (II) Alcantara (PT)-Vigo (SP) (III) Vigo (SP)- Alcantara (PT) Available records: 340 Period: Jan 2002 to March 2004. Data adequate for elaboration: 266
 (I) Bobadela (PT)- Irún (SP) (II) Alcantara (PT)-Vigo (SP) (III) Vigo (SP)- Alcantara (PT) Available records: 340 Period: Jan 2002 to March Data adequate for elaboration: 266.")
5
Data elaboration by use of an on-purpose software tool National Technical University of Athens For the analysis of appropriate information from the raw data provided by the Portuguese railways in electronic form a dedicated software program was developed. This software searches automatically the numerous records provided to identify scheduled and actual arrival and departure times for user-selected itineraries (described through origin and destination stations), then calculates the relevant delay and stores the data in Excel format to allow further processing.
, then calculates the relevant delay and stores the data in Excel format to allow further processing..")
6
Verification Process National Technical University of Athens Based on the above data sets (although a great discrepancy exists between the ideally required and the available information) two verification approaches were identified: 1.A verification check based solely on statistical methods where the Alcantara–Leixoes data set were used. The data sample was split in two parts. The first part was used for the calibration of the ETA function while the second one was used for the verification test 2.A verification check based on data/information collected through the F-MAN pilot runs where the provided statistical information from Bobadela-Irún, Alcantara-Vigo and Vigo-Alcantara were used to calibration of ETA functions

7
Verification Process National Technical University of Athens Test-a Test-b

8
ETA method verification using statistical data for the corridor Alcantara-Leioxoes National Technical University of Athens The calibration of ETA functions was performed by use of 2003 records. The testing of ETA predictability was performed by use of 2004 records The station of observations used was Entrocamento (at 113 km distance from Alcantara) The destination station used was Leixoes (at a 364 km distance from Alcantara).
 The destination station used was Leixoes (at a 364 km distance from Alcantara)..")
9
Calibration of ETA functions (based on 2003 data for Alcantara-Leioxoes Corridor) National Technical University of Athens Area 1 Area 2 Area 3 Area 4
 National Technical University of Athens Area 1 Area 2 Area 3 Area 4")
10
Early departure from Entrocamento station (prior to the scheduled departure time) (Delay at Origin<0) National Technical University of Athens
 (Delay at Origin<0) National Technical University of Athens")
11
On time departure from Entrocamento station (Delay at Origin=0) National Technical University of Athens
 National Technical University of Athens")
12
Delayed departure from Entrocamento (Delay >0) National Technical University of Athens 82%
 National Technical University of Athens 82%")
13
Frequency & Cumulative distribution of actual delay at Leixoes fir delay at Entrocamento>0 National Technical University of Athens

14
Frequency & Cumulative distribution of actual delay at Leixoes fir delay at Entrocamento>0 National Technical University of Athens

15
Success and Failure Types SUCCESS II: Wagon REJECTED for USE and NOT ARRIVED ON TIME SUCCESS I: Wagon accepted for USE and ARRIVED ON TIME FAILURE I: Wagon accepted for USE and NOT ARRIVED ON TIME FAILURE II: Wagon REJECTED for USE and ARRIVED ON TIME

16
Testing ETA predictability using statistical information (Time margin=0,5 hours)- Sample 2004 Testing predictability method for time margin of delay at Leixoes=0,5 hours
- Sample 2004 Testing predictability method for time margin of delay at Leixoes=0,5 hours")
17
Testing ETA predictability using statistical information (Time margin=1 hour)-Sample 2004 Testing predictability method for time margin of delay at Leixoes=1 hour
-Sample 2004 Testing predictability method for time margin of delay at Leixoes=1 hour")
18
Testing ETA predictability using statistical information (Time margin=2 hours) –Sample 2004 Testing predictability method for time margin of delay at Leixoes= 2 hours
 –Sample 2004 Testing predictability method for time margin of delay at Leixoes= 2 hours")
19
Testing ETA predictability using statistical information (Time margin=0,5 hours)- Sample 2002 Testing predictability method for time margin of delay at Leixoes=0,5 hours
- Sample 2002 Testing predictability method for time margin of delay at Leixoes=0,5 hours")
20
Results of testing ETA predictability (I) The results of the above analysis indicate high success rates (“Use” cases subset) of ETA forecast, for all time margins. However, the subset of “Reject” cases is systematically under estimated. The reason for this is that train delays in 2004, are significantly lower than those of 2003 (see Figure 14). This probably happens because the operating conditions on the specific corridor favorably evolve.
. This probably happens because the operating conditions on the specific corridor favorably evolve..")
21
Results of testing ETA predictability with the sample of 2002)
")
22
Results of testing ETA predictability with the sample of 2004

23
Reject cases underestimation Average delay of arrival at Leixoes (destination station) per month
 per month")
24
ETA method verification using data from pilot runs The calibration of ETA functions was performed by use of 2003 records for the portuguese part of the international corridor Bobadela- Irun. The station of observations used was Entrocamento (at 106km distance from Bobadela) The destination station used was Vilar Formoso (at a 327 km distance from Bobadela). The testing of ETA predictability will be performed based on information from SMS messages produced during the pilot run process
 The destination station used was Vilar Formoso (at a 327 km distance from Bobadela). The testing of ETA predictability will be performed based on information from SMS messages produced during the pilot run process.")
25
Calibration of ETA functions (pilot)
")
26
Early departure from Entrocamento station (prior to the scheduled departure time) (Delay at Origin<0)
 (Delay at Origin<0)")
27
On time departure from Entrocamento station (Delay at Origin=0)
")
28
Delayed departure from Entrocamento (Delay >0)
")
29
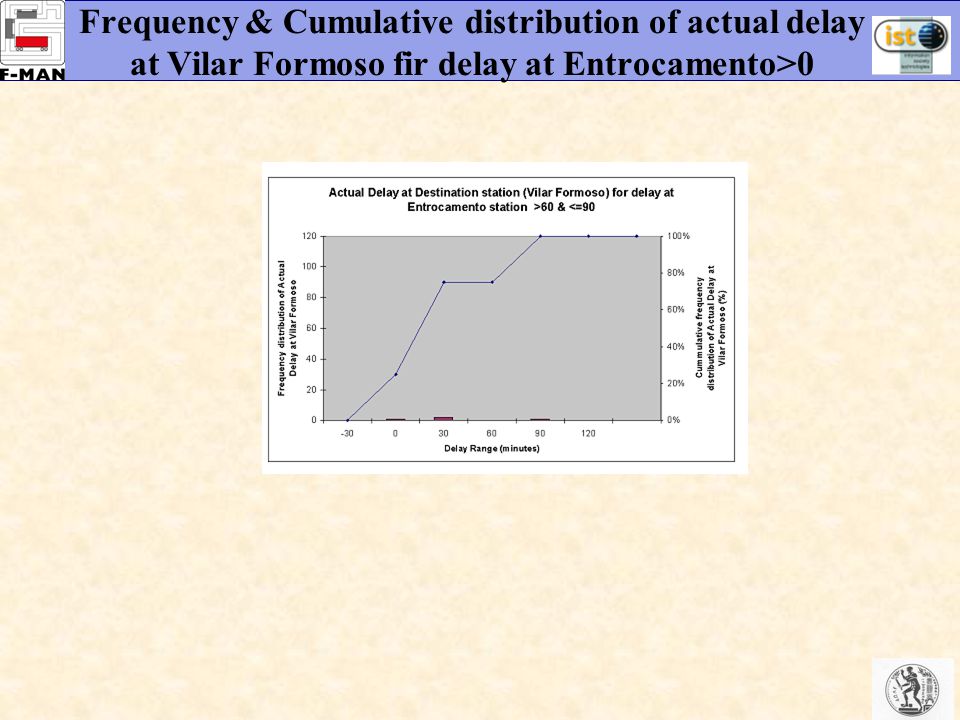
Frequency & Cumulative distribution of actual delay at Vilar Formoso fir delay at Entrocamento>0

31
Testing predictability by use of data from the pilot run the ongoing process of ETA verification through Concerns this step. The procedure is similar to the one presented in the case of using historical data from national corridor Alcantara-Leixoes but instead of the 2004 statistical sample information from SMS messages will be used.

32
Understanding ETA effects: Simplified examples (Example #1)
")
33
Understanding ETA effects: Simplified examples (Example #2)
")
Similar presentations
 * DOS (Disk Operating System ) * GW-Basic ( Computer Programming Language) * Windows ( Computer.>")


>")


